A Mathematical Model for Cathodic Delamination of Coated Metal ...
A Mathematical Model for Cathodic Delamination of Coated Metal ...
A Mathematical Model for Cathodic Delamination of Coated Metal ...

You also want an ePaper? Increase the reach of your titles
YUMPU automatically turns print PDFs into web optimized ePapers that Google loves.
Journal <strong>of</strong> The Electrochemical Society, 155 5 C279-C292 20080013-4651/2008/1555/C279/14/$23.00 © The Electrochemical SocietyA <strong>Mathematical</strong> <strong>Model</strong> <strong>for</strong> <strong>Cathodic</strong> <strong>Delamination</strong> <strong>of</strong> <strong>Coated</strong><strong>Metal</strong> Including a Kinetic pH–Porosity RelationshipMei-Wen Huang, a Christian Allely, b Kevin Ogle, c and Mark E. Orazem a, * ,za Department <strong>of</strong> Chemical Engineering, University <strong>of</strong> Florida, Gainesville, Florida 32611, USAb ArcelorMittal Research, Maizières-les-Metz, Francec Laboratoire de Physicochimie des Surfaces, CNRS UMR7045, Ecole Nationale Supièrieure de Chimie deParis, 75005, Paris, FranceC279A mathematical model <strong>for</strong> the delamination <strong>of</strong> coating from active metal was developed in the presence <strong>of</strong> multiple electrochemicalreactions, homogeneous reactions, and precipitation <strong>of</strong> corrosion product. The computational results illustrate that the propagation<strong>of</strong> potential front is controlled by the production <strong>of</strong> OH − ions along the metal–coating interface, while that <strong>of</strong> porosity frontis limited by the rate constant <strong>of</strong> bond-breakage reactions. The movement <strong>of</strong> the two fronts are close when the time constantassociated with breaking bonds is small as compared to that <strong>of</strong> diffusion and migration processes. When the time constants <strong>of</strong>bond-breakage and coating degradation are large, the velocity difference between the potential and porosity fronts becomes large.The delamination rate and delamination mechanism predicted from the model are in good agreement with experimental interpretations.A systematic sensitivity analysis <strong>for</strong> the fitting parameters used in the program was conducted and the results show that thecomputations are most sensitive to the parameters in the porosity–pH relation.© 2008 The Electrochemical Society. DOI: 10.1149/1.2884857 All rights reserved.Manuscript submitted October 25, 2007; revised manuscript received January 22, 2008. Available electronically March 24, 2008.Reactive metals in automotive and architectural applications are<strong>of</strong>ten protected by organic/oxide/polymer coatings with the polymerfilm thickness on the order <strong>of</strong> 1–100 m. The organic coating <strong>for</strong>msa physical barrier between metal and atmosphere and provides amatrix in which other additives and/or inhibitors are solubilized ordispersed. 1 Despite this, under many circumstances, water, oxygen,and other aggressive species may penetrate the polymer coatingcausing the buried metal surface to become electrochemically active.When the electrochemically active surface under the paint isnear a defect where the base metal is exposed, an electrochemicalcell may be set up in which the underpaint region becomes cathodic.For many systems, the confinement <strong>of</strong> the cathodic reaction underthe paint leads to cathodic delamination, a progressive loss <strong>of</strong> adhesionwith the progression <strong>of</strong> the delaminated or disbonded zone.Various mechanistic hypotheses have been reviewed. 1-3 Althoughthe mechanism remains obscure, it is generally agreed that oxygenreductionproducts or intermediates such as hydroxide, peroxide, orfree radicals are responsible <strong>for</strong> the bond-breaking reaction. Ogle etal. 4 have demonstrated that there is a direct relationship between thecathodic current density under the paint and the delamination rateand have proposed that the rate-limiting step involves the destruction<strong>of</strong> the conversion layer due to the alkaline electrolyte <strong>for</strong>med inthe confined area under the paint. 5,6Stratmann et al. 7-16 investigated experimentally the delamination<strong>of</strong> coated steel and coated electrogalvanized steel <strong>for</strong> model systemsnear an artificial defect. Following the interpretation reported byStratmann et al., 10-16 the cathodic delamination system consists <strong>of</strong> adefect where the bare metal is exposed to atmosphere, a delaminatedzone where the interfacial bonding is partially damaged due to thedelamination process, and an intact zone where no reaction has occurred.Exposure <strong>of</strong> the metal surface to atmosphere favors metaldissolution at the defect. Along the delaminated zone, where theanodic reactions are inhibited by the presence <strong>of</strong> the coating, oxygenand water penetrate the coating and react at the interface. The experimentalresults reported by Stratmann et al. indicated that duringthe delamination process the coating is converted into a gel-likemedium and the adhesive bonding at the metal-coating interface isweakened. 10-16 The interfacial potential distributions measured byscanning Kelvin probe revealed the propagation <strong>of</strong> delaminationaway from the defect with a well-defined delamination front. Fromthe experimental interpretations, Stratmann et al. concluded that therate-determining step <strong>of</strong> the cathodic delamination is driven by the* Electrochemical Society Fellow.z E-mail: meo@che.ufl.edutransport <strong>of</strong> the cations from the defect to the front region and thatthe propagation rate scales with the ionic strength and the mobility<strong>of</strong> the cations. 11-14Experimental observations have shown that the later stage <strong>of</strong> thedelamination becomes complicated when passive films or corrosionproducts are <strong>for</strong>med underneath the coating. 15,4 Furbeth and Stratmannreported that under a high CO 2 partial pressure, <strong>for</strong>mation <strong>of</strong>ZnCO 3 inhibits the electron transfer <strong>of</strong> oxygen reduction, resultingin a pure anodic delamination <strong>for</strong> coated electrogalvanized steel. 15The precipitation <strong>of</strong> ZnOH 2 or ZnO at the defect prevents corrosion<strong>of</strong> the uncoated area; there<strong>for</strong>e, the cathodic reaction becomesdominant on the scratch <strong>for</strong> coated zinc samples. Moreover, afterlonger-time exposure, as the delamination front moves further awayfrom the defect, both anodic and cathodic regions can appear underthe paint, and it becomes difficult to distinguish whether the movingfront is anodic or cathodic.It has proven difficult to demonstrate that a proposed mechanismdoes indeed give the observed experimental results. Interpretation is<strong>of</strong>ten limited to qualitative and subjective observations. There<strong>for</strong>e, aquantitative approach is necessary. Allahar et al. developed the firstmathematical model <strong>for</strong> the cathodic delamination <strong>of</strong> coatedmetal. 17,18 The key to their work was to use porosity to represent theinterfacial adhesive strength and to relate the interfacial porositywith local pH. The concept <strong>of</strong> pH-dependent porosity proposed intheir model provided an approach to account implicitly <strong>for</strong> bondbreakingphenomena during the delamination process. This concepttacitly assumes that the hydroxide species is the aggressive agent inthe bond-breaking mechanism, or at least that the hydroxide concentrationincreases monotonically with the concentration <strong>of</strong> an aggressiveintermediate as suggested in Ref. 4-6. The simulation resultsshowed qualitative agreement with the experimental observations byStratmann’s group, 10-15 which supported the hypotheses used in thismodel. However, their work did not incorporate chemical reactionsthat might take place at the later stages <strong>of</strong> the delamination.The objective <strong>of</strong> the work was to develop a mathematical model<strong>for</strong> the propagation <strong>of</strong> delamination that accounts <strong>for</strong> coupled transport<strong>of</strong> ionic species, the influence <strong>of</strong> changes in local porosity, andthe influence <strong>of</strong> electrochemical and homogeneous chemical reactions.The chemical reactions included homogeneous reactions in theinterfacial oxidized layer and <strong>for</strong>mation <strong>of</strong> corrosion product underneaththe coating. A second objective was to examine whether thedelamination rate and the delamination mechanism predicted fromthe model agree with the experimental results. The model presentedhere is similar to that presented by Allahar, 17,18 but a different numericalalgorithm was employed to incorporate the homogeneousand precipitation reactions.
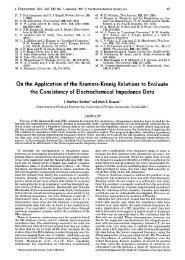
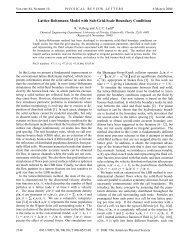
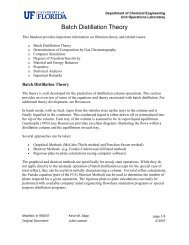
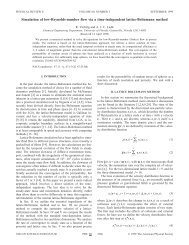
C280Journal <strong>of</strong> The Electrochemical Society, 155 5 C279-C292 2008Figure 1. Schematic representation <strong>of</strong> cathodic delamination <strong>of</strong> a coatedmetal, following the interpretation obtained by Stratmann et al. 13-15 and takenfrom Ref. 18. The system consists <strong>of</strong> a defect where the metal is exposed toan electrolyte and a delaminated zone where the interface adhesive strengthis partially broken.Theoretical DevelopmentFurbeth and Stratmann 13-15 reported that the cathodic delaminationprocess on a coated metal with a coating defect was the result <strong>of</strong>a galvanic couple <strong>for</strong>med between the defect and the intact zone.<strong>Cathodic</strong> reactions at the metal–coating interface were balanced byanodic reactions at the bare metal exposed by the defect. A schematicrepresentation <strong>of</strong> the cathodic delamination system, followingthe physical description provided by Stratmann et al., is illustrated inFig. 1. 13-15 The detached area represents a coating defect in whichthe metal surface is exposed to an electrolyte <strong>of</strong> NaCl. Adjacent tothe defect is the delaminated region where part <strong>of</strong> the adhesivebonding has been weakened due to the cathodic delamination process.Furthest from the detached region is the intact region in whichthe coating is in pristine condition and the delamination has not yetoccurred.Following the approach taken by Allahar et al., 17,18 interfacialporosity was employed in the mathematical model to characterizethe transition from a detached region to an intact region in thedelamination system. The porosity in the detached defect regionmust be equal to unity. The smallest porosity should be seen in theintact region, and the porosity in the delaminated region should belarger because the coating is partially degraded into an oxidized gellayer. The qualitative representation <strong>of</strong> porosity given in Fig. 1 reflectsthe concept that the porosity changes from a value associatedwith the detached defect to a value associated with the intact region.The use <strong>of</strong> porosity provided an implicit approach that accounts <strong>for</strong>the breakage <strong>of</strong> adhesive bonds between the coating and the metalduring the delamination process. 17,18Through the assumption that the coating thickness is muchsmaller than the length <strong>of</strong> the delaminated domain, the development<strong>of</strong> the model was simplified to a one-dimensional 1D problem. Thesignificance <strong>of</strong> the defect was included implicitly at the boundarysharing with the defect. The delaminated zone was initially dividedinto the three regions seen in Fig. 1 in order to characterize thetransition <strong>of</strong> porosity within the domain. However, the inter-regionaldelaminated-front and front-intact boundaries were not fixedduring the simulation. The motion <strong>of</strong> inter-regional boundariescan there<strong>for</strong>e be attributed to a consequence <strong>of</strong> the contributingphenomena. 17,18Mass transport.— In the present model, the delaminated zonewas considered to be a porous medium. The governing equations ina porous medium were derived from those in an aqueous medium. Ina dilute and stagnant electrolytic solution, the flux N i is expressed bythe Nernst–Planck equation 19N i =−z i c i F D iRT − D i c i1where z i is the charge number, F is Faraday constant, is theelectrostatic potential, and D i is the diffusion coefficient <strong>of</strong> species i.The terms on the right represent the contribution by migration anddiffusion to the flux <strong>of</strong> a species, respectively.In a porous medium, the effective diffusion coefficient <strong>of</strong> a speciesD * iwas related to the porosity <strong>of</strong> the domain by Bruggemanapproximation 19,20 i.e.D * i= 1.5 D i2The estimated value <strong>of</strong> porosity was based upon the experimentalobservations by Stratmann et al. that the diffusion coefficient <strong>of</strong>species in the degraded layer is approximately 2 orders <strong>of</strong> magnitudesmaller than that in an aqueous environment. 12 The combination <strong>of</strong>Eq. 1 and 2 yields the mass conservation <strong>of</strong> species in a porousenvironment in terms <strong>of</strong> N i and asc i=− · 1.5 N i + R i 3twhere the term on the left side represents the change <strong>of</strong> concentrationwith time and the terms on the right side represent the net inputdue to the flux and the net rate <strong>of</strong> production by homogeneousreactions R i , respectively.pH-Dependent porosity.— Furbeth and Stratmann 13 reported thatduring the cathodic delamination process, the coating degraded intoa gel-type medium and the adhesive bond between the coating andthe metal was weakened. The OH − ions produced in oxygen reductionunderneath the paint were implicated in adhesion loss. Allaharet al. 17,18 proposed that the interfacial porosity used to represent thestrength <strong>of</strong> the interfacial bonds was dependent on the local pH.Following the approach by Allahar et al., 17,18 an assumed porositytransition in the delaminated domain is presented in Fig. 2a as afunction <strong>of</strong> position. Three transition regions are observed in Fig. 2a.The porosity decreases gradually with position in the delaminatedregion where the delamination has occurred. In the front regionwhere the delamination is ongoing, the porosity shows an abruptdecrease with position. The porosity remains unchanged in the intactregion where the delamination has not yet occurred.The porosity–pH relation presented here was established basedon the assumption that the interfacial bonds between the metal andthe coating are attacked by the OH − ions produced underneath thepaint. However, as reported by Leng et al. 12 and Grundmeier et al., 21radical peroxide intermediates generated in the oxygen reduction arealso possible species that destroy the metal-coating interface. If theintermediates are major species that break interfacial bonds, the oxygenreduction needs to be treated as a multiple-step reaction mechanisminstead <strong>of</strong> an elementary reaction.Experimental results revealed that the concentrations <strong>of</strong> two majorspecies, OH − and Na + , were approximately equal in the delaminatedzone. 13 The distribution <strong>of</strong> local pH can, there<strong>for</strong>e, be constructedaccording to the c Na + distribution obtained from X-rayphotoelectron spectroscopy analysis. 13 Because the degradation <strong>of</strong>the coating and the loss <strong>of</strong> adhesion during the delaminated processwas implicated to the the production <strong>of</strong> OH − ions, the interfacialporosity was linked to pH using 17,18b ,1pH =1 + expb ,2 pH − b ,3 + b ,4 4where b ,1 to b ,4 are fitting parameters. 17,18 The relation betweenthe interfacial porosity and local pH is plotted in Fig. 3. Equation 4represents a simplification <strong>of</strong> the model used by Allahar et al. 17,18and provides equivalent results with fewer parameters.The phenomena <strong>of</strong> bond-breakage and coating degradation involvechemical reactions. Equation 4 which governs the equilibriumrelationship between interfacial porosity and local pH, is only validunder the assumption that the time constants associated with the
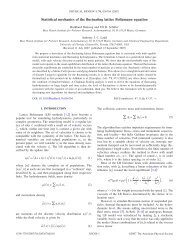
Journal <strong>of</strong> The Electrochemical Society, 155 5 C279-C292 2008C281Figure 2. Schematic diagrams <strong>for</strong> interfacial porosity and pH as functions <strong>of</strong> position in the delaminated zone. The dashed lines separate the domain into thedelaminated, front, and fully intact regions: a interfacial porosity and b local pH.bond-breakage reactions are sufficiently small. When the time constants<strong>for</strong> these phenomena are large compared to those <strong>for</strong> the processes<strong>of</strong> diffusion and migration, the equilibrium assumption becomesinvalid. A nonequilibrium relationship between and pH wasassumed to followt = k neq eq − 5where the equilibrium porosity eq is obtained in Eq. 4 and k neq isthe rate constant <strong>for</strong> the bond-breakage reactions. In the limit thatk neq → , the value <strong>of</strong> attains its equilibrated value = eq .Polarization kinetics.— The electrochemical reactions <strong>of</strong> interestin the cathodic delamination model involved zinc dissolutionZn → Zn 2+ +2e −6and oxygen reductionO 2 +2H 2 O+4e − → 4OH −7The polarization kinetic at the metal–coating interface was derivedfrom that applicable to the metal–electrolyte interface.Zinc dissolution.— In an aqueous environment with a bare metalsurface, the current density due to zinc dissolution i Zn follows aTafel behavior 22 i Zn = i o,Zn 10 V−E Zn / Zn 8Figure 3. Schematic diagram <strong>for</strong> distribution <strong>of</strong> interfacial porosity as afunction <strong>of</strong> local pH.where Zn , E Zn , and i o,Zn are the Tafel slope, equilibrium potential,and exchange current density, respectively, <strong>for</strong> the zinc dissolution.A poisoning factor w Zn was employed to calculate the current densitydue to the zinc dissolution at the metal–coating interface,i.e. 17,18Figure 4. Schematic diagram <strong>for</strong> distribution <strong>of</strong> kinetic parameters as a function <strong>of</strong> pH: a poisoning factor w Zn and b blocking factor w O2 .
C282Journal <strong>of</strong> The Electrochemical Society, 155 5 C279-C292 2008Table I. Fitting parameters used in the expressions <strong>of</strong> pHdependentinterfacial porosity, blocking, and poisoning factors.b i w Zn w O21 0.01 4.5 7.52 −3 −3.3 −73 10.8 10.4 9.84 0.001 −16 −0.55 — — −506 — — 11.17 — — −10i coat Zn = w Zn i o,Zn 10 V−E Zn / Zn 9The poisoning factor w Zn in Eq. 9 considered the effect <strong>of</strong> coatingand the availability <strong>of</strong> surface area to zinc dissolution during thedelamination. The factor also accounted implicitly <strong>for</strong> the presence<strong>of</strong> passive films <strong>for</strong>med on the metal surface. The poisoning factorw Zn was assumed to be a function <strong>of</strong> pH, and the construction <strong>of</strong> thew Zn –pH relationship was per<strong>for</strong>med in a manner similar to that <strong>of</strong>the –pH relationship. The resulting relation between w Zn and pH isshown in Fig. 4a and the mathematical expression isb wZn ,1w Zn pH =1 + expb wZn ,2pH − b wZn ,3 + b w Zn ,4 10where b wZn ,1 to b wZn ,4 were fitting parameters.Oxygen reduction.— Under the assumption that oxygen reduction ismass-transfer-limited at the metal–electrolyte interface, the limitingcurrent density in an aqueous medium is given as 22,23i lim,O2 = − nFD O 2c O2 11xwhere x is the distance that oxygen diffuses through and c O2 , is theoxygen concentration in the bulk. In the presence <strong>of</strong> the coating andinterfacial oxidized layer, the limiting current density due to oxygenreduction at the metal–coating interface was calculated using 17,18coati lim,O2 1.5 1.5g c=−w O2 nFD O2 c O2 , 1.5 g g c + 1.5 c g m12where g m and g c are the thickness <strong>of</strong> the gel medium and the coating,respectively, and c and g are the porosity <strong>of</strong> the undegradedcoating and the gel medium, respectively. The assumption <strong>of</strong> themass-transfer-limited oxygen reduction employed in the presentmodel is not necessarily true <strong>for</strong> technical samples. As presentedlater, the parameter sensitivity analysis shows that the magnitude <strong>of</strong>the cathodic current density does influence the delamination.The blocking factor w O2 in Eq. 12 accounted <strong>for</strong> the influence <strong>of</strong>the coating and the oxidized layer on the transport <strong>of</strong> oxygen to themetal surface. The blocking factor w O2 was assumed to be a function<strong>of</strong> pH, and the construction <strong>of</strong> the w O2 –pH relationship was per<strong>for</strong>medin a manner similar to that <strong>of</strong> the –pH relation. The resultingw O2 –pH relation is presented in Fig. 4b and the mathematicexpression is written asw O2 pH=10 b w O2 ,1 /1+expb w O2 ,2 pH−b w O2 ,3 +b w O2 ,4 /1+expb w O2 ,5 pH−b w O2 ,6 +b w O2 ,7 13where b wO2 ,1 to b wO2 ,7 were fitting parameters.The pH dependence <strong>of</strong> the blocking factor w O2 , shown in Fig. 4b,was intended to quantify the qualitative understanding <strong>of</strong> thechanges on the metal surface in response to the <strong>for</strong>mation <strong>of</strong> adelamination front. Under the intact coating pH less than 9, thecoating and oxidized surface provide an effective barrier to oxygentransport to the metal surface, and the value <strong>of</strong> the blocking factor issmall. The blocking factor increases in the front region where thecoating porosity increases, physically reflecting an enhanced electrochemicalreactivity. At still larger values <strong>of</strong> pH, corresponding tothe delaminated region, <strong>for</strong>mation <strong>of</strong> precipitated corrosion productsreduces transport <strong>of</strong> oxygen to the metal surface. Thus, the blockingfactor has a maximum value in the delamination front region. Thevalues <strong>of</strong> the fitting parameters used in the pH-dependent interfacialporosity, blocking, and poisoning factors are listed in Table I.The theoretical development presented above follows that reportedby Allahar et al., 17,18 but modifications were made to reducethe number <strong>of</strong> the fitting parameters used in the program. Both theoriginal and the modified sets <strong>of</strong> parameters gave essentially thesame computational results.Homogeneous and precipitation reactions.— The oxygen reductiontaking place underneath the coating results in an increase <strong>of</strong> pHin the interfacial degraded layer. For zinc, a series <strong>of</strong> chemical reactionsassociated with Zn 2+ hydrolysis and <strong>for</strong>mation <strong>of</strong> corrosionproduct ZnOH 2s are possible in alkaline solutions. 24,25 In thepresented model, multiple homogeneous reactions, including waterdissociation and a series <strong>of</strong> reactions associated with Zn 2+ hydrolysis,were considered. The mechanisms and equilibrium conditions <strong>of</strong>these chemical reactions are summarized in Table II. 25 All the homogeneousreactions were assumed to be equilibrated because thetime constants <strong>for</strong> reaching the equilibrium conditions were muchsmaller than that <strong>for</strong> the diffusion <strong>of</strong> the limiting reactant. 26,27The precipitated corrosion product ZnOH 2s is thermodynamicallystable within the pH ranging from 8.5 to 11. 24,25 The reaction<strong>for</strong>ming solid ZnOH 2s was assumed to followZn 2+ + 2OH − → ZnOH 2s14The rate <strong>of</strong> production <strong>of</strong> ZnOH 2s depends strongly on the concentrations<strong>of</strong> Zn 2+ and OH − ; thus, the precipitation rate was relatedto c Zn 2+ and c OH − byTable II. Reaction mechanism and equilibrium condition <strong>for</strong> homogeneous reactions included in the model. 25,24Reaction no. Homogeneous reaction Equilibrium condition1 H 2 O ↔ OH − +H + K w = c OH −c H +2 Zn 2+ +OH − ↔ ZnOH + log c ZnOH += −9.67 + pH3 ZnOH + + 2OH − ↔ HZnO − 2 +H 2 Olog4 HZnO − 2 +OH − ↔ ZnO 2− 2 +H 2 Ologc Zn 2+c HZnO2−c ZnOH +c ZnO22−c HZnO 2−= −17.97 + pH= −13.17 + pH
Journal <strong>of</strong> The Electrochemical Society, 155 5 C279-C292 2008C2832r s = kc OH − c Zn 2+ − K sp 15where k is a rate constant and K sp is the standard solubility product<strong>of</strong> ZnOH 2s at room temperature. 28 The difference between thetwo terms in the bracket at the right side <strong>of</strong> Eq. 15 represents thedriving <strong>for</strong>ce <strong>for</strong> <strong>for</strong>ming ZnOH 2s . Equation 15 provides an approach,in terms <strong>of</strong> the concentrations <strong>of</strong> Zn 2+ and OH − ions, toincorporate the solid species ZnOH 2s in the complex model.<strong>Mathematical</strong> development.— The propagation model simulatedthe evolution <strong>of</strong> the delamination process from given initial conditions.The propagation <strong>of</strong> front and the bond-breakage reactions accompanyingthe delamination process were modeled through thehypothesis that porosity and the polarization kinetics at the coating–metal interface were pH dependent. The dependent variables consideredin the model were potential and concentrations <strong>of</strong> OH − ,Na + ,Cl − ,H + ,Zn 2+ , ZnOH + , HZnO 2 − , ZnO 2 2− , and ZnOH 2s .Governing equations.— The solution was assumed to be electricallyneutral, i.e.9 z i c i =016i=1The governing equation <strong>for</strong> c i in a on 1D domain wasc i =− 1.5 N i + R i + S i 17t xwhere S i was the rate <strong>of</strong> production per unit volume by electrochemicalreactions. The conservation equations <strong>for</strong> the chemicallyinert species, Na + and Cl − , were obtained by assigning S Na + = 0 andS Cl − =0.The governing equations <strong>for</strong> the species participating in heterogeneousreactions, Zn 2+ and OH − , were <strong>for</strong>mulated asandc Zn 2+t=− 1.5 N Zn 2+x+ R Zn 2+ + i coatZn2F18c OH −=− 1.5 N OH −+ R OH − + i lim,O 219tx− Frespectively. The net production <strong>of</strong> Zn 2+ and OH − by the homogeneousreactions at any position was equal to zero, i.e.R Zn 2+ + R ZnOH + + R HZnO2 − + R ZnO2 2− =0 20andR OH − − R H + − R Zn 2+ +2R HZnO2 − +3R ZnO2 2− =0 21Substitution <strong>of</strong> R i <strong>for</strong> each species into Eq. 20 yielded the governingequations <strong>for</strong> c Zn 2+ and c OH −, respectively, i.e.G Zn 2+ − i coatZn2F + G ZnOH + + G HZnO− + G ZnO2 2− =0 222andcoatG OH − + i lim,O 2− F − G H + − G Zn 2+ + i Zn 2+2F +2G HZnO− +3G ZnO2 2− =02whereG i = c itcoat+ 1.5 N i xcoat2324The equilibrium conditions listed in Table II were applied as thegoverning equations <strong>for</strong> H + , ZnOH + , HZnO 2 − , and ZnO 2 2− . 24 The rate<strong>of</strong> <strong>for</strong>mation <strong>of</strong> the corrosion product ZnOH 2s was associatedFigure 5. The initial concentration distributions <strong>of</strong> OH − ,Na + ,Cl − , and Zn 2+ions along the metal–coating interface.with c Zn 2+ and c OH −; thus, the governing equation <strong>for</strong> c Zn 2+ wasexpressed asc ZnOH2st2= kc Zn 2+ · c OH −− K sp 25where k is a rate constant and K sp is the standard solubility product<strong>of</strong> ZnOH 2s with a value <strong>of</strong> 3 10 −17 mol/L 3 at roomtemperature. 15The phenomenon <strong>of</strong> bond breakage was treated under two conditions.Under the assumption that the time constants associatedwith bond-breaking reactions are sufficiently small, Eq. 4 was employedas the governing equation <strong>for</strong> the local interfacial porosity.The kinetic relation, given in Eq. 5, was treated as the governingequation when the time constants associated with bond-breaking reactionsbecome large.Boundary and initial conditions.— At the boundary with the defect,the solution potential and concentrations <strong>of</strong> chemical species werefixed to a bulk condition and c i, , respectively. The boundarycondition <strong>for</strong> the solution potential at the fully intact region remainedas the electroneutrality condition. A zero-flux boundary conditionN i = 0 was used <strong>for</strong> all species at the boundary in the fullyintact region.The objective <strong>of</strong> this work was to explore the propagation phase<strong>of</strong> the delamination process. Thus, an initial condition was establishedwhich reflected a system after the delamination had begun.The initial concentration distributions presented in Fig. 5 were constructedbased on the experimental data reported by Leng andStratmann. 10-12 The initial concentrations <strong>of</strong> Na + and OH − ions wereequal at any position in the delaminated domain. The shape <strong>of</strong> thec Cl − distribution followed that <strong>of</strong> the c Na + distribution. The concentrations<strong>of</strong> Na + ,Cl − , and OH − ions decreased monotonically with theposition in the delaminated and front regions. In the intact region,the concentrations <strong>of</strong> all species reached asymptotic values. Thedistribution <strong>of</strong> c Zn 2+ was obtained by satisfying electroneutrality at agiven position. The concentrations <strong>of</strong> the corrosion product and thespecies produced in the homogeneous reactions were assumed to bezero at t =0.Solution method.— The spatial derivative terms in the governingequations were approximated using the central finite differenceapproach, 29 where terms higher than the order <strong>of</strong> x 2 were neglected.The first order temporal derivative was used, where termshigher than the order <strong>of</strong> t were neglected. The system <strong>of</strong> coupled,nonlinear, partial-differential equations required an iterative method
C284Journal <strong>of</strong> The Electrochemical Society, 155 5 C279-C292 2008Figure 6. Calculated distributions <strong>of</strong> the interfacial potential along themetal–coating interface with elapsed time as a parameter.to converge on a solution starting from an initial guess. The tridiagonalBAND algorithm developed by Newman, 19 coupled withcentral-difference time steps was chosen to calculate the distribution<strong>of</strong> c i and in the delaminated domain. The mathematical modelwas developed using Micros<strong>of</strong>t Visual Fortran, Version 9.0 withdouble precision accuracy. 30Results and DiscussionThe geometric parameters used in the model included a coatingthickness g c =45m, a gel-medium thickness g c =5m, and a netlength <strong>of</strong> 0.8 cm <strong>for</strong> the delaminated, front, and intact regions. Theinitial lengths <strong>of</strong> these regions were 0.1, 0.05, and 0.65 cm, respectively.The input parameters <strong>for</strong> the simulation included the grid sizex =4 10 −4 cm, the time step t = 0.1 s, and the total time t= 60 min. The potential on the metal was chosen asV = −0.95 V SHE . The polarization parameters <strong>for</strong> zinc dissolutionincluded Zn = 0.04 V/decade, i 0,Zn = 0.008 A/cm 2 , and E 0,Zn= −0.763 V SHE .Equilibrium pH–porosity relation.— The computational resultscalculated using the equilibrium –pH relationship are presented inthis section.Interfacial potential distribution.— The calculated distributions <strong>of</strong>the interfacial potential V are presented in Fig. 6 with elapsed timeas a parameter. In the graphical presentations in the subsequent sections,t = 30 s was chosen as the initial condition to avoid the artificialityat t = 0. At a given time, the interfacial potential increaseswith distance away from the scratch and reaches a constant value inthe intact region. The constant plateau seen in Fig. 6 represents theintact region, and the length <strong>of</strong> the plateau shortens with elapsedtime. The shape <strong>of</strong> the potential distribution is maintained throughoutthe simulation, indicating that the phenomena and the hypothesesconsidered in the model sustain the potential pr<strong>of</strong>ile while thedelamination front propagates along the metal–coating interface.These features are consistent with the experimental results <strong>for</strong>coated electrogalvanized steel reported by Stratmann et al. 15 andWilliams et al. 31The interfacial potential presented by Allahar et al. showed anincrease <strong>of</strong> 40 mV in the intact region over a 30 min simulation. 17,18The inconsistency with the experimental results was attributed to thepropagation <strong>of</strong> errors in the time steps. 17,18 In order to make comparisonswith the results presented by Allahar, few simulations wereper<strong>for</strong>med in the absence <strong>of</strong> homogeneous and precipitation reactions.The resulting potential distributions, not shown here, weresimilar to the features observed in Fig. 6, which indicates that thechoice <strong>of</strong> the numerical algorithm influences strongly the accuracy<strong>of</strong> the computational results.Following the analysis reported by Leng and Stratman, 11 the interfacialpotential distributions were differentiated with respect toposition to yield dV/dx distributions, given in Fig. 7a, as a function<strong>of</strong> position with elapsed time as a parameter. The sharp peak marksthe deflection point <strong>of</strong> the sharp increase observed in Fig. 7a. Theposition <strong>of</strong> the peak, identified as the delamination front, propagatesaway from the defect with increasing time. The peak height correspondingto the magnitude <strong>of</strong> dV/dx decreases with increasingdelamination time. The decreasing trend is in agreement with theexperimental results reported by Leng and Stratmann. 11 The explanationgiven by Leng and Stratmann was that the electrochemicalpotential in the front region changes more gradually as delaminationtime increases. 11 The agreement with the experiments demonstratesthat the hypotheses <strong>of</strong> the pH-dependent interfacial porosity andpolarization kinetics were reasonable <strong>for</strong> the front propagation duringthe delamination process.The rate <strong>of</strong> propagation <strong>of</strong> the potential front, calculated from themaxima peak given in Fig. 7a, is presented in Fig. 7b. Similar to theobservations by Allahar et al., 18 the initial rate is large but decreasesexponentially with elapsed time. The delamination rate determinedby extrapolation to longer time was 1.66 mm/h, which is approximately23% less than the rate obtained by Allahar 18 but still twicelarger than the experimental rate <strong>for</strong> coated steel by Leng andStratmann. 12 The discrepancy between the theoretical and experimentalwork can be attributed in part to the use <strong>of</strong> the equilibratedpH–porosity relation in the model. The phenomena <strong>of</strong> bond breakageand coating degradation involve chemical reactions. The appli-Figure 7. a Calculated distributions <strong>of</strong> dV/dx along the metal–coating interface with elapsed time as a parameter and b instantaneous front velocity,calculated from the time-dependent position <strong>of</strong> the maxima given in a.
Journal <strong>of</strong> The Electrochemical Society, 155 5 C279-C292 2008C285Figure 8. Calculated distributions along the metal–coating interface with elapsed time as a parameter: a pH and b interfacial porosity .cation <strong>of</strong> the equilibrium pH–porosity relation assumes implicitlythat the time constants associated with breaking bonds are small.When time constants <strong>for</strong> bond-breakage phenomena are large ascompared to those <strong>for</strong> diffusion and migration, the assumption <strong>of</strong> anequilibrium pH–porosity relation becomes invalid. An investigation<strong>for</strong> nonequilibrium pH–porosity is presented in a subsequent section.pH and porosity distributions.— The calculated distributions <strong>of</strong> pHand porosity are presented in Fig. 8 as a function <strong>of</strong> position withelapsed time as a parameter. The calculated results show that the pHin the delaminated and front regions increases with time and remainsunchanged in the intact region. The increase in pH in the delaminatedand front regions is attributed to the OH − ions produced byoxygen reduction underneath the coating and by diffusion from theboundary with the defect. The trends associated in the porosity distributionin Fig. 8b are similar to those observed in the pH distributions,confirming that the destruction <strong>of</strong> the interfacial adhesion isrelated to the generation <strong>of</strong> OH − ions during the delamination process.In experiments, the active delamination front, where the delaminationis ongoing, is <strong>of</strong>ten determined by the potential distributionsmeasured using the scanning Kelvin probe. In the mathematicalmodel presented here, however, it is more reasonable to define thedelamination front by the porosity gradients, because the porosity isthe key to represent the adhesive strength between the metal and thecoating. 17,18The distribution <strong>of</strong> d/dx along the metal–coating interface ispresented in Fig. 9a as a function <strong>of</strong> position with elapsed time as aparameter. The sharp peak characterizes an interfacial porosity frontthat moves toward the intact region. The extrapolated velocity <strong>of</strong> theporosity front corresponding to the rate <strong>of</strong> breaking the interfacialadhesion was approximately 1.50 mm/h see Fig. 9b. This value is16% smaller than the porosity front rate reported by Allahar etal. 17,18 but still larger than the experimental result <strong>for</strong> coated steel. 12The discrepancy between the simulation and experimental rates canbe attributed in part to the use <strong>of</strong> the equilibrium pH–porosity relation,which yields to the upper limit <strong>of</strong> the propagation rate.Homogeneous reactions and precipitated corrosion product.— Theconcentration distributions <strong>of</strong> the species produced in the homogeneousreactions ZnOH + , HZnO − 2 , and ZnO 2− 2 are presented in Fig.10 as a function <strong>of</strong> position with elapsed time as a parameter. For allthree species, the concentrations decrease with position in thedelaminated and the front regions. During the course <strong>of</strong> simulation,the changes in concentration across the delaminated and the frontregions become more gradual as the delamination propagates intothe fully intact region.The precipitation <strong>of</strong> corrosion products ZnOH 2s has been observedin delamination systems and cut-edge corrosion systems. 32The distribution <strong>of</strong> c ZnOH2s calculated from the presented model isgiven in Fig. 11 as a function <strong>of</strong> position with elapsed time as aparameter. The <strong>for</strong>mation <strong>of</strong> ZnOH 2s was observed in all posi-Figure 9. a Calculated distributions <strong>of</strong> d/dx along the metal–coating interface with elapsed time as a parameter and b instantaneous front velocity,calculated from the time-dependent position <strong>of</strong> the maxima given in a.
C286Journal <strong>of</strong> The Electrochemical Society, 155 5 C279-C292 2008Figure 10. Calculated concentration distributions along the metal–coating interface with elapsed time as a parameter: a ZnOH + ions, b HZnO 2 − ions, and cZnO 2 2− ions.Figure 11. Calculated concentration distributions <strong>of</strong> precipitated corrosionproduct ZnOH 2s along the metal–coating interface with elapsed time as aparameter.tions in the delaminated zone, and the concentration <strong>of</strong> ZnOH 2sincreases with time in all positions. At a given time, the concentration<strong>of</strong> ZnOH 2s decreases with position in the delaminated andfront regions and maintains a uni<strong>for</strong>m value in the intact region.The concentration <strong>of</strong> the solid phase given in Fig. 11 can beexpressed in terms <strong>of</strong> a surface concentration by multiplying theconcentration by the 5 mm thickness <strong>of</strong> the gel-like layer. For allpositions, the estimated surface coverage is much less than a monolayer.The increase in surface concentration in the intact region withtime indicates that, under the conditions <strong>of</strong> the simulation, equilibriumor steady-state behavior was not observed.The influence <strong>of</strong> the homogeneous and precipitation reactions onthe delamination was investigated by comparing the simulation resultswith those obtained in the absence <strong>of</strong> the reactions. The comparisonindicates that, in this particular study, these reactions do nothave a strong impact on the rate or mechanism <strong>of</strong> the delamination.Homogeneous and precipitation reactions can be important when alarge amount <strong>of</strong> OH − ions underneath the paint are consumed bythese reactions or when the corrosion product begins to passivate themetal surface. The results <strong>of</strong> the present model are controlled bytransport processes; thus, the production <strong>of</strong> ZnOH + , HZnO − 2 , ZnO 2− 2 ,and ZnOH 2s is not significant to the overall delamination.<strong>Delamination</strong> kinetics.— The delamination kinetics can be determinedby plotting the delaminated distance calculated from thedV/dx curve as a function <strong>of</strong> time. Williams et al. 33 employed ageneral power lawax del = k del t del26to describe the delamination mechanism, where x del , k del , and t del aredelaminated distance, rate constant, and delamination time, respectively.The kinetic analysis presented in the subsequent sections followsessentially that reported by Stratmann et al., 11,15 but one <strong>of</strong> theadvantages <strong>of</strong> the present model is that it allows comparison <strong>of</strong> themovements <strong>of</strong> the potential and porosity fronts.The delaminated distances determined by the potential and theporosity fronts are presented in Fig. 12a and b, respectively, as afunction <strong>of</strong> time in a double-logarithmic plot with cation species asa parameter. The calculated reaction order is approximately 0.56 <strong>for</strong>
Journal <strong>of</strong> The Electrochemical Society, 155 5 C279-C292 2008C287Figure 12. Delaminated distance as a function <strong>of</strong> elapsed time in double-logarithmic scale with cation type as a parameter: a delaminated distance determinedby potential front can be compared with Fig. 3 by Furbeth and Stratmann 15 and b delaminated distance determined by porosity front.the potential front and 0.6 <strong>for</strong> the porosity front. The slopes seen inFig. 12a and b are independent <strong>of</strong> the cation species, and the valuesare in close agreement with the reaction order <strong>of</strong> 0.52–0.59 determinedby Stratmann et al. 15 <strong>for</strong> polymer-coated electrogalvanizedsteel. One special simulation was per<strong>for</strong>med in which the electrochemicalproduction <strong>of</strong> OH − ions under the paint was minimized.The kinetic analysis <strong>for</strong> that simulation, not presented here, showsthe same reaction order observed in Fig. 12. These results demonstratethat the overall delamination process is primarily limited bythe mass transport <strong>of</strong> ions from the defect to the delamination front.Due to the coexistence <strong>of</strong> the potential and concentration gradients,the transport <strong>of</strong> ions represents the contributions by migration aswell as diffusion. For the present simulation, the diffusion termdominated.Influence <strong>of</strong> cation species on delamination rate.— The influence<strong>of</strong> cation type on delamination rate can be seen more clearly in Fig.13, where the delaminated distances calculated based upon the potentialand the porosity fronts are plotted as a function <strong>of</strong> the squareroot <strong>of</strong> time. A linear relation between the delaminated distance andsquare root <strong>of</strong> time is observed <strong>for</strong> all <strong>of</strong> the cation types. The rate <strong>of</strong>propagation decreases in the order <strong>of</strong> Cs + K + Na + Li + <strong>for</strong>both potential and porosity fronts, and this result is correlated to themobility <strong>of</strong> the cations in an aqueous medium Table III. The influence<strong>of</strong> anion species on the delamination rate was also examined inthe simulation. The results, not shown here, indicate that the delaminationis not sensitive to the anion species. The prediction from thepresent model is qualitatively consistent with experimental measurementsreported <strong>for</strong> coated steel and coated zinc systems. 11,15 Theconsistency with experiments demonstrates that, with the chemicaland physical assumptions, the delamination predicted from themodel is principally controlled by the transport <strong>of</strong> cations along themetal–coating interface and the rate <strong>of</strong> this process scales with themobility <strong>of</strong> the cations.Influence <strong>of</strong> electrolyte concentration on delamination rate.— Asreported by Leng and Stratmann, 11 the concentration <strong>of</strong> electrolyteplaced at the defect also influences the delamination rate. Thedelaminated distance is given in Fig. 14 as a function <strong>of</strong> the squareroot <strong>of</strong> time with electrolyte concentration as a parameter. Thehigher concentration at the threshold provides a larger driving <strong>for</strong>ceto couple galvanically the intact and defect zones; there<strong>for</strong>e, thepropagation rates determined by both potential and porosity frontsincrease with the electrolyte concentration. Two important conclusions<strong>of</strong> the kinetic analysis presented above are that the ratedeterminingstep <strong>of</strong> the cathodic delamination is driven by the transport<strong>of</strong> the cations from the defect to the front region and that thepropagation rate scales with the ionic strength and the mobility <strong>of</strong>the cations. This conclusion is in agreement with the interpretationpublished by Leng and Stratmann <strong>for</strong> coated steel. 11Nonequilibrium pH–porosity relation.— The use <strong>of</strong> the equilibriumpH–porosity relation presented above relies on the assumptionthat the chemical reactions associated with breaking interfacialFigure 13. Delaminated distance as a function <strong>of</strong> square root <strong>of</strong> time with cation type as a parameter: a delaminated distance determined by potential frontcan be compared with Fig. 3 by Leng et al. 11 and b delaminated distance determined by porosity front.
C288Journal <strong>of</strong> The Electrochemical Society, 155 5 C279-C292 2008Table III. Diffusion coefficients <strong>of</strong> cations. 28Type <strong>of</strong> cationLi +Na +K +Cs +D i in bulkelectrolyte cm 2 /s1.25 10 −51.47 10 −51.84 10 −52.10 10 −5bonds occur rapidly. This assumption becomes invalid when thetime constants <strong>for</strong> the bond-breaking reactions are large compared tothose <strong>for</strong> diffusion and migration processes. The investigation <strong>for</strong>nonequilibrium pH–porosity relation is presented below.Potential front and porosity front.— To explore the role <strong>of</strong> finiterates <strong>of</strong> bond breakage, the equilibrium relationship between porosityand pH, given as Eq. 4, was replaced by Eq. 5. Different values<strong>of</strong> k neq were examined in the simulations, but only the results <strong>for</strong>k neq = 0.1 and 0.001 s −1 are presented here.The resulting distributions <strong>of</strong> interfacial potential <strong>for</strong> k neq = 0.1and 0.001 s −1 are shown in Fig. 15 as a function <strong>of</strong> position withelapsed time as a parameter. The features in Fig. 15 were similar tothose observed in Fig. 6, which were obtained using the equilibriumpH–porosity relation. The distributions <strong>of</strong> the potential gradientdV/dx are shown in Fig. 16 as functions <strong>of</strong> position with elapsedtime as a parameter. The trends associated with the dV/dx plot <strong>for</strong>nonequilibrium pH–porosity relation are similar to those found usingthe equilibrium relation. The extrapolated delamination rates determinedby Fig. 16a and b were 1.63 and 1.55 mm/h <strong>for</strong> k neq= 0.1 and 0.001 s −1 , respectively. These values are slightly smallerthan the equilibrium delamination rate 1.66 mm/h, indicating thatthe use <strong>of</strong> the kinetic pH–porosity relation within the model influencedthe velocity <strong>of</strong> the potential front.The propagation <strong>of</strong> the potential fronts can be compared to that<strong>of</strong> the porosity fronts. The resulting distributions <strong>of</strong> d/dx <strong>for</strong> k neq= 0.1 and 0.001 s −1 are presented in Fig. 17 as functions <strong>of</strong> positionwith elapsed time as a parameter. The trends in Fig. 17 are similar tothose observed in Fig. 9a, which were obtained using the equilibriumpH–porosity relation. The velocity <strong>of</strong> the porosity front decreasesfrom 1.37 mm/h <strong>for</strong> k neq = 0.1 s −1 to 0.93 mm/h <strong>for</strong> k neq= 0.001 s −1 . The rate <strong>of</strong> propagation <strong>of</strong> the porosity front <strong>for</strong> k neq= 0.001 s −1 is much smaller than the equilibrium porosity front rate1.5 mm/h. This result confirms that the porosity front dependsstrongly on the nonequilibrium rate constant. The numerical valuesare in approximate agreement with the propagation rates reported byFurbeth and Stratmann. 15From the analysis presented above, it is evident that the velocity<strong>of</strong> the porosity front is controlled by the rate constant <strong>of</strong> the bondbreakagereactions. The velocity <strong>of</strong> the potential front, however, wasfound to follow the movement <strong>of</strong> the pH front. The pH gradientdistributions <strong>for</strong> k neq = 0.1 and 0.001 s −1 as functions <strong>of</strong> positionwith elapsed time as parameter are given in Fig. 18. The shape andthe features within the pH gradient distributions are similar to thoseseen in dV/dx and d/dx plots. The locations <strong>of</strong> the deflection pointsin Fig. 18a and b, termed pH front, are approximately equal to theFigure 14. Delaminated distance as a function <strong>of</strong> square root <strong>of</strong> time with electrolyte concentration as a parameter: a delaminated distance determined bypotential front can be compared with Fig. 6 by Leng et al. 11 and b delaminated distance determined by porosity front.Figure 15. Calculated distribution <strong>of</strong> interfacial potential gradient dV/dx along the metal–coating interface: a k neq = 0.1 and b 0.001 s −1 .
Journal <strong>of</strong> The Electrochemical Society, 155 5 C279-C292 2008C289Figure 16. Calculated distribution <strong>of</strong> interfacial potential gradient dV/dx along the metal–coating interface: a k neq = 0.1 and b 0.001 s −1 .position <strong>of</strong> the potential fronts in Fig. 16a and b, respectively. Thevelocity <strong>of</strong> the pH front changes from 1.63 to 1.55 mm/h when k neqdecreases from 0.1 to 0.001 s −1 . This result suggests that the change<strong>of</strong> pH along the metal–coating interface is an important factor thatinfluences the movement <strong>of</strong> the potential front.The influence <strong>of</strong> the rate constant k neq on the velocity <strong>of</strong> thepotential front, porosity front, and pH front is summarized in TableIV. When k neq decreased from infinity to 10 −4 s −1 , the rate <strong>of</strong> thepotential front decreased from 1.66 to 1.26 mm/h, and the rate <strong>of</strong>the porosity front decreased from 1.50 to 0.73 mm/h. The comparisonbetween the potential and pH front rates confirms that the movement<strong>of</strong> the potential front depends on the pH front. The change <strong>of</strong>the front velocities indicates that the values <strong>of</strong> k neq influence thepropagation <strong>of</strong> all fronts, but the influence is much more evident onthe porosity front.The limitation <strong>of</strong> k neq leads to an increasing velocity differenceFigure 17. Calculated distribution <strong>of</strong> porosity gradient d/dx along the metal–coating interface: a k neq = 0.1 and b 0.001 s −1 .Figure 18. Calculated distribution <strong>of</strong> pH gradient along the metal–coating interface: a k neq = 0.1 and b 0.001 s −1 .
C290Journal <strong>of</strong> The Electrochemical Society, 155 5 C279-C292 2008Table IV. Calculated velocities <strong>of</strong> potential, porosity, and pH front.Rate constantsk neq /s −1 Velocity <strong>of</strong> potential frontmm/hVelocity <strong>of</strong> porosity frontmm/hVelocity <strong>of</strong> pH frontmm/h 1.66 1.50 1.6910 −1 1.63 1.37 1.6110 −2 1.60 1.26 1.6010 −3 1.55 0.93 1.5510 −4 1.26 0.73 1.25between the potential and porosity fronts as k neq decreases. The concentrationgradient <strong>of</strong> OH − ions within the two fronts creates a driving<strong>for</strong>ce <strong>for</strong> the bond-breakage reactions. As a result, the disbondmentoccurs in a broad region when the bond-breakage reactions aresufficiently slow. The distribution <strong>of</strong> porosity <strong>for</strong> k neq =10 −4 s −1 ispresented in Fig. 19 as a function <strong>of</strong> position with elapsed time as aparameter. The well-defined porosity front seen in Fig. 8b becomesless distinguishable in Fig. 19; instead, the change in porosity takesplace in broad region and the region expands with increasing time.The results presented here indicate that the potential fronts provideonly an approximate indicator <strong>of</strong> the location <strong>of</strong> the delaminationfront.<strong>Delamination</strong> kinetics.— The propagation distances determinedby the potential front and the porosity front are given in Fig. 20a andFigure 19. Calculated distributions <strong>of</strong> d/dx along the metal–coating interfacewith elapsed time as a parameter.b, respectively, as functions <strong>of</strong> time with k neq as a parameter. In Fig.20a, when the rate constant k neq changes from infinity to 10 −4 s −1 ,the slopes <strong>of</strong> the lines change slightly from 0.57 to 0.59. The slightchange in the slope demonstrates that the rate constant k neq does nothave a significant impact on the rate-determining step <strong>of</strong> the overalldelamination process. In Fig. 20b, the slope is approximately equalto 0.6 <strong>for</strong> the equilibrium pH–porosity relation but increases to 0.74<strong>for</strong> k neq =10 −4 s −1 . The slope change in Fig. 20b is an indicationthat the delamination mechanism shifts from a mass-transfer controlledto a mixed-control mechanism when the bond-breakage reactionsare sufficiently slow. The transition is consistent with theexperimental result reported by Stratmann et al. 15 that the overalldelamination process is limited by kinetics when the delaminationrate is sufficiently small.Sensitivity analysis <strong>of</strong> parameters.— Because the parameters usedin the –pH, w Zn –pH, and w O2 –pH relations may have significantimpact on the computational results, a systematic sensitivity analysiswas per<strong>for</strong>med. In the analysis, three different values were examined<strong>for</strong> each fitting parameter. The moving front velocities and the kineticanalysis were checked to determine the sensitivity.The sensitivity analysis indicates that the simulations are sensitiveto the parameters used in the porosity–pH relation b ,1 –b ,4 .The sensitivity analysis <strong>for</strong> the fitting parameter b ,1 is summarizedin Table V. When the fitting parameter b ,1 that governs the porosityat high pH in Fig. 21a increases from 0.001 to 0.1, the velocities <strong>of</strong>both potential front and porosity front increase approximately by afactor <strong>of</strong> 2.5. When b ,1 is equal to 0.1, the interfacial potential inthe intact region, unlike the constant feature observed in Fig. 6,increases with delamination time. The slope <strong>of</strong> the potential increasefrom low pH to high pH in Fig. 6 is influenced by the fitting parameterb ,2 . As observed in Fig. 21b, when b ,2 changes from −2 to −5,the slope <strong>of</strong> the transition from low pH to high pH increases slightlyas well.Figure 20. Delaminated distance as a function <strong>of</strong> delamination time in double-logarithmic scale with rate constant k neq as a parameter: a delaminated distancedetermined by the potential front and b delaminated distance determined by the porosity front.
Journal <strong>of</strong> The Electrochemical Society, 155 5 C279-C292 2008C291Table V. Sensitivity analysis <strong>for</strong> b ,1 .b ,1 = 0.001 b ,1 = 0.01 b ,1 = 0.1Potential front velocity 1.00 1.66 2.78Porosity front velocity 1.09 1.50 2.40Reaction order <strong>for</strong> potential front 0.54 0.55 0.56Reaction order <strong>for</strong> porosity front 0.59 0.6 0.6For the values that were examined, the computations were insensitiveto the fitting parameters used in the w Zn –pH relation b wZn ,1–b wZn ,4. The simulation results, however, were sensitive to severalfitting parameters used in the w O2 –pH relation. For instance, theslope <strong>of</strong> the increasing curve at low pH in Fig. 22a becomes steeperwhen the fitting parameter b wO2 ,2 changes from −4 to −10. Theincrease in the slope results in an increase in the velocities <strong>of</strong> bothpotential front and porosity front. The kinetic analysis indicates thatthe change in b wO2 ,2 has no significant impact on the delaminationmechanism. In Fig. 22b the magnitude <strong>of</strong> the constant value in themiddle range <strong>of</strong> pH increases from 10 −4 to 10 −2 when b wO2 ,7 changesfrom −11.1 to −9.1. The increase in the blocking factor leads to anincrease in the delamination rates. The kinetic analysis <strong>for</strong> −11.1and −10.1 shows a mass-transfer-limited delamination mechanism,but a mixed-controlled mechanism is shown <strong>for</strong> the porosity frontwhen b wO2 ,7 is equal to −9.1.ConclusionsA 1-D transient mathematical model was developed that simulatesthe delamination <strong>of</strong> polymeric coating from a zinc surface inthe presence <strong>of</strong> homogeneous and precipitation reactions. The simulationresults obtained using the equilibrium –pH relationship demonstratethat the overall delamination process is governed primarilyby the transport <strong>of</strong> the cations from the defect to the front region.The rate <strong>of</strong> the delamination depends on the mobility and the concentration<strong>of</strong> the cations. The consistency with the experimental observationsby Stratmann et al. 13-15,10-12 supports the hypotheses proposedby Allahar 17,18 that the porosity and polarization kinetics canbe treated as functions <strong>of</strong> pH.The computational results obtained using a nonequilibrium –pHrelationship indicate that, when the bond-breaking reactions takeplace at a sufficiently slow rate, the potential front and the porosityfront become distinguishable. The movement <strong>of</strong> the potential frontfollows the change <strong>of</strong> pH along the metal–coating interface, whereasthe movement <strong>of</strong> the porosity front is limited by the bond-breakingreactions. The kinetic analysis <strong>of</strong> the nonequilibrium results alsoshows that the delamination mechanism shifts from a masscontrolledmechanism to a mixed-control mechanism when thebond-breaking reactions are sufficiently slow. The dependence <strong>of</strong>delamination rate on hydroxide ions is supported by the observations<strong>of</strong> Ogle et al. 4-6 The <strong>for</strong>malism, however, is general and can beapplied to other proposed mechanisms involving, <strong>for</strong> example, hydroxylradicals.Figure 21. a The sensitivity analysis <strong>for</strong> b ,2 and b resulting potential distributions using different values <strong>of</strong> b ,2 .Figure 22. a The sensitivity analysis <strong>for</strong> b wO2 ,2 and b b wO2 ,7.
C292Journal <strong>of</strong> The Electrochemical Society, 155 5 C279-C292 2008The sensitivity analysis <strong>for</strong> the fitting parameters used in –pH,w Zn –pH, and w O2 –pH relations demonstrates that the resulting distributionsand the velocity <strong>of</strong> the fronts are primarily controlled bythe parameters used in the porosity–pH relation. The simulationsare, in general, insensitive to the parameters used in the w Zn –pHrelation. The values <strong>of</strong> the fitting parameters b wO2 ,2 and b wO2 ,7 employedin the w O2 –pH relations influence the delamination rate anddelamination kinetics, respectively.AcknowledgmentsThe authors are grateful <strong>for</strong> the financial support <strong>of</strong> this work byArcelorMittal Research, Maizières-les-Metz, France.References1. G. Grundmeyer and A. Simöes, in Encylopedia <strong>of</strong> Electrochemistry, A. J. Bard, M.Stratmann, and J. Frankel, Editors, Vol. 5, pp. 500–566, Wiley-VCH, New York2003.2. A. Amirudin and D. Thierry, Prog. Org. Coat., 28, 591996.3. K. Ogle and A. Simöes, in Encyclopedia <strong>of</strong> Electrochemistry, A. J. Bard, M. Stratmann,and J. Frankel, Editors, Vol. 4, pp. 460–499, Wiley-VCH, New York 2003.4. K. Ogle, S. Morel, and N. Meddahi, Corros. Sci., 47, 2034 2004.5. K. Ogle, A. Tomandl, N. Meddahi, and M. Wolpers, Corros. Sci., 46, 979 2004.6. A. Tomandl, M. Wolpers, and K. Ogle, Corros. Sci., 46, 997 2004.7. M. Stratmann, R. Feser, and A. Leng, Electrochim. Acta, 39, 1207 1994.8. M. Stratmann, A. Leng, W. Furbeth, H. Streckel, H. Gehmecker, and K.-H. Grobe-Brinkhaus, Prog. Org. Coat., 27, 261 1996.9. G. Grundmeier, C. Reinartz, M. Rohwerder, and M. Stratmann, Electrochim. Acta,43, 165 1998.10. A. Leng, H. Strekel, and M. Stratmann, Corros. Sci., 41, 547 1999.11. A. Leng, H. Streckel, and M. Stratmann, Corros. Sci., 41, 579 1999.12. A. Leng, H. Streckel, K. H<strong>of</strong>mann, and M. Stratmann, Corros. Sci., 41, 5991999.13. W. Furbeth and M. Stratmann, Corros. Sci., 43, 207 2001.14. W. Furbeth and M. Stratmann, Corros. Sci., 43, 229 2001.15. W. Furbeth and M. Stratmann, Corros. Sci., 43, 243 2001.16. G. Grundmeier, W. Schmidt, and M. Stratmann, Electrochim. Acta, 45, 25152000.17. K. N. Allahar, Ph.D. Dissertation, University <strong>of</strong> Florida, Gainesville, Florida2003.18. K. Allahar, M. Orazem, and K. Ogle, Corros. Sci., 49, 3638 2007.19. J. S. Newman, Electrochemical Systems, 2nd ed., Prentice-Hall, Englewood Cliffs,New Jersey 1991.20. A. C. West, J. Electrochem. Soc., 140, 403 1993.21. G. Grundmeier and M. Stratmann, Mater. Corros., 49, 150 1998.22. D. A. Jones, Principles and Prevention <strong>of</strong> Corrosion, Prentice Hall, Upper SaddleRiver, NJ 1996.23. M. G. Fontana, Corrosion Engineering, McGraw-Hill, New York 1986.24. M. Pourbaix, Atlas <strong>of</strong> Electrochemical Equilibria in Aqueous Solutions, NACEInternational, Houston, Texas 1974.25. G. Zhang, Corrosion and Electrochemistry <strong>of</strong> Zinc, Plenum Press, New York1996.26. D. H. J. Newman and K. Vetter, Electrochim. Acta, 22, 829 1977.27. M. Watson and J. Postlethwaite, Corrosion (Houston), 46, 522 1990.28. D. R. Lide, Handbook <strong>of</strong> Chemistry and Physics, 84th ed., CRC Press, Cleveland,Ohio 2003–2004.29. K. E. Atkinson, An Introduction to Numerical Analysis, 2nd ed., John Wiley andSons, New York 1989.30. W. H. Press, S. A. Teukolsky, W. T. Vetterling, and B. P. Flannery, NumericalRecipes in Fortran 77, 2nd ed., Press Syndicate <strong>of</strong> the University <strong>of</strong> Cambridge,Cambridge, UK 1992.31. G. Williams and H. N. McMurray, J. Electrochem. Soc., 148, B377 2001.32. E. Tada, K. Sugawara, and H. Kaneko, Electrochim. Acta, 49, 1019 2004.33. G. Williams, H. N. McMurray, and D. A. Worsley, J. Electrochem. Soc., 149,B154 2002.