

MICROBANKING BULLETIN - Microfinance Information Exchange
MICROBANKING BULLETIN - Microfinance Information Exchange
MICROBANKING BULLETIN - Microfinance Information Exchange

Create successful ePaper yourself
Turn your PDF publications into a flip-book with our unique Google optimized e-Paper software.
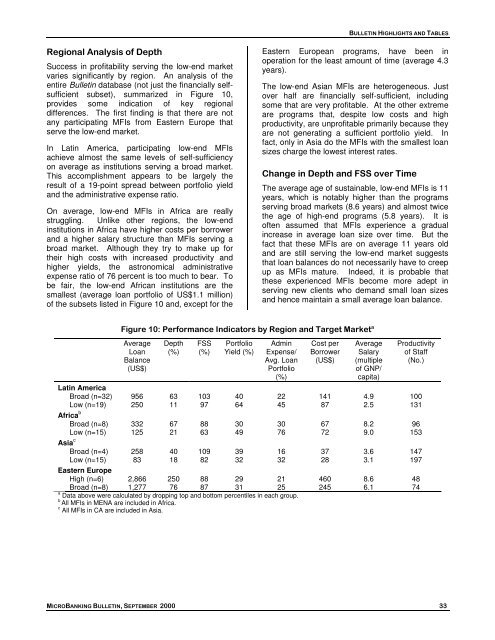
<strong>BULLETIN</strong> HIGHLIGHTS AND TABLESRegional Analysis of DepthSuccess in profitability serving the low-end marketvaries significantly by region. An analysis of theentire Bulletin database (not just the financially selfsufficientsubset), summarized in Figure 10,provides some indication of key regionaldifferences. The first finding is that there are notany participating MFIs from Eastern Europe thatserve the low-end market.In Latin America, participating low-end MFIsachieve almost the same levels of self-sufficiencyon average as institutions serving a broad market.This accomplishment appears to be largely theresult of a 19-point spread between portfolio yieldand the administrative expense ratio.On average, low-end MFIs in Africa are reallystruggling. Unlike other regions, the low-endinstitutions in Africa have higher costs per borrowerand a higher salary structure than MFIs serving abroad market. Although they try to make up fortheir high costs with increased productivity andhigher yields, the astronomical administrativeexpense ratio of 76 percent is too much to bear. Tobe fair, the low-end African institutions are thesmallest (average loan portfolio of US$1.1 million)of the subsets listed in Figure 10 and, except for theEastern European programs, have been inoperation for the least amount of time (average 4.3years).The low-end Asian MFIs are heterogeneous. Justover half are financially self-sufficient, includingsome that are very profitable. At the other extremeare programs that, despite low costs and highproductivity, are unprofitable primarily because theyare not generating a sufficient portfolio yield. Infact, only in Asia do the MFIs with the smallest loansizes charge the lowest interest rates.Change in Depth and FSS over TimeThe average age of sustainable, low-end MFIs is 11years, which is notably higher than the programsserving broad markets (8.6 years) and almost twicethe age of high-end programs (5.8 years). It isoften assumed that MFIs experience a gradualincrease in average loan size over time. But thefact that these MFIs are on average 11 years oldand are still serving the low-end market suggeststhat loan balances do not necessarily have to creepup as MFIs mature. Indeed, it is probable thatthese experienced MFIs become more adept inserving new clients who demand small loan sizesand hence maintain a small average loan balance.Figure 10: Performance Indicators by Region and Target Market aAverageLoanBalance(US$)Depth(%)FSS(%)PortfolioYield (%)AdminExpense/Avg. LoanPortfolio(%)Cost perBorrower(US$)AverageSalary(multipleof GNP/capita)Productivityof Staff(No.)Latin AmericaBroad (n=32) 956 63 103 40 22 141 4.9 100Low (n=19) 250 11 97 64 45 87 2.5 131Africa bBroad (n=8) 332 67 88 30 30 67 8.2 96Low (n=15) 125 21 63 49 76 72 9.0 153Asia cBroad (n=4) 258 40 109 39 16 37 3.6 147Low (n=15) 83 18 82 32 32 28 3.1 197Eastern EuropeHigh (n=6) 2,866 250 88 29 21 460 8.6 48Broad (n=8) 1,277 76 87 31 25 245 6.1 74a Data above were calculated by dropping top and bottom percentiles in each group.bAll MFIs in MENA are included in Africa.c All MFIs in CA are included in Asia.<strong>MICROBANKING</strong> <strong>BULLETIN</strong>, SEPTEMBER 2000 33


