MONTHLY FEATURE - Elliott Wave International
MONTHLY FEATURE - Elliott Wave International
MONTHLY FEATURE - Elliott Wave International

You also want an ePaper? Increase the reach of your titles
YUMPU automatically turns print PDFs into web optimized ePapers that Google loves.
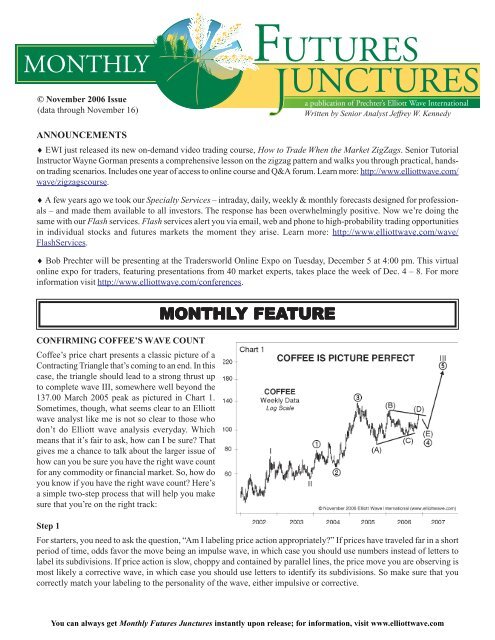
Futures Junctures -- November 17, 2006the March 2005 peak in Coffee. Armed with thislist, we will see if price action does indeed warrantthis labeling.Let’s begin by acknowledging that Coffee priceshave been traveling sideways for a long time sinceearly 2005, yielding lower highs and higher lows.This pattern is a trademark of a Contracting Triangle,suggesting that it’s the most likely <strong>Elliott</strong>wave pattern to fit Coffee’s price action.Moreover, four of the five waves that make up aContracting Triangle are already in place, and thesefour waves subdivide into Zigzags (Chart 2), whichis one of the rules for labeling Contracting Triangles.Also, wave C never moves beyond the end of waveA, wave D never moves beyond the end of wave B,and wave E – well, it has yet to unfold. And becausewave C never moves beyond the end of waveA and wave D never moves beyond the end of waveB, the trendlines connecting these extremes converge– another key characteristic of ContractingTriangles.So it looks like Coffee’s price action has met mostof the rules for Contracting Triangles so far. Thatmeans that, at this stage of the game, it is indeedmost appropriate to label price action in Coffee sincethe March 2005 peak as a Contracting Triangle.Moreover, the number of Fibonacci relationshipspresent strengthen this conclusion (see Chart 3 andthe sidebar for Fibonacci relationships).Where To From Here?Now that I have made my case that Coffee has beentracing out a Contracting Triangle, what can we expectfrom here? Since we have only four of the necessaryfive waves so far, I expect a selloff from nearcurrent levels into 110.00-105.00 (basis the Decembercontract) to complete wave (E).3
Futures Junctures -- November 17, 2006Here’s some additional evidence in favor ofthis idea:•On the basis of the weekly chart, wave(D) has traveled to just above the pointat which wave (D) will equal a .618multiple of wave (B).•Also, as you can see in Chart 4, waveC of (D) equals the length of wave A of(D) at 116.90. This relationship is significantbecause equality betweenwaves C and A is the most common relationshipfound within Zigzags.Once wave (E) unfolds, I expect a long-termtradable low to form, from which prices willthrust up into the area of 200.00-220.00,preferably higher. Why? Because the moveup I am expecting is a fifth wave (wave 5)following a fourth-wave Contracting Triangle.If you will notice from the guidelines section in the sidebar, when wave five follows a Contracting Triangle, it istypically either a brief, rapid movement or an exceptionally long extension. I lean toward the long extension for Coffee,because fifth waves in commodities tend to extend.Odds favor a rally beyond the 200.00-220.00 range, too, because the period between October and May is usually a periodof seasonal strength in Coffee. I also think that the divergence between Coffee prices (basis the weekly chart) and theGenesis Sentiment Index (Chart 5) that has unfolded in recent months is another exciting development that favors asizable rally in Coffee in the coming months. What exactly is divergence? Divergence is simply a condition in whichprice and an indicator move in opposite directions. At times, this condition can warn of either impending weakness orstrength. Given the <strong>Elliott</strong> wave pattern, I believe this divergence indicates impending strength for Coffee, while allowingfor a selloff in prices in thewave (E) of 4.Notice that the last time wewitnessed a similar conditionin Coffee back in 2004,prices skyrocketed, morethan doubling from near65.00 to 137.00. If thesame thing happens again,Coffee will easily reach200.00 or better in theweeks and months ahead.4
Futures Junctures -- November 17, 2006WAVEVE WATCH5
Futures Junctures -- November 17, 20066
Futures Junctures -- November 17, 20067
Futures Junctures -- November 17, 20068
Futures Junctures -- November 17, 20069
Futures Junctures -- November 17, 200610
Futures Junctures -- November 17, 2006HOW TO USE THE THRUST MEASUREMENTIn this month’s feature story about Coffee, Iexplain the rules, Fibonacci relationships andguidelines that apply when a Contracting Triangleis forming. In this Trader’s Classroom,I’d like to describe what happens when a ContractingTriangle ends. Are there any rules orguidelines that apply to price action followinga Contracting Triangle? The answer to thisquestion is a resounding “Yes.”When a Contracting Triangle ends, the resultantmove is often swift. <strong>Elliott</strong>icians call it aThrust, and they use an old trick to plot itspossible length, called – are you ready? – aThrust Measurement. This technique simplymeasures the widest part of the Triangle andtranslates it into the length of the thrust upwardor downward from the extreme of waveE of the pattern.Let’s take a look at Google’s chart, and I’llshow you what I mean. In Chart 1, it’s easy tosee that prices recently traced out a ContractingTriangle that ended at $363.36 in August.1. Now the first step in calculating theThrust Measurement of this triangle is toextend the trendlines that connect the bottomsof waves A and C and the tops ofwaves B and D as illustrated in Chart 2.2. Next, go back to the origin of wave Ain January at $475.11 and measure thedistance between the trendlines we justextended. Then take this length of thewidest part of the Triangle and extend itupward from the extreme of wave E at$363.36.TRADER’S CLASSROOM11
Futures Junctures -- November 17, 2006As you can see in Chart 3, the Thrust Measurement for this Contracting Triangle in Google projects a target price ofapproximately $535.00. That’s it – it is indeed that simple to perform a Thrust Measurement on your own.The only thing I can add is that the Thrust Measurement is just a ballpark figure. It is not an absolute by any means. Pricescan easily fall short of the Thrust Measurement objective or surpass it greatly. Even so, I have determined over manyyears that this tool is indeed worthwhile, because, more often than not, prices attain the price target it maps out.FUTURES JUNCTURES is a product published by <strong>Elliott</strong> <strong>Wave</strong> <strong>International</strong>, Inc. Mailing address: P.O. Box1618, Gainesville, Georgia 30503, U.S.A. Phone: 770-536-0309. All contents copyright © 2006 <strong>Elliott</strong> <strong>Wave</strong><strong>International</strong>. All rights reserved. Reproduction, retransmission or redistribution in any form is illegal andstrictly prohibited, as is continuous and regular dissemination of specific forecasts, prices and targets. Otherwise,feel free to quote, cite or review if full credit is given. The editor of this publication requests a copy of such use.SUBSCRIPTION RATES: $19 per month (add $1.50 per month for overseas airmail). Make checks payable to “<strong>Elliott</strong> <strong>Wave</strong> <strong>International</strong>.” Visa, MasterCard,Discover and American Express are accepted. Telephone 770-536-0309 or send credit card number and expiration date with your order. IMPORTANT: please payonly in $USD drawn on a US bank. If drawn on a foreign bank, please add $30 USD extra to cover collection costs. Georgia residents add sales tax.We offer monthly and 3-times-a-week commentary on U.S. stocks, bonds, metals and the dollar in The Financial Forecast Service; daily and monthly commentaryon futures in Futures Junctures Service; and monthly commentary on all the world’s major markets in Global Market Perspective. Rates vary by market andfrequency. For information, call us at 770-536-0309 or (within the U.S.) 800-336-1618. Or better yet, visit our website for special deals at www.elliottwave.com.The <strong>Elliott</strong> <strong>Wave</strong> Principle is a detailed description of how markets behave. The description reveals that mass investor psychology swings from pessimism tooptimism and back in a natural sequence, creating specific patterns in price movement. Each pattern has implications regarding the position of the marketwithin its overall progression, past, present and future. The purpose of this publication and its associated service is to outline the progress of markets in termsof the <strong>Elliott</strong> <strong>Wave</strong> Principle and to educate interested parties in the successful application of the <strong>Elliott</strong> <strong>Wave</strong> Principle. While a reasonable course of conductregarding investments may be formulated from such application, at no time will specific recommendations or customized actionable advice be given, and at notime may a reader or caller be justified in inferring that any such advice is intended. Readers must be advised that while the information herein is expressed ingood faith, it is not guaranteed. Be advised that the market service that never makes mistakes does not exist. Long-term success in the market demandsrecognition of the fact that error and uncertainty are part of any effort to assess future probabilities.12