Respiration Monitor Belt - Vernier Software & Technology
Respiration Monitor Belt - Vernier Software & Technology
Respiration Monitor Belt - Vernier Software & Technology

You also want an ePaper? Increase the reach of your titles
YUMPU automatically turns print PDFs into web optimized ePapers that Google loves.
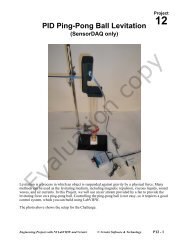
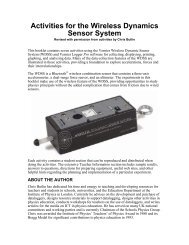
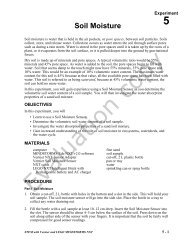
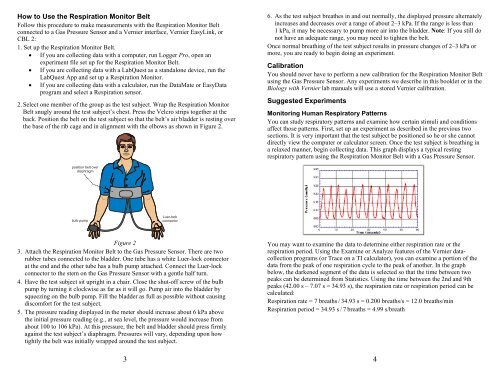
How to Use the <strong>Respiration</strong> <strong>Monitor</strong> <strong>Belt</strong>Follow this procedure to make measurements with the <strong>Respiration</strong> <strong>Monitor</strong> <strong>Belt</strong>connected to a Gas Pressure Sensor and a <strong>Vernier</strong> interface, <strong>Vernier</strong> EasyLink, orCBL 2:1. Set up the <strong>Respiration</strong> <strong>Monitor</strong> <strong>Belt</strong>.• If you are collecting data with a computer, run Logger Pro, open anexperiment file set up for the <strong>Respiration</strong> <strong>Monitor</strong> <strong>Belt</strong>.• If you are collecting data with a LabQuest as a standalone device, run theLabQuest App and set up a <strong>Respiration</strong> <strong>Monitor</strong>.• If you are collecting data with a calculator, run the DataMate or EasyDataprogram and select a <strong>Respiration</strong> sensor.2. Select one member of the group as the test subject. Wrap the <strong>Respiration</strong> <strong>Monitor</strong><strong>Belt</strong> snugly around the test subject’s chest. Press the Velcro strips together at theback. Position the belt on the test subject so that the belt’s air bladder is resting overthe base of the rib cage and in alignment with the elbows as shown in Figure 2.6. As the test subject breathes in and out normally, the displayed pressure alternatelyincreases and decreases over a range of about 2–3 kPa. If the range is less than1 kPa, it may be necessary to pump more air into the bladder. Note: If you still donot have an adequate range, you may need to tighten the belt.Once normal breathing of the test subject results in pressure changes of 2–3 kPa ormore, you are ready to begin doing an experiment.CalibrationYou should never have to perform a new calibration for the <strong>Respiration</strong> <strong>Monitor</strong> <strong>Belt</strong>using the Gas Pressure Sensor. Any experiments we describe in this booklet or in theBiology with <strong>Vernier</strong> lab manuals will use a stored <strong>Vernier</strong> calibration.Suggested Experiments<strong>Monitor</strong>ing Human Respiratory PatternsYou can study respiratory patterns and examine how certain stimuli and conditionsaffect those patterns. First, set up an experiment as described in the previous twosections. It is very important that the test subject be positioned so he or she cannotdirectly view the computer or calculator screen. Once the test subject is breathing ina relaxed manner, begin collecting data. This graph displays a typical restingrespiratory pattern using the <strong>Respiration</strong> <strong>Monitor</strong> <strong>Belt</strong> with a Gas Pressure Sensor.position belt overdiaphragmbulb pumpLuer-lockconnectorFigure 23. Attach the <strong>Respiration</strong> <strong>Monitor</strong> <strong>Belt</strong> to the Gas Pressure Sensor. There are tworubber tubes connected to the bladder. One tube has a white Luer-lock connectorat the end and the other tube has a bulb pump attached. Connect the Luer-lockconnector to the stem on the Gas Pressure Sensor with a gentle half turn.4. Have the test subject sit upright in a chair. Close the shut-off screw of the bulbpump by turning it clockwise as far as it will go. Pump air into the bladder bysqueezing on the bulb pump. Fill the bladder as full as possible without causingdiscomfort for the test subject.5. The pressure reading displayed in the meter should increase about 6 kPa abovethe initial pressure reading (e.g., at sea level, the pressure would increase fromabout 100 to 106 kPa). At this pressure, the belt and bladder should press firmlyagainst the test subject’s diaphragm. Pressures will vary, depending upon howtightly the belt was initially wrapped around the test subject.3You may want to examine the data to determine either respiration rate or therespiration period. Using the Examine or Analyze features of the <strong>Vernier</strong> datacollectionprograms (or Trace on a TI calculator), you can examine a portion of thedata from the peak of one respiration cycle to the peak of another. In the graphbelow, the darkened segment of the data is selected so that the time between twopeaks can be determined from Statistics. Using the time between the 2nd and 9thpeaks (42.00 s – 7.07 s = 34.93 s), the respiration rate or respiration period can becalculated:<strong>Respiration</strong> rate = 7 breaths / 34.93 s = 0.200 breaths/s = 12.0 breaths/min<strong>Respiration</strong> period = 34.93 s / 7 breaths = 4.99 s/breath4