Respiration Monitor Belt - Vernier Software & Technology
Respiration Monitor Belt - Vernier Software & Technology
Respiration Monitor Belt - Vernier Software & Technology

You also want an ePaper? Increase the reach of your titles
YUMPU automatically turns print PDFs into web optimized ePapers that Google loves.
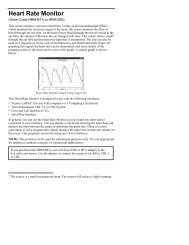
<strong>Respiration</strong> <strong>Monitor</strong> <strong>Belt</strong>(Order Code RMB)The <strong>Respiration</strong> <strong>Monitor</strong> <strong>Belt</strong> is used to measure human respiration rates. It must beattached to the <strong>Vernier</strong> Gas Pressure Sensor (see Figure 1), which is then connectedto any of the <strong>Vernier</strong> interfaces (<strong>Vernier</strong> LabPro ® , LabQuest ® , LabQuest ® MiniGo! ® Link, SensorDAQ), CBL 2, or <strong>Vernier</strong> EasyLink ® . The following are someof the activities and experiments that can be performed using the <strong>Respiration</strong><strong>Monitor</strong> <strong>Belt</strong>:• Study the resting respiration pattern of students.• Investigate respiration patterns that have been interrupted by simple activitiessuch as holding of breath or drinking a beverage.• Compare respiration rates of athletes and non-athletes.• Compare respiration rates of females and males.• <strong>Monitor</strong> respiration rates, including recovery time, before and after vigorousexercise.• <strong>Monitor</strong> respiration rates before and after drinking of caffeinated beverages.• Measure the effect of increased levels of carbon dioxide gas on respiration rate.• Compare respiration rate and heart rate (using a <strong>Vernier</strong> Heart Rate <strong>Monitor</strong>).Students can compare the effect of exercise, body types, food or drinkconsumption, or carbon dioxide levels on these two rates.Figure 1Keep in mind that used alone, the Gas Pressure Sensor has many other uses inbiology experiments. Activities for the Gas Pressure Sensor are summarized in thesensor booklet that is included with each sensor. Some of these activities include:• <strong>Monitor</strong> the production of O 2 during photosynthesis of an aquatic plant in aclosed system.• Determine the rate of transpiration for a plant under different conditions.• Determine the rate of respiration in germinating pea or bean seeds.• Study the effect of temperature and concentration on the rate ofdecomposition of H 2 O 2 .• Determine the effect of temperature on cold-blooded organisms bymonitoring their respiration.• <strong>Monitor</strong> barometric pressure associated with weather phenomena.NOTE: This product is to be used for educational purposes only. It is not appropriatefor industrial, medical, research, or commercial applications. Specifically, it may notbe used for patient diagnosis.Collecting Data with the <strong>Respiration</strong> <strong>Monitor</strong> <strong>Belt</strong>This sensor can be used with the following interfaces to collect data:• <strong>Vernier</strong> LabQuest as a standalone device or with a computer• <strong>Vernier</strong> LabQuest Mini with a computer• <strong>Vernier</strong> LabPro with a computer, TI graphing calculator, or Palm ® handheld• <strong>Vernier</strong> Go!Link• <strong>Vernier</strong> EasyLink• <strong>Vernier</strong> SensorDAQ• CBL 2Data-Collection <strong>Software</strong>This sensor can be used with an interface and the following data-collection software.• Logger Pro 3 This computer program is used with LabQuest, LabQuest Mini,LabPro, or Go!Link.• Logger Pro 2 This computer program is used with ULI or Serial Box Interface.• Logger Lite This computer program is used with LabQuest, LabQuest Mini,LabPro, or Go!Link.• LabQuest App This program is used when LabQuest is used as a standalonedevice.• EasyData App This calculator application for the TI-83 Plus and TI-84 Plus canbe used with CBL 2, LabPro, and <strong>Vernier</strong> EasyLink. We recommend version2.0 or newer, which can be downloaded from the <strong>Vernier</strong> web site,www.vernier.com/easy/easydata.html, and then transferred to the calculator.See the <strong>Vernier</strong> web site, www.vernier.com/calc/software/index.html for moreinformation on the App and Program Transfer Guidebook.• DataMate program Use DataMate with LabPro or CBL 2 and TI-73, TI-83,TI-84, TI-86, TI-89, and Voyage 200 calculators. See the LabPro and CBL 2Guidebooks for instructions on transferring DataMate to the calculator.• Data Pro This program is used with LabPro and a Palm handheld.• LabVIEW National Instruments LabVIEW software is a graphicalprogramming language sold by National Instruments. It is used withSensorDAQ and can be used with a number of other <strong>Vernier</strong> interfaces. Seewww.vernier.com/labview for more information.2
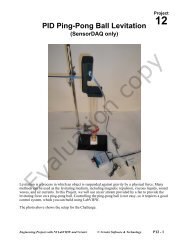
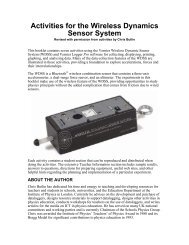
How to Use the <strong>Respiration</strong> <strong>Monitor</strong> <strong>Belt</strong>Follow this procedure to make measurements with the <strong>Respiration</strong> <strong>Monitor</strong> <strong>Belt</strong>connected to a Gas Pressure Sensor and a <strong>Vernier</strong> interface, <strong>Vernier</strong> EasyLink, orCBL 2:1. Set up the <strong>Respiration</strong> <strong>Monitor</strong> <strong>Belt</strong>.• If you are collecting data with a computer, run Logger Pro, open anexperiment file set up for the <strong>Respiration</strong> <strong>Monitor</strong> <strong>Belt</strong>.• If you are collecting data with a LabQuest as a standalone device, run theLabQuest App and set up a <strong>Respiration</strong> <strong>Monitor</strong>.• If you are collecting data with a calculator, run the DataMate or EasyDataprogram and select a <strong>Respiration</strong> sensor.2. Select one member of the group as the test subject. Wrap the <strong>Respiration</strong> <strong>Monitor</strong><strong>Belt</strong> snugly around the test subject’s chest. Press the Velcro strips together at theback. Position the belt on the test subject so that the belt’s air bladder is resting overthe base of the rib cage and in alignment with the elbows as shown in Figure 2.6. As the test subject breathes in and out normally, the displayed pressure alternatelyincreases and decreases over a range of about 2–3 kPa. If the range is less than1 kPa, it may be necessary to pump more air into the bladder. Note: If you still donot have an adequate range, you may need to tighten the belt.Once normal breathing of the test subject results in pressure changes of 2–3 kPa ormore, you are ready to begin doing an experiment.CalibrationYou should never have to perform a new calibration for the <strong>Respiration</strong> <strong>Monitor</strong> <strong>Belt</strong>using the Gas Pressure Sensor. Any experiments we describe in this booklet or in theBiology with <strong>Vernier</strong> lab manuals will use a stored <strong>Vernier</strong> calibration.Suggested Experiments<strong>Monitor</strong>ing Human Respiratory PatternsYou can study respiratory patterns and examine how certain stimuli and conditionsaffect those patterns. First, set up an experiment as described in the previous twosections. It is very important that the test subject be positioned so he or she cannotdirectly view the computer or calculator screen. Once the test subject is breathing ina relaxed manner, begin collecting data. This graph displays a typical restingrespiratory pattern using the <strong>Respiration</strong> <strong>Monitor</strong> <strong>Belt</strong> with a Gas Pressure Sensor.position belt overdiaphragmbulb pumpLuer-lockconnectorFigure 23. Attach the <strong>Respiration</strong> <strong>Monitor</strong> <strong>Belt</strong> to the Gas Pressure Sensor. There are tworubber tubes connected to the bladder. One tube has a white Luer-lock connectorat the end and the other tube has a bulb pump attached. Connect the Luer-lockconnector to the stem on the Gas Pressure Sensor with a gentle half turn.4. Have the test subject sit upright in a chair. Close the shut-off screw of the bulbpump by turning it clockwise as far as it will go. Pump air into the bladder bysqueezing on the bulb pump. Fill the bladder as full as possible without causingdiscomfort for the test subject.5. The pressure reading displayed in the meter should increase about 6 kPa abovethe initial pressure reading (e.g., at sea level, the pressure would increase fromabout 100 to 106 kPa). At this pressure, the belt and bladder should press firmlyagainst the test subject’s diaphragm. Pressures will vary, depending upon howtightly the belt was initially wrapped around the test subject.3You may want to examine the data to determine either respiration rate or therespiration period. Using the Examine or Analyze features of the <strong>Vernier</strong> datacollectionprograms (or Trace on a TI calculator), you can examine a portion of thedata from the peak of one respiration cycle to the peak of another. In the graphbelow, the darkened segment of the data is selected so that the time between twopeaks can be determined from Statistics. Using the time between the 2nd and 9thpeaks (42.00 s – 7.07 s = 34.93 s), the respiration rate or respiration period can becalculated:<strong>Respiration</strong> rate = 7 breaths / 34.93 s = 0.200 breaths/s = 12.0 breaths/min<strong>Respiration</strong> period = 34.93 s / 7 breaths = 4.99 s/breath4
Recovery of <strong>Respiration</strong> Rate after Vigorous ExerciseTo investigate the effect of vigorous exercise on respiration rate, have the testsubject jog in place for 2 minutes. Afterward, collect respiration data for 3 minutes,and analyze the data to see how the respiration rate changes. In the sample datashown in the graph below (after exercise), the following respiration rates wereobtained at the beginning and end of data collection:5 breaths (after exercising): 5 breaths / 12.48 s = 0.401 breaths/s = 24.0breaths/min5 breaths (after recovery): 5 breaths / 24.95 s = 0.200 breaths/s = 12.0 breaths/min<strong>Respiration</strong> Interrupted by Holding of BreathIn this exercise, the test subject is instructed to breathe in a relaxed manner, hold hisor her breath after about 20 seconds, then resume breathing after about one minute(40 additional seconds). Data collected in this manner is shown here:Now determine the respiration period (or respiration rate), as described in theprevious section. Select data in the regions prior to and following the holding ofbreath, as shown in the following graphs. Then calculate the respiration period foreach:Before holding of breath: 10.60 s / 2 breaths = 5.30 s/breathAfter holding of breath: 27.44 s / 9 breaths = 3.05 s/breathComparing <strong>Respiration</strong> Rate and Heart Rate after JoggingIt is interesting to compare respiration rates with heart rates (measured with the<strong>Vernier</strong> Heart Rate <strong>Monitor</strong>). The following data were collected with a <strong>Respiration</strong><strong>Monitor</strong> <strong>Belt</strong> and Gas Pressure Sensor connected to Port 1 of a Serial Box Interfaceand a Heart Rate <strong>Monitor</strong> connected to Port 2. The data-collection rate is set at50 readings/s. The data shown here were collected after the test subject jogged inplace for two minutes.Students can easily observe the decrease in respiration period (or increase inrespiration rate) due to holding breath. Students can also investigate the recovery ofrespiration rate—the respiration period increased from 2.50 to 3.76 s/breath between60 and 90 seconds in the data shown here.Because the heart-rate readings occur at a much higher rate than respiration rate, wehave zoomed in to examine the data between 18 and 24 seconds (left-hand graphsbelow) and between 110 and 116 seconds (right-hand graphs).56
By comparing the respiration rate and heart rate at these two times, recovery rate canbe investigated:<strong>Respiration</strong> rate after exercise: 0.334 breaths/s = 20.0 breaths/minHeart rate after exercise: 1.83 beats/s = 110 beats/min<strong>Respiration</strong> rate after recovery: 0.236 breaths/s = 14.2 breaths/minHeart rate after recovery: 1.33 beats/s = 79.8 beats/minAs can be seen from the calculations, both reparation rate and heart rate made asignificant recovery in the two-minute time period over which data were collected—respiration rate improved from 20.0 to 14.2 breaths/min, or by 29.0%, and heart ratefrom 110 to 79.8 beats/min, or by 27.Warranty<strong>Vernier</strong> warrants this product to be free from defects in materials and workmanshipfor a period of five years from the date of shipment to the customer. This warrantydoes not cover damage to the product caused by abuse or improper use.<strong>Vernier</strong> <strong>Software</strong> & <strong>Technology</strong>13979 S.W. Millikan Way • Beaverton, OR 97005-2886Toll Free (888) 837-6437 • (503) 277-2299 • FAX (503) 277-2440info@vernier.com • www.vernier.comRev.2/17/10Logger Pro, Logger Lite, <strong>Vernier</strong> LabPro, <strong>Vernier</strong> LabQuest, <strong>Vernier</strong> LabQuest Mini, Go! Link, <strong>Vernier</strong> EasyLink andother marks shown are our registered trademarks in the United States.CBL 2, TI-GRAPH LINK, and TI Connect are trademarks of Texas Instruments.All other marks not owned by us that appear herein are the property of their respective owners, who may or may not beaffiliated with, connected to, or sponsored by us.Printed on recycled paper.78