1.4 Electrical Properties of BaTiO3 Co-Doped with Rare Earth and Mn
1.4 Electrical Properties of BaTiO3 Co-Doped with Rare Earth and Mn
1.4 Electrical Properties of BaTiO3 Co-Doped with Rare Earth and Mn

Create successful ePaper yourself
Turn your PDF publications into a flip-book with our unique Google optimized e-Paper software.
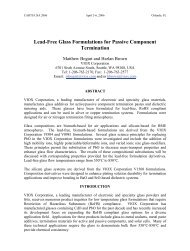
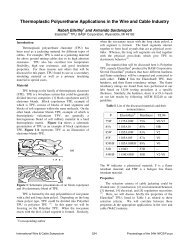
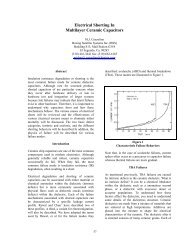
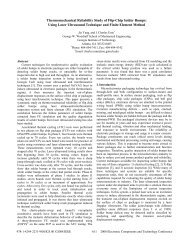
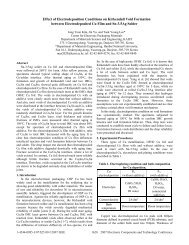
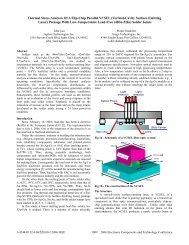
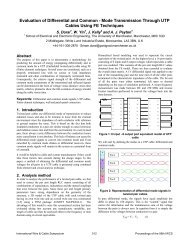
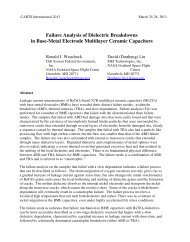
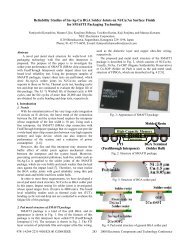
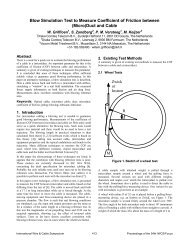
LOG CONDUCTIVITY (Ω -1 cm -1 )10-1-21200 o CUn-doped BaTiO 3(Ba 0.99 Y 0.01 )(Ti 0.995 <strong>Mn</strong> 0.005 )O 3Ba(Ti 0.985 Y 0.01 <strong>Mn</strong> 0.005 )O 3-yBa(Ti 0.995 <strong>Mn</strong> 0.005 )O 3-y-3-16 -12 -8 -4 0LOG PARTIAL PRESSURE, Po 2(atm)Fig. 5. Equilibrium electrical conductivity <strong>of</strong> Y <strong>and</strong><strong>Mn</strong> doped BaTiO 3 1200 o Cdue to the electro-migration <strong>of</strong> oxygen vacancies.The increase in oxygen vacancy concentrationwould give rise to the increase in leakage currents,leading to the degradation <strong>of</strong> insulating resistance.LOG LEAKAGE CURRENT (A)20-2-4-6-8Un-doped BaTiO 3Ba(Ti 0.99 Y 0.01 )O 2.995Ba(Ti 0.985 Y 0.01 <strong>Mn</strong> 0.005 )O 3-y(Ba 0.99 Y 0.01 )(Ti 0.995 <strong>Mn</strong> 0.005 )O 3+yX150 o C,10600V/cmreduced manganese ions, forming a neutral defect••complex ( M n Ti′′ −V). This defect complex couldOprevent oxygen vacancies from migrating towardsthe cathode, resulting in low leakage currents <strong>of</strong><strong>Mn</strong> doped <strong>BaTiO3</strong> regardless <strong>of</strong> the Y replacement<strong>of</strong> either Ba sites or Ti sites [22-23].The thermally stimulated depolarization current(TSDC) <strong>of</strong> Ba(Ti 1-x Y x )O 3-0.5x is shown in Fig. 7.The TSDC <strong>of</strong> specimens increases drastically at thetemperature range above 50 o C <strong>and</strong> reachesmaximum points, <strong>and</strong> then gradually decreases.The height <strong>of</strong> TSDC peak increases <strong>with</strong> increasingY doping level, <strong>and</strong> the highest TSDC peakappears at the specimen <strong>with</strong> 3.0mol% Y.However, the specimen <strong>with</strong> 5.0mol% Y showslower TSDC peaks than the Ba(Ti 0.97 Y 0.03 )O 2.985 .The main conduction mechanism at thetemperature range studied can be considered as anionic conduction by oxygen vacancy. Thus, theincrease in TSDC <strong>of</strong> Y-doped BaTiO 3 could be dueto the migration <strong>of</strong> oxygen vacancies during thepolarization <strong>and</strong> depolarization process. As shownin Fig. 4 the specimen doped <strong>with</strong> 5.0mol% Yreveals a microstructure <strong>with</strong> small grain sizes <strong>and</strong>rich pores, compared <strong>with</strong> the specimens doped<strong>with</strong> below 3.0mol% Y. This could be effective forsuppressing the migration <strong>of</strong> oxygen vacanciesduring the polarization <strong>and</strong> depolarization process.Thus, the small grain size <strong>and</strong> the low density inthe sample doped <strong>with</strong> 5.0mol% Y seem to beresponsible for the decrease in TSDC.-100 1 2 3 4 5LOG TIME (min.)Fig. 6. Time dependence <strong>of</strong> leakage currents <strong>of</strong> Y<strong>and</strong> <strong>Mn</strong> doped BaTiO 3 at 150 <strong>and</strong> 10,600 V/cmRödel reported that an increasing amount <strong>of</strong> <strong>Mn</strong> 2+is created from <strong>Mn</strong> 3+ or <strong>Mn</strong> 4+ during thedegradation process. This seems to occur close tothe anode rather than near the cathode [22]. Asoxygen ions in the lattice move to the anode <strong>and</strong>are oxidized, doubly ionized oxygen vacancies <strong>and</strong>corresponding electrons will be left behind. Thoseelectrons could be consumed for the manganesereduction. This would be expressed as an oxygenvacancy injection from the anode. <strong>Co</strong>nsequently,positively charged oxygen vacancies will movetowards the cathode <strong>and</strong> then be captured by theCURRENT (x10 -8 A)543210Ba(Ti 1-xY x)O 3-0.5x(1) x=0.002(2) x=0.02(3) x=0.03(4) x=0.05T p =150 o Ct p =30 min.V p =200V/cmH. R. =2 o C/min-100 -50 0 50 100 150 200 250TEMPERATURE( o C)Fig. 7. TSDC <strong>of</strong> Y-doped BaTiO 3TSDC <strong>of</strong> BaTiO 3 co-doped <strong>with</strong> Y <strong>and</strong> <strong>Mn</strong> isshown in Fig. 8 <strong>and</strong> Fig. 9. The sharp peaks were(3)(4)(1)(2)27
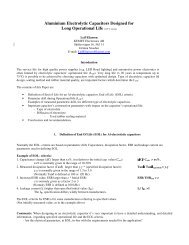
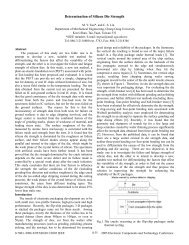
confirmed around phase transition temperatures <strong>of</strong>BaTiO 3 . The TSDC <strong>of</strong> (Ba 1-x Y x )(Ti 1-y <strong>Mn</strong> y )O 3decreased at the temperature range above 160 o C,whereas a slight increase in TSDC was observed atthe specimens <strong>of</strong> Ba(Ti 1-x-y Y x <strong>Mn</strong> y )O 3 . Hubnerreported that the un-doped BaTiO 3 exhibitstypically three TSDC peaks around the phasetransition temperatures [24]. The sharp peaks <strong>of</strong>specimens may be due to the abrupt depolarizationcurrents accompanied by the phase transition. Theoxygen vacancy <strong>of</strong> (Ba 0.99 Y 0.01 )(Ti 0.995 <strong>Mn</strong> 0.005 )O 3specimen can be significantly reduced by excessoxygen <strong>with</strong> donor (yttrium) doping. AlthoughBa(Ti 0.985 Y 0.01 <strong>Mn</strong> 0.005 )O 3-y has plenty <strong>of</strong> oxygen••vacancies, the defect association <strong>of</strong> ( <strong>Mn</strong> Ti′′ −V)Ocould effectively suppress the migration <strong>of</strong> oxygenvacancies during polarization <strong>and</strong> depolarizationprocess. However, a slight increase in TSDC <strong>with</strong>Ba(Ti0.985Y 0.01 <strong>Mn</strong> 0.005 )O 3-y above 160 o C implies••that the defect association ( <strong>Mn</strong>′′ Ti−VO) could bedissociated by reasonable amount <strong>of</strong> thermalenergy.CURRENT (x10 -9 A)1086420(Ba 0.99Y 0.01)(Ti 0.995<strong>Mn</strong> 0.005)O 3T p =150 o Ct p =30 min.V p =8000V/cmH. R. =2 o C/min.-100 -50 0 50 100 150 200 250TEMPERATURE ( o C)Fig. 8. TSDC <strong>of</strong> (Ba 0.99 Y 0.01 )(Ti 0.995 <strong>Mn</strong> 0.005 )O 3<strong>Co</strong>nclusions(1) As Y content was increased in the systemBa(Ti 1-x Y x )O 3-0.5x , the oxygen vacancyconcentration increased <strong>and</strong> the conductivityminimum moved to lower oxygen partial pressures.(2) Ba(Ti 0.99 Y 0.01 )O 2.995 showed considerableleakage currents, compared <strong>with</strong> the un-dopedBaTiO 3 .Current (x10 -9 A)3.02.52.01.51.00.50.0Ba(Ti 0.985Y 0.01<strong>Mn</strong> 0.005)O 3-yT p =150 o Ct p =30 min.V p =8000V/cmH. R. =2 o C/min.-100 -50 0 50 100 150 200 250TEMPERATURE ( o C)Fig. 9. TSDC <strong>of</strong> Ba(Ti 0.985 Y 0.01 <strong>Mn</strong> 0.005 )O 3-y(3) The leakage current <strong>of</strong>Ba(Ti 0.985 Y 0.01 <strong>Mn</strong> 0.005 )O 3-y was stable <strong>with</strong> time <strong>and</strong>much lower than that <strong>of</strong> the un-doped BaTiO 3 .(4) The lowest leakage current was observed <strong>with</strong>(Ba 0.99 Y 0.01 )(Ti 0.995 <strong>Mn</strong> 0.005 )O 3(5) In the system <strong>of</strong> Ba(Ti 1-x Y x )O 3-0.5x , the height<strong>of</strong> TSDC peak increased <strong>with</strong> increasing Y dopinglevels, <strong>and</strong> the specimen <strong>with</strong> 3.0mol% Y showedthe highest TSDC peak, whereas the specimen <strong>with</strong>5.0mol% Y exhibited lower TSDC peaks thanBa(Ti 0.97 Y 0.03 )O 2.985 . (6) The slight increase inTSDC at the temperature range above 160 o C wasconfirmed <strong>with</strong> the specimens <strong>of</strong>Ba(Ti 0.985 Y 0.01 <strong>Mn</strong> 0.005 )O 3-yAcknowledgementThis research was supported by a grant from theCenter for Advanced Materials Processing(CAMP) <strong>of</strong> the 21st Century Frontier R&DProgram funded by the Ministry <strong>of</strong> Science <strong>and</strong>Technology, Republic <strong>of</strong> Korea.References1. R. D. Shannon, Acta Cryst. A32 (1976) 751.2. K. Takada, E. Chang <strong>and</strong> D. M. Smyth,Advanced in Ceram. 19 (1986) 147.3. J. H. Hwang <strong>and</strong> Y. H. Han, Solid State Ionics140 (2001) 18<strong>1.4</strong>. L. A. Xue, Y. Chen <strong>and</strong> J. Brook, Mat. Sci. <strong>and</strong>Eng. B1 (1988) 193.5. H. J. Hagemann <strong>and</strong> H. Ihrig, Physical ReviewB, 20 (1979) 3871.28
6. S. B. Desu, Ferroelectrics, 37 (1981) 665.7. S.-I. Osawa, A. Furuzawa, <strong>and</strong> N. Fujikawa, J.<strong>of</strong> Am. Ceram. Soc., 76 (1993) 1191.8. K. Okazaki <strong>and</strong> H. Igarashi, Ferroelectrics, 27(1980) 263.9. K. Morita, Y. Mizuno, H. Chazona <strong>and</strong> H. Kishi,Jpn. J. Appl. Phys., 41 (2002) 6957.10. M. Pechini: U. S. Patent 3330697 (1967).11. R. K. Sharma, N. H. Chan <strong>and</strong> D. M. Smyth: J.Am. Ceram. Soc. 64 (1981) 448.12. J. Jeong, Y. H. Han, Phys. Chem. Chem. Phys.,5 (2003) 2264.13. F. A. Kröger <strong>and</strong> H. J. Vink: Solid StatePhysics, eds. F. Seitz <strong>and</strong> D. Turnbull (AcademicPress, New York, 1956) Vol. 3, p. 307.14. N. H. Chan, R. K. Sharma <strong>and</strong> D. M. Smyth, J.Am. Ceram. Soc., 65 (1982) 167.15. Y. H. Han, J. B. Appleby <strong>and</strong> D. M. Smyth, J.Am. Ceram. Soc., 70 (1987) 96.16. S. A. Long <strong>and</strong> R. N. Blumenthal: J. Am.Ceram. Soc. 54 (1971) 515.17. N. H. Chan <strong>and</strong> D. M. Smyth: J. Electrochem.Soc. 123 (1976) 1584.18. H. J. Hagemann <strong>and</strong> D. Hennings,J.Am.Ceram.Soc. 64, 10 (1981) 590.19. H. J. Hagemann <strong>and</strong> H. Ihrig, Phys. Rev. 20(1979) 3871.20. S. B. Desu, Ferroelectrics 37 (1981) 665.21. J. Daniels <strong>and</strong> K. H. Hardtl, Philips. Res.Repts. 31 (1976) 489.22. J.Rödel <strong>and</strong> G. Tom<strong>and</strong>l, J. Mater. Sci. 19(1984)23. R. Merkle <strong>and</strong> J. Maier, Phys. Chem. Chem.Phys., 5 (2003) 2297.24. W. Hubner, Ph. D. thesis, in Uni. <strong>of</strong> Missouri-Rolla (1987).29