MDG Watch - NSCB
MDG Watch - NSCB
MDG Watch - NSCB

You also want an ePaper? Increase the reach of your titles
YUMPU automatically turns print PDFs into web optimized ePapers that Google loves.
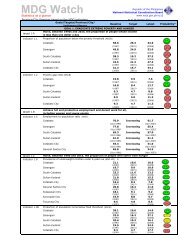
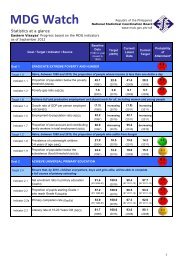
Goal / Target / Indicator / SourceBaselineData(1990 or yearclosest to1990)Target(2015)Current/LatestDataCurrentTargetProbabilityofAttainment*Goal 1ERADICATE EXTREME POVERTY AND HUNGERLowTarget 1Halve, between 1990 and 2015, the proportion of people whose income is less than one dollara day.Indicator 1Proportion of Population Belowthe Poverty Threshold (<strong>NSCB</strong>)47.1(1991)23.6(2015)48.5(2006)32.4(2006)LowIndicator 2Poverty Gap Ratio (<strong>NSCB</strong>)16.4(1991)8.2(2015)12.6(2006)11.3(2006)MediumTarget 2Halve, between 1990 and 2015, the proportion of people who suffer from hunger.Indicator 3Proportion of Population Belowthe Food Threshold (<strong>NSCB</strong>)32.7(1991)16.4(2015)25.7(2006)22.5(2006)MediumIndicator 4Prevalence of UnderweightChildren 0-6 Years of Age(NNC)21.0(2004)10.5(2015)20.2(2007)18.1(2007)Low* Probability of attainment was based on comparison of actual (from baseline to latest data) and required (from baseline to target year).Legend: Low (Below 0.5) Medium (between 0.5 and 0.9) High (above 0.9)
Goal / Target / Indicator / SourceBaselineData(1990 or yearclosest to1990)Target(2015)Current/LatestDataCurrentTargetProbabilityofAttainment*Goal 2ACHIEVE UNIVERSAL PRIMARY EDUCATIONLowTarget 3Ensure that, by 2015, children everywhere, boys and girls alike, will be able to complete a fullcourse of primary schooling.Indicator 5Elementary Net EnrolmentRatio (DepED)91.4(SY 2000-01)100.0(2015)76.4(SY 2006-07)94.8(SY 2006-07)LowIndicator 6Elementary Cohort SurvivalRate (DepED)57.2(SY 1990-91)100.0(2015)60.3(SY 2006-07)84.6(SY 2006-07)LowIndicator 7Basic Literacy Rate (NSO)81.7(1989)100.0(2015)90.1(2003)91.6(2003)Medium
Goal / Target / Indicator / SourceBaselineData(1990 or yearclosest to1990)Target(2015)Current/LatestDataCurrentTargetProbabilityofAttainment*Goal 3PROMOTE GENDER EQUALITY AND EMPOWER WOMENLowTarget 4Eliminate gender disparity in primary and secondary education, preferably by 2005, and to alllevels of education no later than 2015.Indicator 8aRatio of Girls to Boys inPrimary Education (DepEd)0.976(SY 1990-91)1.000(2015)0.954(SY 2006-07)0.990(SY 2006-07)LowIndicator 8bRation of Girls to Boys inSecondary Education (DepEd)1.086(SY 2000-01)1.000(2015)1.100(SY 2006-07)1.057(SY 2006-07)LowIndicator 9Ratio of Literate Females toMales 15-24 Years Old (NSO)1.063(1989)1.000(2015)1.072(2003)1.029(2003)LowIndicator 10Proportion of Seats Held byWomen in Local Politics (DILG)15.4(1995)50.0(2015)22.9(2007)36.2(2007)Low
Goal / Target / Indicator / SourceBaselineData(1990 or yearclosest to1990)Target(2015)Current/LatestDataCurrentTargetProbabilityofAttainment*Goal 4REDUCE CHILD MORTALITYHighTarget 5Reduce by two-thirds, between 1990 and 2015, under-five mortality rate.Indicator 11Under-Five Mortality Rate(NSO)98.0(1993)32.7(2015)43.0(2006)59.4(2006)HighIndicator 12Infant Mortality Rate (NSO)61.0(1993)20.3(2015)31.0(2006)37.0(2006)HighIndicator 13Proportion of 1 Year OldChildren Immunized AgainstMeasles (DOH)80.6(1990)100.0(2015)83.8(2006)93.0(2006)Low
Goal / Target / Indicator / SourceBaselineData(1990 or yearclosest to1990)Target(2015)Current/LatestDataCurrentTargetProbabilityofAttainment*Goal 5IMPROVE MATERNAL HEALTHLowTarget 6Reduce by three-quarters, between 1990 and 2015, the maternal mortality ratio.Indicator 14Maternal Mortality Rate(<strong>NSCB</strong>/NSO)225.9(1990)56.5(2015)231.3(2003)137.8(2003)LowIndicator 15Proportion of Births Attendedby Skilled Health Personnel(DOH)61.6(1990)100.0(2015)62.0(2006)86.2(2006)LowGoal 6COMBAT HIV/AIDS, MALARIA AND OTHER DISEASESLowTarget 7Have halted by 2015 and begun to reverse the spread of HIV/AIDS.Indicator 16Condom Use Rate of theContraceptive Prevalence Rate(NSO)1.2(2003)increasing(2015)0.8(2005)increasing(2005)Low
Goal / Target / Indicator / SourceBaselineData(1990 or yearclosest to1990)Target(2015)Current/LatestDataCurrentTargetProbabilityofAttainment*Goal 7ENSURE ENVIRONMENTAL SUSTAINABILITYHighTarget 10Halve, by 2015, the proportion of people without sustainable access to safe drinking waterand basic sanitation.Indicator 17Proportion of Households withSustainable Access toImproved Water Source (NSO)65.1(1990)82.6(2015)79.5(2004)74.9(2004)HighIndicator 18Proportion of Households withAccess to Improved Sanitation(NSO)51.7(1990)75.9(2015)73.9(2004)65.2(2004)HighTarget 11By 2020, to have achieved a significant improvement in the lives of at least 100 million slumdwellers.Indicator 19Proportion of Households withAccess to Secure Tenure(NSO)91.7(1990)100.0(2015)80.0(2000)95.0(2000)Low