Annual Report 2010/11 - Sonova
Annual Report 2010/11 - Sonova Annual Report 2010/11 - Sonova
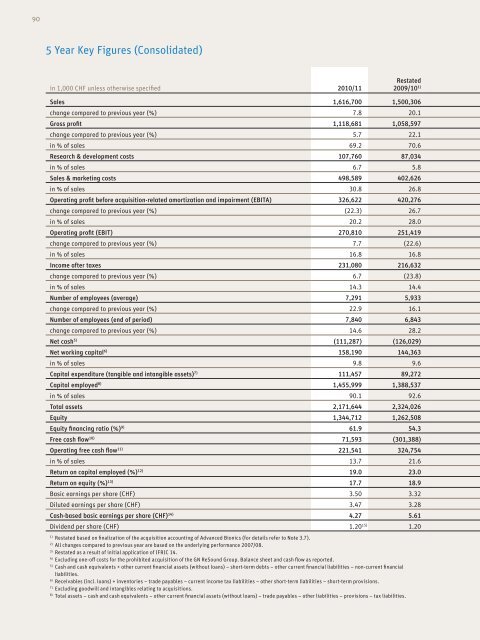
90 5 year key Figures (Consolidated) in 1,000 CHF unless otherwise specified 2010/11 Restated 2009/10 1) Sales 1,616,700 1,500,306 change compared to previous year (%) 7.8 20.1 Gross profit 1,118,681 1,058,597 change compared to previous year (%) 5.7 22.1 in % of sales 69.2 70.6 Research & development costs 107,760 87,034 in % of sales 6.7 5.8 Sales & marketing costs 498,589 402,626 in % of sales 30.8 26.8 Operating profit before acquisition-related amortization and impairment (EBITA) 326,622 420,276 change compared to previous year (%) (22.3) 26.7 in % of sales 20.2 28.0 Operating profit (EBIT) 270,810 251,419 change compared to previous year (%) 7.7 (22.6) in % of sales 16.8 16.8 Income after taxes 231,080 216,632 change compared to previous year (%) 6.7 (23.8) in % of sales 14.3 14.4 Number of employees (average) 7,291 5,933 change compared to previous year (%) 22.9 16.1 Number of employees (end of period) 7,840 6,843 change compared to previous year (%) 14.6 28.2 Net cash 5) (111,287) (126,029) Net working capital 6) 158,190 144,363 in % of sales 9.8 9.6 Capital expenditure (tangible and intangible assets) 7) 111,457 89,272 Capital employed 8) 1,455,999 1,388,537 in % of sales 90.1 92.6 Total assets 2,171,644 2,324,026 Equity 1,344,712 1,262,508 Equity financing ratio (%) 9) 61.9 54.3 Free cash flow 10) 71,593 (301,388) Operating free cash flow 11) 221,541 324,754 in % of sales 13.7 21.6 Return on capital employed (%) 12) 19.0 23.0 Return on equity (%) 13) 17.7 18.9 Basic earnings per share (CHF) 3.50 3.32 diluted earnings per share (CHF) 3.47 3.28 Cash-based basic earnings per share (CHF) 14) 4.27 5.61 dividend per share (CHF) 1.20 15) 1.20 1) Restated based on finalization of the acquisition accounting of Advanced Bionics (for details refer to Note 3.7). 2) All changes compared to previous year are based on the underlying performance 2007/08. 3) Restated as a result of initial application of IFRIC 14. 4) Excluding one-off costs for the prohibited acquisition of the GN ReSound Group. Balance sheet and cash flow as reported. 5) Cash and cash equivalents + other current financial assets (without loans) – short-term debts – other current financial liabilities – non-current financial liabilities. 6) Receivables (incl. loans) + inventories – trade payables – current income tax liabilities – other short-term liabilities – short-term provisions. 7) Excluding goodwill and intangibles relating to acquisitions. 8) Total assets – cash and cash equivalents – other current financial assets (without loans) – trade payables – other liabilities – provisions – tax liabilities.
Reported 2009/10 2008/09 2) Reported performance 2007/08 3) Underlying performance 2007/08 3)/4) 2006/07 1,500,306 1,249,197 1,204,779 1,204,779 1,072,796 20.1 3.7 12.3 12.3 23.8 1,058,427 867,218 841,584 841,584 732,075 22.0 3.0 15.0 15.0 26.7 70.5 69.4 69.9 69.9 68.2 87,034 77,377 76,454 76,454 67,590 5.8 6.2 6.3 6.3 6.3 402,626 340,312 309,200 309,200 278,978 26.8 27.2 25.7 25.7 26.0 420,106 331,778 331,737 339,752 283,643 26.6 (2.3) 17.0 19.8 32.6 28.0 26.6 27.5 28.2 26.4 406,753 325,014 326,743 334,758 279,765 25.1 (2.9) 16.8 19.7 31.5 27.1 26.0 27.1 27.8 26.1 354,813 284,110 274,140 305,196 242,875 24.9 (6.9) 12.9 25.7 40.0 23.6 22.7 22.8 25.3 22.6 5,933 5,108 4,351 4,351 3,813 16.1 17.4 14.1 14.1 20.4 6,843 5,339 4,746 4,746 4,023 28.2 12.5 18.0 18.0 17.3 (126,029) 227,689 311,647 311,647 296,480 177,011 152,355 107,890 107,890 96,313 11.8 12.2 9.0 9.0 9.0 89,272 75,985 55,892 55,892 31,242 1,534,387 798,934 608,207 608,207 547,215 102.3 64.0 50.5 50.5 51.0 2,409,257 1,426,560 1,273,928 1,273,928 1,263,392 1,408,358 1,026,623 919,854 919,854 894,687 58.5 72.0 72.2 72.2 70.8 (301,388) 79,003 219,392 219,392 144,542 324,754 176,285 255,835 255,835 231,533 21.6 14.1 21.2 21.2 21.6 34.9 46.2 56.6 57.9 56.3 29.1 29.2 30.2 33.6 32.0 5.41 4.35 4.09 4.55 3.64 5.36 4.33 4.04 4.50 3.59 5.60 4.43 4.09 4.55 3.63 1.20 1.00 1.00 1.00 0.75 9) Equity in % of total assets. 10) Cash flow from operating activities + cash flow from investing activities. 11) Free cash flow – cash consideration for acquisitions, net of cash acquired. 12) EBIT in % of capital employed (average). 13) Income after taxes in % of equity (average). 14) Excluding the amortization of acquisition-related intangibles, impairment and unwinding effect of the discount on acquisition-related earn-out payments, net of tax. 15) Proposal to the Annual General Shareholders’ Meeting of June 21, 2011. FINANCIAl REVIEW 91
- Page 43 and 44: ISO 9001:2000 and 13485:2003 certif
- Page 45 and 46: The key environmental data shown in
- Page 47 and 48: ENVIRONMENTAL MANAGEMENT AT THE ST
- Page 49 and 50: CAMBODIA - BETTER OPPORTUNITIES FOR
- Page 51 and 52: Better hearing - better success at
- Page 53 and 54: in critical moments. As a consequen
- Page 55 and 56: CrOSS-SHArEHOLDInGS Sonova Holding
- Page 57 and 58: BOArD Of DIrECTOrS The primary duty
- Page 59 and 60: Andy rihs Co-founder, non-executive
- Page 61 and 62: onald van der Vis non-executive mem
- Page 63 and 64: AuDIT COMMITTEE The members of the
- Page 65 and 66: Alexander Zschokke Interim CEO, GVP
- Page 67 and 68: Dr Hans Leysieffer GVP research & D
- Page 69 and 70: COmPenSatiOn and SharehOldingS - co
- Page 71 and 72: The shares/rSus have a blocking per
- Page 73 and 74: COMPEnSATIOn TO MEMBErS Of THE MAnA
- Page 75 and 76: SHArEHOLDInGS Of MEMBErS Of THE BOA
- Page 77 and 78: The following table shows the detai
- Page 79 and 80: CHAnGES Of COnTrOL AnD DEfEnSE MEAS
- Page 81 and 82: COMPEnSATIOn rEPOrT inveStOrS at SO
- Page 83: develOPing SPeeCh CaPaBilitieS - mo
- Page 86 and 87: 82 Financial Review - setting the c
- Page 88 and 89: 84 SALES in CHF m EBITA in CHF m 1,
- Page 90 and 91: 86 SUBSTANTIAl INVESTMENTS IN INNoV
- Page 92 and 93: 88 AdVANCEd BIoNICS RESUMES SAlES I
- Page 96 and 97: 92 Consolidated Income Statements 1
- Page 98 and 99: 94 Consolidated Cash Flow Statement
- Page 100 and 101: 96 NoTeS To THe CoNSoLIdATed FINANC
- Page 102 and 103: 98 INveSTMeNTS IN JoINT veNTuReS In
- Page 104 and 105: 100 LeASING Assets that are held un
- Page 106 and 107: 102 SeGMeNT RePoRTING operating seg
- Page 108 and 109: 104 3.5 derivative financial instru
- Page 110 and 111: 106 3.7 Restatement of prior year
- Page 112 and 113: 108 Consolidated Changes in Equity
- Page 114 and 115: 110 5. segment information segment
- Page 116 and 117: 112 6. other expenses, net 1,000 ch
- Page 118 and 119: 114 Deferred tax assets and (liabil
- Page 120 and 121: 116 11. cash and cash equivalents 1
- Page 122 and 123: 118 14. other receivables and prepa
- Page 124 and 125: 120 the increase in property, plant
- Page 126 and 127: 122 1,000 cHf 31.3.2010 Cost Goodwi
- Page 128 and 129: 124 20. Provisions 1,000 cHf 31.3.2
- Page 130 and 131: 126 23. non-current financial liabi
- Page 132 and 133: 128 foreign currency sensitivity an
- Page 134 and 135: 130 the following table summarizes
- Page 136 and 137: 132 caPital RisK manaGement it is t
- Page 138 and 139: 134 the annual General shareholders
- Page 140 and 141: 136 28. Related party transactions
- Page 142 and 143: 138 Amounts recognized in the incom
90<br />
5 year key Figures (Consolidated)<br />
in 1,000 CHF unless otherwise specified <strong>2010</strong>/<strong>11</strong><br />
Restated<br />
2009/10 1)<br />
Sales 1,616,700 1,500,306<br />
change compared to previous year (%) 7.8 20.1<br />
Gross profit 1,<strong>11</strong>8,681 1,058,597<br />
change compared to previous year (%) 5.7 22.1<br />
in % of sales 69.2 70.6<br />
Research & development costs 107,760 87,034<br />
in % of sales 6.7 5.8<br />
Sales & marketing costs 498,589 402,626<br />
in % of sales 30.8 26.8<br />
Operating profit before acquisition-related amortization and impairment (EBITA) 326,622 420,276<br />
change compared to previous year (%) (22.3) 26.7<br />
in % of sales 20.2 28.0<br />
Operating profit (EBIT) 270,810 251,419<br />
change compared to previous year (%) 7.7 (22.6)<br />
in % of sales 16.8 16.8<br />
Income after taxes 231,080 216,632<br />
change compared to previous year (%) 6.7 (23.8)<br />
in % of sales 14.3 14.4<br />
Number of employees (average) 7,291 5,933<br />
change compared to previous year (%) 22.9 16.1<br />
Number of employees (end of period) 7,840 6,843<br />
change compared to previous year (%) 14.6 28.2<br />
Net cash 5) (<strong>11</strong>1,287) (126,029)<br />
Net working capital 6) 158,190 144,363<br />
in % of sales 9.8 9.6<br />
Capital expenditure (tangible and intangible assets) 7) <strong>11</strong>1,457 89,272<br />
Capital employed 8) 1,455,999 1,388,537<br />
in % of sales 90.1 92.6<br />
Total assets 2,171,644 2,324,026<br />
Equity 1,344,712 1,262,508<br />
Equity financing ratio (%) 9) 61.9 54.3<br />
Free cash flow 10) 71,593 (301,388)<br />
Operating free cash flow <strong>11</strong>) 221,541 324,754<br />
in % of sales 13.7 21.6<br />
Return on capital employed (%) 12) 19.0 23.0<br />
Return on equity (%) 13) 17.7 18.9<br />
Basic earnings per share (CHF) 3.50 3.32<br />
diluted earnings per share (CHF) 3.47 3.28<br />
Cash-based basic earnings per share (CHF) 14) 4.27 5.61<br />
dividend per share (CHF) 1.20 15) 1.20<br />
1) Restated based on finalization of the acquisition accounting of Advanced Bionics (for details refer to Note 3.7).<br />
2) All changes compared to previous year are based on the underlying performance 2007/08.<br />
3) Restated as a result of initial application of IFRIC 14.<br />
4) Excluding one-off costs for the prohibited acquisition of the GN ReSound Group. Balance sheet and cash flow as reported.<br />
5) Cash and cash equivalents + other current financial assets (without loans) – short-term debts – other current financial liabilities – non-current financial<br />
liabilities.<br />
6) Receivables (incl. loans) + inventories – trade payables – current income tax liabilities – other short-term liabilities – short-term provisions.<br />
7) Excluding goodwill and intangibles relating to acquisitions.<br />
8) Total assets – cash and cash equivalents – other current financial assets (without loans) – trade payables – other liabilities – provisions – tax liabilities.


