Annual Report 2010/11 - Sonova
Annual Report 2010/11 - Sonova
Annual Report 2010/11 - Sonova

Create successful ePaper yourself
Turn your PDF publications into a flip-book with our unique Google optimized e-Paper software.
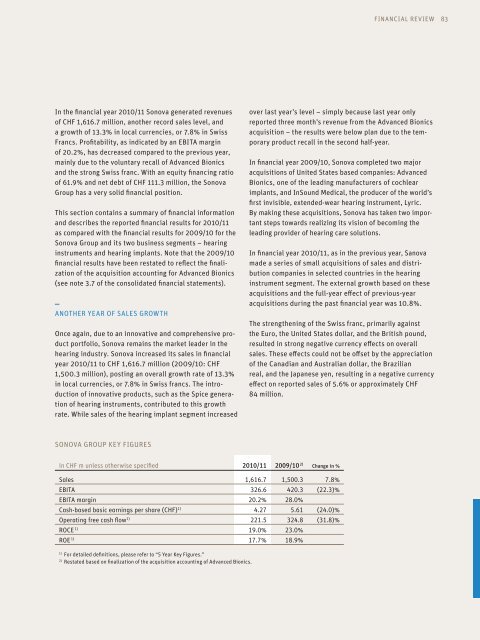
In the financial year <strong>2010</strong>/<strong>11</strong> <strong>Sonova</strong> generated revenues<br />
of CHF 1,616.7 million, another record sales level, and<br />
a growth of 13.3% in local currencies, or 7.8% in Swiss<br />
Francs. Profitability, as indicated by an EBITA margin<br />
of 20.2%, has decreased compared to the previous year,<br />
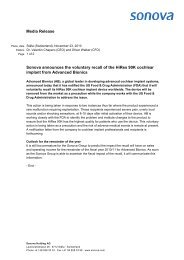
mainly due to the voluntary recall of Advanced Bionics<br />
and the strong Swiss franc. With an equity financing ratio<br />
of 61.9% and net debt of CHF <strong>11</strong>1.3 million, the <strong>Sonova</strong><br />
Group has a very solid financial position.<br />
This section contains a summary of financial information<br />
and describes the reported financial results for <strong>2010</strong>/<strong>11</strong><br />
as compared with the financial results for 2009/10 for the<br />
<strong>Sonova</strong> Group and its two business segments – hearing<br />
in struments and hearing implants. Note that the 2009/10<br />
financial results have been restated to reflect the finalization<br />
of the acquisition accounting for Advanced Bionics<br />
(see note 3.7 of the consolidated financial statements).<br />
ANoTHER yEAR oF SAlES GRoWTH<br />
once again, due to an innovative and comprehensive product<br />
portfolio, <strong>Sonova</strong> remains the market leader in the<br />
hearing industry. <strong>Sonova</strong> increased its sales in financial<br />
year <strong>2010</strong>/<strong>11</strong> to CHF 1,616.7 million (2009/10: CHF<br />
1,500.3 million), posting an overall growth rate of 13.3%<br />
in local currencies, or 7.8% in Swiss francs. The introduction<br />
of innovative products, such as the Spice generation<br />
of hearing instruments, contributed to this growth<br />
rate. While sales of the hearing implant segment increased<br />
SoNoVA GRoUP kEy FIGURES<br />
in CHF m unless otherwise specified <strong>2010</strong>/<strong>11</strong> 2009/10 2)<br />
FINANCIAl REVIEW<br />
over last year’s level – simply because last year only<br />
reported three month’s revenue from the Advanced Bionics<br />
acquisition – the results were below plan due to the temporary<br />
product recall in the second half-year.<br />
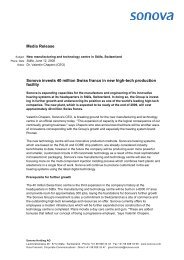
In financial year 2009/10, <strong>Sonova</strong> completed two major<br />
acquisitions of United States based companies: Advanced<br />
Bionics, one of the leading manufacturers of cochlear<br />
im plants, and InSound Medical, the producer of the world’s<br />
first invisible, extended-wear hearing instrument, lyric.<br />
By making these acquisitions, <strong>Sonova</strong> has taken two important<br />
steps towards realizing its vision of becoming the<br />
leading provider of hearing care solutions.<br />
In financial year <strong>2010</strong>/<strong>11</strong>, as in the previous year, Sanova<br />
made a series of small acquisitions of sales and dis tribution<br />
companies in selected countries in the hearing<br />
instrument segment. The external growth based on these<br />
acquisitions and the full-year effect of previous-year<br />
acquisitions during the past financial year was 10.8%.<br />
The strengthening of the Swiss franc, primarily against<br />
the Euro, the United States dollar, and the British pound,<br />
resulted in strong negative currency effects on overall<br />
sales. These effects could not be offset by the appreciation<br />
of the Canadian and Australian dollar, the Brazilian<br />
real, and the Japanese yen, resulting in a negative currency<br />
effect on reported sales of 5.6% or approximately CHF<br />
84 million.<br />
Change in %<br />
Sales 1,616.7 1,500.3 7.8%<br />
EBITA 326.6 420.3 (22.3)%<br />
EBITA margin 20.2% 28.0%<br />
Cash-based basic earnings per share (CHF) 1) 4.27 5.61 (24.0)%<br />
operating free cash flow 1) 221.5 324.8 (31.8)%<br />
RoCE 1) 19.0% 23.0%<br />
RoE 1) 17.7% 18.9%<br />
1) For detailed definitions, please refer to “5 year key Figures.”<br />
2) Restated based on finalization of the acquisition accounting of Advanced Bionics.<br />
83