Annual Report 2010/11 - Sonova
Annual Report 2010/11 - Sonova Annual Report 2010/11 - Sonova
130 the following table summarizes the contractual maturities of financial liabilities as of march 31, 2011 and 2010: 1,000 cHf 31.3.2011 due less than 3 months due 3 months to 1 year due 1 year to 5 years due more than 5 years short-term debts 40,006 129 40,135 other current financial liabilities 16,905 16,905 trade and other short-term liabilities 146,326 35,558 181,884 Total current financial liabilities 186,332 52,592 238,924 long-term bank debts 227,964 227,964 Interest rate swap – negative replacement value 1,861 1,861 other non-current financial liabilities 1,188 58 1,246 Total non-current financial liabilities 231,013 58 231,071 Total financial liabilities 186,332 52,592 231,013 58 469,995 1,000 cHf 31.3.2010 due less than 3 months due 3 months to 1 year due 1 year to 5 years due more than 5 years short-term debts 41,189 39,687 80,876 other current financial liabilities 2,789 2,789 trade and other short-term liabilities 147,434 33,973 181,407 Total current financial liabilities 188,623 76,449 265,072 long-term bank debts 386,893 386,893 Interest rate swap – negative replacement value 2,057 2,057 other non-current financial liabilities 1,035 95 1,130 Total non-current financial liabilities 389,985 95 390,080 Total financial liabilities 188,623 76,449 389,985 95 655,152 total total
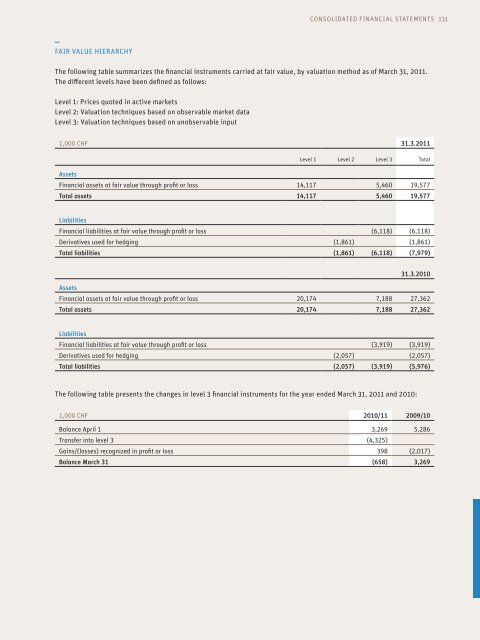
faiR ValUe HieRaRcHy consolidated financial statements 131 the following table summarizes the financial instruments carried at fair value, by valuation method as of march 31, 2011. the different levels have been defined as follows: level 1: Prices quoted in active markets level 2: Valuation techniques based on observable market data level 3: Valuation techniques based on unobservable input 1,000 cHf 31.3.2011 Assets level 1 level 2 level 3 total financial assets at fair value through profit or loss 14,117 5,460 19,577 Total assets 14,117 5,460 19,577 Liabilities financial liabilities at fair value through profit or loss (6,118) (6,118) derivatives used for hedging (1,861) (1,861) Total liabilities (1,861) (6,118) (7,979) Assets 31.3.2010 financial assets at fair value through profit or loss 20,174 7,188 27,362 Total assets 20,174 7,188 27,362 Liabilities financial liabilities at fair value through profit or loss (3,919) (3,919) derivatives used for hedging (2,057) (2,057) Total liabilities (2,057) (3,919) (5,976) the following table presents the changes in level 3 financial instruments for the year ended march 31, 2011 and 2010: 1,000 cHf 2010/11 2009/10 Balance april 1 3,269 5,286 transfer into level 3 (4,325) Gains/(losses) recognized in profit or loss 398 (2,017) Balance March 31 (658) 3,269
- Page 83: develOPing SPeeCh CaPaBilitieS - mo
- Page 86 and 87: 82 Financial Review - setting the c
- Page 88 and 89: 84 SALES in CHF m EBITA in CHF m 1,
- Page 90 and 91: 86 SUBSTANTIAl INVESTMENTS IN INNoV
- Page 92 and 93: 88 AdVANCEd BIoNICS RESUMES SAlES I
- Page 94 and 95: 90 5 year key Figures (Consolidated
- Page 96 and 97: 92 Consolidated Income Statements 1
- Page 98 and 99: 94 Consolidated Cash Flow Statement
- Page 100 and 101: 96 NoTeS To THe CoNSoLIdATed FINANC
- Page 102 and 103: 98 INveSTMeNTS IN JoINT veNTuReS In
- Page 104 and 105: 100 LeASING Assets that are held un
- Page 106 and 107: 102 SeGMeNT RePoRTING operating seg
- Page 108 and 109: 104 3.5 derivative financial instru
- Page 110 and 111: 106 3.7 Restatement of prior year
- Page 112 and 113: 108 Consolidated Changes in Equity
- Page 114 and 115: 110 5. segment information segment
- Page 116 and 117: 112 6. other expenses, net 1,000 ch
- Page 118 and 119: 114 Deferred tax assets and (liabil
- Page 120 and 121: 116 11. cash and cash equivalents 1
- Page 122 and 123: 118 14. other receivables and prepa
- Page 124 and 125: 120 the increase in property, plant
- Page 126 and 127: 122 1,000 cHf 31.3.2010 Cost Goodwi
- Page 128 and 129: 124 20. Provisions 1,000 cHf 31.3.2
- Page 130 and 131: 126 23. non-current financial liabi
- Page 132 and 133: 128 foreign currency sensitivity an
- Page 136 and 137: 132 caPital RisK manaGement it is t
- Page 138 and 139: 134 the annual General shareholders
- Page 140 and 141: 136 28. Related party transactions
- Page 142 and 143: 138 Amounts recognized in the incom
- Page 144 and 145: 140 30. Employee share option and s
- Page 146 and 147: 142 The fair value of options/warra
- Page 148 and 149: 144 Changes in outstanding shares/R
- Page 150 and 151: 146 36. list of significant consoli
- Page 152 and 153: 148 REPORT OF THE STATuTORY AuDITOR
- Page 154 and 155: 150 Income Statements 1,000 CHF Not
- Page 156 and 157: 152 NOTES TO THE FINANCIAL STATEmEN
- Page 158 and 159: 154 Executive Equity Award Plan The
- Page 160 and 161: 156 Compensation to the management
- Page 162 and 163: 158 The following table shows the d
- Page 164 and 165: 160 Warrants EEAP 10 2) Warrants/ o
- Page 166 and 167: 162 Company name Activity Domicile
- Page 168 and 169: 164 Appropriation of Available Earn
- Page 170 and 171: 166 REPORT OF THE STATUTORy AUDITOR
- Page 173 and 174: Disclaimer This report contains for
faiR ValUe HieRaRcHy<br />
consolidated financial statements 131<br />
the following table summarizes the financial instruments carried at fair value, by valuation method as of march 31, 20<strong>11</strong>.<br />
the different levels have been defined as follows:<br />
level 1: Prices quoted in active markets<br />
level 2: Valuation techniques based on observable market data<br />
level 3: Valuation techniques based on unobservable input<br />
1,000 cHf 31.3.20<strong>11</strong><br />
Assets<br />
level 1 level 2 level 3 total<br />
financial assets at fair value through profit or loss 14,<strong>11</strong>7 5,460 19,577<br />
Total assets 14,<strong>11</strong>7 5,460 19,577<br />
Liabilities<br />
financial liabilities at fair value through profit or loss (6,<strong>11</strong>8) (6,<strong>11</strong>8)<br />
derivatives used for hedging (1,861) (1,861)<br />
Total liabilities (1,861) (6,<strong>11</strong>8) (7,979)<br />
Assets<br />
31.3.<strong>2010</strong><br />
financial assets at fair value through profit or loss 20,174 7,188 27,362<br />
Total assets 20,174 7,188 27,362<br />
Liabilities<br />
financial liabilities at fair value through profit or loss (3,919) (3,919)<br />
derivatives used for hedging (2,057) (2,057)<br />
Total liabilities (2,057) (3,919) (5,976)<br />
the following table presents the changes in level 3 financial instruments for the year ended march 31, 20<strong>11</strong> and <strong>2010</strong>:<br />
1,000 cHf <strong>2010</strong>/<strong>11</strong> 2009/10<br />
Balance april 1 3,269 5,286<br />
transfer into level 3 (4,325)<br />
Gains/(losses) recognized in profit or loss 398 (2,017)<br />
Balance March 31 (658) 3,269


