Monitoring emergency obstetric care
Monitoring emergency obstetric care
Monitoring emergency obstetric care

You also want an ePaper? Increase the reach of your titles
YUMPU automatically turns print PDFs into web optimized ePapers that Google loves.
<strong>Monitoring</strong><strong>emergency</strong> <strong>obstetric</strong> <strong>care</strong>a handbook
WHO Library Cataloguing-in-Publication Data :<strong>Monitoring</strong> <strong>emergency</strong> <strong>obstetric</strong> <strong>care</strong>: a handbook.1.Obstetrics - standards. 2.Emergency services, Hospital - statistics and numerical data. 3.Data collection - methods. 4.Quality indicators,Health <strong>care</strong>. 5.Maternal health services - supply and distribution. 6.Maternal mortality - prevention and control. 7.Handbooks. I.World HealthOrganization. II.United Nations Population Fund. III.UNICEF. IV.Mailman School of Public Health. Averting Maternal Death and Disability.ISBN 978 92 4 154773 4 (NLM classification: WA 310)© World Health Organization 2009All rights reserved. Publications of the World Health Organization can be obtained from WHO Press, World Health Organization, 20 AvenueAppia, 1211 Geneva 27, Switzerland (tel.: +41 22 791 3264; fax: +41 22 791 4857; e-mail: bookorders@who.int). Requests for permissionto reproduce or translate WHO publications – whether for sale or for noncommercial distribution – should be addressed to WHO Press, at theabove address (fax: +41 22 791 4806; e-mail: permissions@who.int).The designations employed and the presentation of the material in this publication do not imply the expression of any opinion whatsoeveron the part of the World Health Organization concerning the legal status of any country, territory, city or area or of its authorities, or concerningthe delimitation of its frontiers or boundaries. Dotted lines on maps represent approximate border lines for which there may not yet befull agreement.The mention of specific companies or of certain manufacturers’ products does not imply that they are endorsed or recommended by theWorld Health Organization in preference to others of a similar nature that are not mentioned. Errors and omissions excepted, the names ofproprietary products are distinguished by initial capital letters.All reasonable precautions have been taken by the World Health Organization to verify the information contained in this publication.However, the published material is being distributed without warranty of any kind, either expressed or implied. The responsibility for theinterpretation and use of the material lies with the reader. In no event shall the World Health Organization be liable for damages arisingfrom its use.Printed in France
ContentsAbbreviationsAcknowledgementsPrefaceExecutive summaryivvvivii1. INTRODUCTION 11.1 Overview of indicators 41.2 Signal functions of EmOC 61.3 Use of the EmOC indicators 92. INDICATORS FOR EmOC 102.1 Indicator 1: Availability of EmOC services 102.2 Indicator 2: Geographical distribution of EmOC facilities 132.3 Indicator 3: Proportion of all births in EmOC facilities 162.4 Indicator 4: Met need for EmOC 192.5 Indicator 5: Caesarean sections as a proportion of all births 252.6 Indicator 6: Direct <strong>obstetric</strong> case fatality rate 312.7 Indicator 7: Intrapartum and very early neonatal death rate 342.8 Indicator 8: Proportion of deaths due to indirect causes in EmOC facilities 362.9 Summary and interpretation of indicators 1–8 383. COLLECTING DATA FOR THE INDICATORS 433.1 Types of data required 433.2 Preparation 433.3 Form 1: All potential EmOC facilities in selected areas 463.4 Form 2: Review of EmOC at facilities 483.5 Form 3: Summary of data on EmOC facilities in an area 503.6 Form 4: Calculation of indicators for each area 513.7 Form 5: Calculation of indicators for the country 513.8 <strong>Monitoring</strong> at the area level 51REFERENCES 54APPENDIX A: Forms and worksheets for data collection and calculation of EmOC indicators 61Form 1. List of possible EmOC facilities 63Form 2. Review of possible EmOC facilities 69Form 3. Summary of data on EmOC facilities in the area 85Form 4. Calculation of indicators for geographical area 107Form 5. Calculation of indicators for a country 123APPENDIX B: Information on registers and data collection 145APPENDIX C: Random number table 151
iv<strong>Monitoring</strong> <strong>emergency</strong> <strong>obstetric</strong> <strong>care</strong>: a handbookAbbreviationsAMDDEmOCHIVUNFPAUNICEFWHOAverting Maternal Death and Disability ProgramEmergency Obstetric CareHuman immunodeficiency virusUnited Nations Population FundUnited Nations Children’s FundWorld Health Organization
<strong>Monitoring</strong> <strong>emergency</strong> <strong>obstetric</strong> <strong>care</strong>: a handbook 5vAcknowledgements<strong>Monitoring</strong> <strong>emergency</strong> <strong>obstetric</strong> <strong>care</strong>: a handbookwas prepared by Deborah Maine (Boston University,Boston, Massachusetts, United States of America,and the Averting Maternal Death and DisabilityProgram (AMDD), Mailman School of Public Health,Columbia University, New York City, New York, UnitedStates), Patsy Bailey (Family Health International,Research Triangle Park, North Carolina, UnitedStates, and AMDD), Samantha Lobis (AMDD) andJudith Fortney (AMDD).The handbook is based on the publication Guidelinesfor monitoring the availability and use of <strong>obstetric</strong>services (1997) prepared by Deborah Maine,Tessa Wardlaw (UNICEF) and a team from ColumbiaUniversity (Victoria Ward, James McCarthy, AmandaBirnbaum, Murat Alkalin and Jennifer Brown), and onrecommendations made during a technical consultationheld in 2006 at WHO in Geneva, in which thefollowing persons participated: Patsy Bailey (FamilyHealth International and AMDD), Shelah Bloom(University of North Carolina, Chapel Hill, NorthCarolina, United States), David Braunholtz (Initiativefor Maternal Mortality Programme Assessment(IMMPACT) Project, University of Aberdeen,Aberdeen, Scotland), Vincent de Brouwere (PrinceLeopold Institute of Tropical Medicine, Antwerp,Belgium), Marc Derveeuw (UNFPA), Hemant Dwivedi(UNFPA), Øystein Evjen Olsen (Institute for HealthResearch and Development and Primary Health Care,Iringa, United Republic of Tanzania), Vincent Fauveau(UNFPA), Judith Fortney (AMDD), Lynn Freedman(AMDD), Joan Healy (Ipas, Chapel Hill, NorthCarolina, United States) Justus Hofmeyr (Universityof the Witwatersrand, Johannesburg, South Africa),Samantha Lobis (AMDD), Deborah Maine (BostonUniversity, Boston, Massachusetts, United States,and AMDD), Saramma Mathai (UNFPA), AffetteMcCaw-Binns (University of the West Indies), IsabelleMoreira (UNFPA), Luwei Pearson (UNICEF), RosalindRaine (University College London, London, England),Geetha Rana (UNICEF), Judith Standley (UNICEF),Nancy Terreri (UNICEF), Kanako Yamashita-Allen(World Bank, Washington DC, United States), JelkaZupan (WHO), Katherine Ba-Thike (WHO), AlexisNtabona (WHO), Matthews Matthai (WHO).Lale Say (WHO) helped in revision of the handbook byfacilitating the technical consultation, reviewing draftversions, and coordinating the publishing process.Vincent Fauveau (UNFPA), Judith Standley (UNICEF)and Lynn Freedman (AMDD) reviewed many draftswithin their organizations. Jennifer Potts (AMDD)and Vincent de Brouwere reviewed several versionsand made substantive contributions to the text. YvesBergevin (UNFPA), Luc de Bernis (UNFPA), JulianaBol (RAISE Initiative, Columbia University, New YorkCity, New York, United States), Sara Casey (RAISEInitiative), France Donnay (UNFPA), Metin Gulmezoglu(WHO), Joan Healy (Ipas), Rita Kabra (WHO), BarbaraKwast (AMDD), Carine Ronsmans (London School ofHygiene and Tropical Medicine, London, England) andCynthia Stanton (Johns Hopkins Bloomberg School ofPublic Health, Baltimore, Maryland, United States) alsoreviewed the handbook. Lucy Anderson, AlexandraDelValle, Gina Gambone, Laura Harris, and ChristenMullen helped in compilation of the references. PaulVan Look reviewed the text.Conflict of interestThe participants of the technical consultation wereprimarily independent experts from academia. Noconflicts of interest were declared. Other participantsincluded staff from WHO, UNFPA, UNICEF, andColumbia University who have been engaged in incountryapplication of the indicators reviewed at theconsultation.
vi<strong>Monitoring</strong> <strong>emergency</strong> <strong>obstetric</strong> <strong>care</strong>: a handbookPrefaceEfforts to improve the lives of women and childrenaround the world have intensified since world leadersadopted the United Nations Millennium Declaration inSeptember 2000 and committed themselves to reachingMillennium Development Goals 4 and 5, on childmortality and maternal health. The original targets forthese Goals were a two-thirds reduction in the mortalityof children under 5 and a three-quarters reductionin the maternal mortality ratio between 1990 and 2015.There is worldwide consensus that, in order to reachthese targets, good-quality essential services must beintegrated into strong health systems. The addition in2007 of a new target in Goal 5—universal access toreproductive health by 2015—reinforces this consensus:all people should have access to essential maternal,newborn, child and reproductive health servicesprovided in a continuum of <strong>care</strong>.health <strong>care</strong> including family planning and delivery withthe help of a skilled health professional also playsan important role in reducing maternal and neonatalmortality, this handbook focuses on the critical roleof EmOC in saving the lives of women with <strong>obstetric</strong>complications during pregnancy and childbirth andsaving the lives of newborns intrapartum. The handbookdescribes indicators that can be used to assess,monitor and evaluate the availability, use and qualityof EmOC.Whilst this handbook focuses on <strong>emergency</strong> <strong>care</strong>,a broader set of indicators should be used to monitorfundamental aspects of reproductive health programmesdesigned to reduce maternal mortality,ensure universal access to reproductive health <strong>care</strong>and reduce child mortality.In order to reduce maternal mortality, EmergencyObstetric Care (EmOC) must be available and accessibleto all women. While all aspects of reproductive
7 This page has been left blank<strong>Monitoring</strong> <strong>emergency</strong> <strong>obstetric</strong> <strong>care</strong>: a handbook viiExecutive summaryReducing maternal mortality has arrived at the topof health and development agendas. To achieve theMillennium Development Goal of a 75% reduction inthe maternal mortality ratio between 1990 and 2015,countries throughout the world are investing moreenergy and resources into providing equitable, adequatematernal health services. One way of reducingmaternal mortality is by improving the availability,accessibility, quality and use of services for the treatmentof complications that arise during pregnancyand childbirth. These services are collectively knownas Emergency Obstetric Care (EmOC).Sound programmes for reducing maternal mortality,like all public health programmes, should have clearindicators in order to identify needs, monitor implementationand measure progress. In order to fulfilthese functions, the data used to construct the indicatorsshould be either already available or relativelyeasy and economical to obtain. The indicators shouldbe able to show progress over a relatively short time,in small as well as large areas. Most importantly, theindicators should provide clear guidance for programmes—showingwhich components are workingwell, which need more input or need to be changedand what additional research is needed.For a variety of technical and financial reasons, thematernal mortality ratio does not meet these requirements.Consequently, in 1991, UNICEF asked ColumbiaUniversity (New York City, New York, United States ofAmerica) to design a new set of indicators for EmOC.The first version was tested in 1992. In 1997, the indicatorswere published as Guidelines for monitoringthe availability and use of <strong>obstetric</strong> services, issued byUNICEF, WHO and UNFPA (1). These indicators havebeen used by ministries of health, international agenciesand programme managers in over 50 countriesaround the world.In June 2006, an international panel of experts participatedin a technical consultation in Geneva to discussmodifications to the existing indicators for EmOC andrevisions to the Guidelines, taking into account theaccumulated experience and increased knowledge inthe area of maternal health <strong>care</strong>. The present handbookcontains the agreed changes, including twonew indicators and an additional signal function, withupdated evidence and new resources. In addition,the Guidelines were renamed as the Handbook, toemphasize the practical purpose of this publication.The purpose of this handbook is to describe theindicators and to give guidance on conducting studiesto people working in the field. It includes a list oflife-saving services, or ‘signal functions’, that definea health facility with regard to its capacity to treat<strong>obstetric</strong> and newborn emergencies. The emphasis ison actual rather than theoretical functioning. On thebasis of the performance of life-saving services in thepast 3 months, facilities are categorized as ‘basic’ or‘comprehensive’. The section on signal functions alsoincludes answers to frequently asked questions.The EmOC indicators described in this handbook canbe used to measure progress in a programmatic continuum:from the availability of and access to EmOCto the use and quality of those services. The indicatorsaddress the following questions:• Are there enough facilities providing EmOC?• Are the facilities well distributed?• Are enough women using the facilities?• Are the right women (i.e. women with <strong>obstetric</strong>complications) using the facilities?• Are enough critical services being provided?• Is the quality of the services adequate?
viii<strong>Monitoring</strong> <strong>emergency</strong> <strong>obstetric</strong> <strong>care</strong>: a handbookThe handbook provides a description of each indicatorand how it is constructed and how it can be used;the minimum and/or maximum acceptable level (ifappropriate); the background of the indicator; datacollection and analysis; interpretation and presentationof the indicator; and suggestions for supplementarystudies. There is a further section on interpretationof the full set of indicators. Sample forms for data collectionand analysis are provided.Use of these EmOC indicators to assess needs canhelp programme planners to identify priorities andinterventions. Regular monitoring of the indicatorsalerts managers to areas in which advances havebeen made and those that need strengthening. Closeattention to the functioning of key services and programmescan substantially and rapidly reduce maternalmortality in developing countries.
<strong>Monitoring</strong> <strong>emergency</strong> <strong>obstetric</strong> <strong>care</strong>: a handbook 11. IntroductionOver the past two decades, the international communityhas repeatedly declared its commitment to reducethe high levels of maternal mortality in developingcountries, starting with the 1987 Safe MotherhoodConference in Nairobi, Kenya, followed by the 1990World Summit for Children at United Nations headquarters,the 1994 International Conference onPopulation and Development in Cairo, Egypt, the1995 Fourth World Conference on Women in Beijing,China, ‘Nairobi 10 Years On’ in Sri Lanka in 1997, andthe Millennium Development Goals established by theUnited Nations in 2000. In 2007, a number of eventsmarked the 20th anniversary of the launching of theSafe Motherhood Initiative, including the WomenDeliver Conference in London, England, at which callswere made for renewed commitment, programmesand monitoring. Most importantly, over the past 20years, consensus has been reached on the interventionsthat are priorities in reducing maternal mortality(2). Stakeholders agree that good-quality EmOCshould be universally available and accessible, that allwomen should deliver their infants in the presence ofa professional, skilled birth attendant, and that thesekey services should be integrated into health systems.It became clear early on, however, that it would notbe simple to measure progress in this area. Theconventional approach was to monitor the numberof maternal deaths with ‘impact’ indicators suchas the maternal mortality ratio. In theory, repeatedmeasurements of this ratio over time can be usedto monitor trends. This approach has a number ofserious drawbacks, both technical and substantive.Maternal mortality is extremely difficult and costlyto measure when vital registration systems areweak, and even when systems are strong (3). Eveninnovative methods present difficulties. For example,the direct ‘sisterhood’ method provides informationfor a reference period of 7 years before a survey; thus,the information gathered does not reflect the currentsituation or progress made recently. Recent advancesin sampling procedures for the sisterhood methodhave, however, greatly increased its efficiency andhave decreased costs. These changes allow for largersamples and consequently a shorter reference periodand narrower confidence intervals than the traditionalapproach. Even this method, however, is known togive underestimates of the maternal mortality ratio(4, 5).Another approach is use of ‘process,’ ‘output’ or‘outcome’ indicators, to measure the actions thatprevent deaths or illness. Widely used processindicators include rates of childhood immunization andcontraceptive prevalence. This handbook presents aseries of indicators designed to monitor interventionsthat reduce maternal mortality by improving theavailability, accessibility, use and quality of servicesfor the treatment of complications during pregnancyand childbirth. The indicators are based on informationfrom health facilities with data on population andbirth rates. There are several advantages to thisapproach. First, the indicators can be measuredrepeatedly at short intervals. Secondly, the indicatorsprovide information that is directly useful for guidingpolicies and programmes and making programmeadjustments. It is important to remember that although‘process,’ ‘output’ and ‘outcome’ indicators are moreuseful, practical and feasible than impact indicators,for many reasons, these measures cannot substitutefor maternal mortality ratios as a direct measure of theoverall level of maternal mortality in a population.The Guidelines for monitoring the availability and use of<strong>obstetric</strong> services were initially developed by ColumbiaUniversity’s School of Public Health, supported by andin collaboration with UNICEF and WHO. A draft versionwas issued in 1992, and the guidelines were formallypublished by UNICEF, WHO and UNFPA in 1997 (1).Since then, they have been used in many countries(Table 1). The present document is a revision of the1997 version of the guidelines, incorporating changesbased on monitoring and assessment conductedworldwide.The recommendations related to measuring theindicators were reviewed and updated on the basis ofexisting evidence, as well as experience in using theindicators within country programmes.These recommendations will be updated regularlyusing standard WHO procedures. It is expected thatthe next update will be in 2014.
2<strong>Monitoring</strong> <strong>emergency</strong> <strong>obstetric</strong> <strong>care</strong>: a handbookTable 1. Selected countries in which <strong>emergency</strong> <strong>obstetric</strong> <strong>care</strong> indicators were used in assessing needs or formonitoring and evaluation (2000–2007)Region and country Use of indicators ReferencesAfricaAngolaNational needs assessment (report in progress)Benin National needs assessment (6, 7)BurundiNeeds assessment planned with UNICEFCameroon Subnational needs assessment (8-10)Chad National needs assessment (7, 11)Comoros (12)Côte d’Ivoire National needs assessment (10, 13)Eritrea Needs assessment with partial coverage (14)EthiopiaProgramme monitoring and evaluation; needs assessment (15)with partial coverage 1Gabon National needs assessment (16, 17)Gambia National needs assessment (17, 18)Ghana Subnational needs assessment (19)Guinea Subnational needs assessment (20)Guinea Bissau National needs assessment (17, 21)Kenya Subnational needs assessments 2 (22-24)Lesotho National needs assessment (25)Madagascar Subnational needs assessments (26)MalawiNational needs assessment; programme monitoring and (27-30)evaluationMaliNational needs assessment; programme monitoring and (31, 32)evaluationMauritania National needs assessment (10, 33)MozambiqueNational needs assessment; programme monitoring and (34-37)evaluation (data not yet analysed)Namibia Needs assessment (38)Niger Needs assessment (10, 39)RwandaSubnational needs assessment; programme monitoring (15, 23, 39-42)and evaluationSenegal National needs assessment (10, 37, 43)Sierra Leone National needs assessment (44)Uganda National needs assessment (23, 45, 46)United Republic of Tanzania National needs assessment; programme monitoring and (15, 39, 47-51)evaluationZambia National needs assessment (52)Zimbabwe National needs assessment (53, 54)AmericasBolivia National needs assessment 3 (55, 56)Ecuador National needs assessment with UNFPA, 2006El Salvador National needs assessment (56-58)Guatemala Needs assessment (59)Honduras National needs assessment (56, 60)NicaraguaNational and subnational needs assessments; programme (61, 62)monitoring and evaluationPeruNeeds assessments with partial coverage; programme (63-65)monitoring and evaluation 4United States National needs assessment (66)
<strong>Monitoring</strong> <strong>emergency</strong> <strong>obstetric</strong> <strong>care</strong>: a handbook 3Region and country Use of indicators ReferencesEastern MediterraneanAfghanistan Needs assessments with partial coverage (67)Djibouti National needs assessment (68)IraqNeeds assessment plannedMoroccoNational needs assessment; programme monitoring and (62, 69)evaluationPakistanNeeds assessments with partial coverage; programme (70-73)monitoring and evaluationSomalia Subnational needs assessment (74)Sudan National needs assessment (23, 75)Syrian Arab Republic National needs assessment 5YemenNeeds assessments with partial coverageEuropeKyrgyzstan National needs assessment 6TajikistanNational needs assessment; programme monitoring and (76)evaluation 7South-East AsiaBangladeshNational and subnational needs assessments; programmemonitoring and evaluation(77-79)Bhutan Needs assessment; programme monitoring and evaluation (9, 80)IndiaNeeds assessments with partial coverage; programme (9, 81-85)monitoring and evaluationNepalSubnational needs assessment; programme monitoring (37, 86-88)and evaluationSri LankaSubnational needs assessment; programme monitoring (62, 89)and evaluationThailand Needs assessment with partial coverage (90)Western PacificCambodiaMongoliaViet NamPlannedPlannedNeeds assessment with partial coverage; programmemonitoring and evaluation(91, 92)1CARE. Unpublished data. 2000.2Doctors of the World. West Pokot facility needs assessment—maternal and newborn <strong>care</strong>. Unpublished data. Nairobi, 2007.3Engender Health Acquire Project. Unpublished data. 2007.4CARE. Unpublished data. 2004: Huancavelica region, Peru.5Ministry of Health and UNICEF, Unpublished data. 2004: Syria.6Ministry of Health of Kyrgyzstan and UNICEF, Status of Emergency Obstetric Care (EOC) in the Kyrgyz Republic. Unpublished. 2005.7Ministry of Health of Tajikistan and UNICEF, Unpublished data. Dushanbe, 2005.
4<strong>Monitoring</strong> <strong>emergency</strong> <strong>obstetric</strong> <strong>care</strong>: a handbookIn this new edition, the indicators have been revised toreflect 10 years’ wealth of experience. Other changesreflect the broadening of programmes; e.g. a signalfunction on treatment of complications in newbornsand new indicators on perinatal mortality and onmaternal deaths reported as due to indirect causes,such as HIV and malaria, have been added. Thesechanges were discussed and agreed by an internationalpanel of experts at the technical consultation inJune 2006 (93). During the review, it was also decidedto change the title. We use the term ‘handbook’ ratherthan ‘guidelines,’ because ‘handbook’ reflects moreaccurately the practical nature of this document.Another change made in this edition is replacement of‘essential <strong>obstetric</strong> <strong>care</strong>’ by ‘EmOC’. 1 Over the years,the terminology has been adjusted so that the indicatorsrelate specifically to treatment of the <strong>emergency</strong><strong>obstetric</strong> complications that cause most maternaldeaths.This handbook includes an explanation of the currentindicators for EmOC and their implications, suggestssupplementary studies that can improve understandingof the situation in a given area, and provides answersto common questions that arise when using theindicators. This is followed by worksheets and tablesto illustrate study questions and calculations.The indicators described can be used at any stage ofthe design and implementation of EmOC programmesand can be incorporated into routine healthmanagement information systems. In many countries,these indicators have provided the framework for moredetailed assessments of national needs for EmOC,establishing the availability, use and quality of servicesand the specific information needed for detailedprogramme planning, such as equipment inventories. 2Modules for conducting needs assessments can befound at: www.amddprogram.org.1‘Emergency <strong>obstetric</strong> <strong>care</strong>’ or ‘EmOC’ is being used in thisdocument rather than ‘<strong>emergency</strong> <strong>obstetric</strong> and newborn <strong>care</strong>’or ‘EmONC’ because this set of indicators focus primarily on<strong>obstetric</strong> complications and procedures. While there is one newsignal function on neonatal resuscitation and one new indicator onintrapartum <strong>care</strong> from the perspective of the newborn, the set ofindicators do not represent the full range of <strong>emergency</strong> newbornprocedures.2These assessments also include more information on <strong>emergency</strong>newborn <strong>care</strong>, and are often called EmONC needs assessments.1.1 Overview of indicatorsIn the sections below, we present a series of indicatorsfor monitoring progress in the prevention of maternaland perinatal deaths. Their order is based on the logicthat, for women to receive prompt, adequate treatmentfor complications of pregnancy and childbirth, facilitiesfor providing EmOC must:• exist and function,• be geographically and equitably distributed,• be used by pregnant women,• be used by women with complications,• provide sufficient life-saving services, and• provide good-quality <strong>care</strong>.Thus, the indicators answer the following questions:• Are there enough facilities providing EmOC?• Are the facilities well distributed?• Are enough women using the facilities?• Are the right women using the facilities?• Are enough critical services being provided?• Is the quality of services adequate?The first indicator therefore focuses on the availabilityof EmOC services. Adequate coverage means that allpregnant women have access to functioning facilities.Once availability is established, questions of usecan be addressed. Even if services are functioning,if women with complications do not use them (forwhatever reason), their lives are in danger. Finally, theindicators cover the performance of health services.After all, many women die in hospital: some of them diebecause they were not admitted until their conditionwas critical; many others, however, die because theydid not receive timely treatment at a health facility orbecause the treatment they received was inadequate.Table 2 shows the six EmOC indicators issued in 1997,with some minor modifications suggested by the 2006technical consultation on the basis of the participants’expertise and experience in various countries:
<strong>Monitoring</strong> <strong>emergency</strong> <strong>obstetric</strong> <strong>care</strong>: a handbook 5• The recommendation for the mixture of basicand comprehensive EmOC facilities per 500 000population has been changed from ‘at least onecomprehensive and four basic EmOC facilities per500 000 population’ to ‘at least five EmOC facilitiesincluding at least one comprehensive facilityper 500 000 population’.• The minimum acceptable level for indicator 3 wasremoved, and countries are advised to use theirown targets.• The name of indicator 6 has been updated from:‘case fatality rate’ to ‘direct <strong>obstetric</strong> case fatalityrate’.Table 2. The original six <strong>emergency</strong> <strong>obstetric</strong> <strong>care</strong> indicators, with modificationsIndicator1. Availability of <strong>emergency</strong> <strong>obstetric</strong> <strong>care</strong>: basic andcomprehensive <strong>care</strong> facilities2. Geographical distribution of <strong>emergency</strong> <strong>obstetric</strong><strong>care</strong> facilities3. Proportion of all births in <strong>emergency</strong> <strong>obstetric</strong> <strong>care</strong>facilities a4. Meeting the need for <strong>emergency</strong> <strong>obstetric</strong> <strong>care</strong>:proportion of women with major direct <strong>obstetric</strong>complications who are treated in such facilities aAcceptable levelThere are at least five <strong>emergency</strong> <strong>obstetric</strong> <strong>care</strong>facilities (including at least one comprehensive facility)for every 500 000 populationAll subnational areas have at least five <strong>emergency</strong><strong>obstetric</strong> <strong>care</strong> facilities (including at least onecomprehensive facility) for every 500 000 population(Minimum acceptable level to be set locally)100% of women estimated to have major direct<strong>obstetric</strong> complications b are treated in <strong>emergency</strong><strong>obstetric</strong> <strong>care</strong> facilities5. Caesarean sections as a proportion of all births a The estimated proportion of births by caesareansection in the population is not less than 5% or morethan 15% c6. Direct <strong>obstetric</strong> case fatality rate a The case fatality rate among women with direct<strong>obstetric</strong> complications in <strong>emergency</strong> <strong>obstetric</strong> <strong>care</strong>facilities is less than 1%Adapted from reference (1).aWhile these indicators focus on services provided in facilities that meet certain conditions (and therefore qualify as ‘<strong>emergency</strong><strong>obstetric</strong> <strong>care</strong> facilities’), we strongly recommend that these indicators be calculated again with data from all maternity facilities in thearea even if they do not qualify as <strong>emergency</strong> <strong>obstetric</strong> <strong>care</strong> facilities.bThe proportion of major direct <strong>obstetric</strong> complications throughout pregnancy, delivery and immediately postpartum is estimated to be15% of expected births.cSee section 2.5 for a discussion of this range.These indicators refer to the availability and use offacilities and the performance of health-<strong>care</strong> systemsin saving the lives of women with <strong>obstetric</strong> complications.The acceptable levels of most of the indicatorsare specified as minimum and/or maximum and arenecessarily approximate. They are based on the bestdata, estimates, and assumptions currently available.The acceptable levels can be adapted according tocountries’ circumstances; however, if they are modified,it is important to report the findings in relation tothe standard levels suggested here, so that the resultscan be compared with those from other studies.These indicators can be used to set priorities for programmesas well as to monitor them. Programmeplanners and managers responsible for reducing thenumber of maternal deaths can start at the top of thelist and work down. When they reach an indicator forwhich the country does not meet the acceptable level,appropriate interventions are needed. For example, ifa country meets the acceptable levels for the numberand distribution of EmOC facilities but not fortheir use, interventions are needed to understand andimprove use.
6<strong>Monitoring</strong> <strong>emergency</strong> <strong>obstetric</strong> <strong>care</strong>: a handbookTable 3 sets out two new indicators that were adoptedat the 2006 technical consultation on the guidelines.These reflect the evolution of the maternal health field:indicator 7 reflects the renewed focus on the quality of<strong>obstetric</strong> <strong>care</strong> and the association between maternaland neonatal health, and indicator 8 reflects indirectcauses of maternal deaths in some countries, such asmalaria.Table 3. New indicators for <strong>emergency</strong> <strong>obstetric</strong> <strong>care</strong>IndicatorAcceptable level7. Intrapartum and very early neonatal death rate Standards to be determined8. Proportion of maternal deaths due to indirectcauses in <strong>emergency</strong> <strong>obstetric</strong> <strong>care</strong> facilitiesNo standard can be setThese indicators should also be calculated with data for all facilities in the area, if possible.1.2 Signal functions of EmOCFor the purposes of assessing and monitoring the levelof <strong>care</strong> that a facility is actually providing, it is helpfulto use a short list of clearly defined ‘signal functions’.These are key medical interventions that are used totreat the direct <strong>obstetric</strong> complications that cause thevast majority of maternal deaths around the globe. Thelist of signal functions does not include every servicethat ought to be provided to women with complicatedpregnancies or to pregnant women and their newbornsin general; that information is provided in otherpublications (94-96). The signal functions are indicatorsof the level of <strong>care</strong> being provided. Furthermore,some critical services are subsumed within these signalfunctions. For example, if caesarean sections areperformed in a facility, this implies that anaesthesia isbeing provided. While the signal functions are usedto classify facilities on the basis that these functionshave been performed in the past 3 months, it is helpfulto use a more inclusive list of functions and supplieswhen assessing need for EmOC in order to plan programmes.The list of signal functions in this edition of the handbookhas been updated with the addition of the newfunction: ‘perform neonatal resuscitation’ at basic andcomprehensive levels. In addition, the name of the secondsignal function has been changed from ‘administerparenteral oxytocics’ to ‘administer uterotonicdrugs’. The list of signal functions in Table 4 includesa few examples of drugs or equipment that could beused when performing the signal functions; however,the drugs and procedures mentioned are illustrativeand not exhaustive. For a complete list of recommendedprocedures and drugs, please refer to WHO’sManaging complications in pregnancy and childbirth:a guide for midwives and doctors (95) and Managingnewborn problems: a guide for doctors, nurses andmidwives (96).
<strong>Monitoring</strong> <strong>emergency</strong> <strong>obstetric</strong> <strong>care</strong>: a handbook 7Table 4. Signal functions used to identify basic and comprehensive <strong>emergency</strong> <strong>obstetric</strong> <strong>care</strong> servicesBasic servicesComprehensive services(1) Administer parenteral 1 antibiotics Perform signal functions 1–7, plus:(2) Administer uterotonic drugs (i.e., parenteraloxytocin 2 )(3) Administer parenteral anticonvulsants for preeclampsiaand eclampsia (i.e., magnesium sulfate).(8) Perform surgery (e.g., caesarean section)(9) Perform blood transfusion(4) Manually remove the placenta(5) Remove retained products (e.g. manual vacuumextraction, dilation and curettage)6) Perform assisted vaginal delivery (e.g. vacuumextraction, forceps delivery)(7) Perform basic neonatal resuscitation (e.g., withbag and mask)A basic <strong>emergency</strong> <strong>obstetric</strong> <strong>care</strong> facility is one in which all functions 1–7 are performed.A comprehensive <strong>emergency</strong> <strong>obstetric</strong> <strong>care</strong> facility is one in which all functions 1–9 are performed.Please refer to the following websites for recommended procedures for each signal function listed above:- Managing complications in pregnancy and childbirth: a guide for midwives and doctors:http://www.who.int/making_pregnancy_safer/documents/9241545879/en/index.html- Cochrane reviews: http://www.cochrane.org/reviewsAdapted from reference (1).1 Injection or intravenous infusion.2 A recent WHO technical consultation (November 2008) to develop guidelines for interventions for postpartum haemorrhage,reviewed all available evidence, and identified parenteral oxytocin as the recommended choice of drug for prevention of post-partumhaemorrhage. Ergometrin (second line) and misoprostol (third line) as options that could only be used where oxytocin is not available.Oxytocin should therefore be available in facilities to be defined as an EmOC facility.Table 5 shows which signal functions are used to treat the major direct <strong>obstetric</strong> complications that causemost maternal deaths. Box 1 lists a number of questions frequently asked about the signal functions, with theiranswers.Table 5. Signal functions and related complicationsMajor <strong>obstetric</strong> complicationHaemorrhageProlonged or obstructed labourPostpartum sepsisSignal functionAntepartum:Perform blood transfusionPerform surgery (e.g., caesarean section for placenta praevia)Postpartum:Administer uterotonic drugsPerform blood transfusionPerform manual removal of placentaPerform removal of retained productsPerform surgery (hysterectomy) for uterine rupturePerform assisted vaginal deliveryPerform surgery (caesarean section)Administer uterotonic drugsPerform neonatal resuscitationAdminister parenteral antibioticsRemove retained productsPerform surgery for pelvic abscess
8<strong>Monitoring</strong> <strong>emergency</strong> <strong>obstetric</strong> <strong>care</strong>: a handbookMajor <strong>obstetric</strong> complicationComplications of abortionPre-eclampsia or eclampsiaEctopic pregnancyRuptured uterusNewborn distress (intrapartum)Signal functionFor haemorrhage:Perform blood transfusionRemove retained productsFor sepsis:Administer parenteral antibioticsRemove retained productsFor intra-abdominal injury:Administer parenteral antibioticsPerform blood transfusionPerform surgeryAdminister parenteral anticonvulsantsPerform neonatal resuscitationPerform surgery (caesarean section)Perform surgeryPerform blood transfusionPerform surgeryPerform blood transfusionAdminister parenteral antibioticsPerform newborn resuscitationPerform surgery (caesarean section)Adapted from reference (97).Box 1. Frequently asked questions about signal functions• Why use parenteral administration, rather than oral? In an <strong>emergency</strong>, there must be a quick physiologicalresponse to antibiotics when needed. In addition, the key life-saving drugs for main complications can onlybe administered parenteral. Therefore, the definition specifies parenteral rather than oral administration.• Why were these items selected as signal functions and not others? Other items have been discussed assignal functions, such as use of the partograph, active management of the third stage of labour, availabilityof services 24 h/day, 7 days/week, intravenous fluids, anaesthesia and plasma expanders. Use of the partographand active management of the third stage of labour are both part of good <strong>obstetric</strong> practice andshould be used for all women in labour to prevent prolonged, obstructed labour and its sequelae, such as<strong>obstetric</strong> fistula. Availability of services 24 h/day, 7 days/week is a function of management and planningrather than a life-saving skill. Intravenous fluids are implicit in the signal functions that require parenteraldrugs. Anaesthesia and plasma expanders are also implicit in the availability of <strong>obstetric</strong> surgery, e.g. caesareansection. Although the eight original <strong>obstetric</strong> signal functions do not form an exhaustive list, theywere chosen because of the role they play in the treatment of the five major causes of maternal death.• Where can I obtain a more complete list of functions and equipment for maternal and newborn health? Thewebsites of WHO (http://www.who.int/reproductive-health/publications/pcpnc/) (98), the Johns HopkinsProgram for International Education in Gynecology and Obstetrics (http://www.jhpiego.org/scripts/pubs/category_detail.asp?category_id=24) (99) and AMDD (http://www.amddprogram.org/resources/DesignEvalMM-EN.pdf) (100) provide links to manuals with more complete inventories of drugs, suppliesand equipment for health centres and hospitals.
<strong>Monitoring</strong> <strong>emergency</strong> <strong>obstetric</strong> <strong>care</strong>: a handbook 9• Why don’t the signal functions include specific drugs or equipment? We hope that international standardsof <strong>care</strong> will be used to determine in practice which drugs and types of equipment are used to perform thesignal functions. These standards are dynamic and can change over long periods with technological progress.We encourage use of the WHO guidelines of <strong>care</strong>, the Reproductive Health Library (http://www.who.int/rhl), the Cochrane Collaboration systematic reviews and other international resources. The list of signalfunctions in Table 4 does include a few examples of drugs or equipment that could be used, but the list ofoptions is not exhaustive.• Why use the 3–month reference period as opposed to a longer time? The 3–month reference period waschosen because it provides a snapshot of the current functioning of a facility. It was also selected becauserecall is less accurate over longer periods and because skills (such as vaginal delivery with a vacuum extractor,caesarean section or manual removal of the placenta) are more likely to be maintained if they are usedfrequently. <strong>Monitoring</strong> the delivery of services and stock outs are considerations for health service planners• What should we do when a facility that is being monitored provides basic or comprehensive <strong>emergency</strong><strong>obstetric</strong> <strong>care</strong> irregularly because of one or two missing signal functions? This is not a problem in a facilitybasedsurvey or a needs assessment, as the technical guideline is to assess the performance of the signalfunctions in the most recent 3–month period. It becomes an issue when monitoring <strong>emergency</strong> <strong>obstetric</strong><strong>care</strong> status over time. It is not uncommon for a facility to change its status when it has a small caseload orfrequent staff turnover. For pragmatic and programmatic reasons in regional or national monitoring, we recommendannual reclassification. District managers can monitor their own performance more frequently andshould be encouraged to do so in order to assess their functioning and to provide data for decision-makingto improve services.• What do we do if a signal function is performed during the 3–month reference period but not in an <strong>obstetric</strong>context? Most of the signal functions are likely to be performed only in an <strong>obstetric</strong> context, but parenteralantibiotics or anticonvulsants and blood transfusions can be administered in other contexts. In an assessmentof an institution’s capacity and performance for delivering <strong>emergency</strong> <strong>obstetric</strong> <strong>care</strong>, the signal functionsshould have been performed in an <strong>obstetric</strong> context.1.3 Use of the EmOC indicatorsAs shown in Table 1, the indicators for EmOC havebeen used in more than 50 countries to plan programmesand to monitor and evaluate progress inreducing maternal mortality. Some countries haveconducted more detailed needs assessments thatalso include other indicators and information usefulfor planning safe motherhood programmes. (Forsample data collection forms, refer to: http://www.amddprogram.org/). In other countries, more focusedneeds assessments have been conducted, data collectionbeing limited to the indicators on forms similarto those in Appendix A. The more focused componentsof needs assessments described in this handbookcan be integrated into needs assessments forother health issues, such as prevention of mother-tochildtransmission of HIV infection, or for a health systemoverall. Regardless of whether the EmOC needsassessment is more detailed or more focused, it willyield data that can be used to monitor and evaluateprogress in reducing maternal mortality and providevaluable information for health ministries and healthmanagers to shape strategies and activities to improvematernal health outcomes.In more and more countries, the EmOC indicators havebeen integrated into routine health management informationsystems to track progress at district, regionaland national levels. While periodic needs assessmentsand data collection systems set up outside health managementinformation systems may play an importantrole, integration of the EmOC indicators into healthmanagement information systems is a more efficientway of monitoring the availability and use of such <strong>care</strong>over time. Countries that are intent on reducing maternalmortality should strive to include these indicatorsinto their health management information systems.
102. Indicators for EmOCBelow, the explanation of each EmOC indicatorincludes a description, the recommended minimumor maximum acceptable level (if appropriate), backgroundinformation, advice on data collection, analysis,interpretation and presentation, and suggestionsfor supplementary studies related to the indicator.Worksheets are provided in Appendix A to facilitatethe calculations.2.1 Indicator 1: Availability of EmOCservicesDescriptionThe availability of EmOC services is measured by thenumber of facilities that perform the complete set ofsignal functions in relation to the size of the population.When staff has carried out the seven signal functionsof basic EmOC in the 3-month period beforethe assessment, the facility is considered to be a fullyfunctioning basic facility. The facility is classified asfunctioning at the comprehensive level when it offersthe seven signal functions plus surgery (e.g. caesarean)and blood transfusion (Table 4).To determine the minimum acceptable number of basicand comprehensive EmOC facilities for a country orregion (depending on the scope of the assessment),begin by dividing the total population by 500 000. Thisis the minimum acceptable number of comprehensivefacilities. Then, multiply that number by 5 to calculatethe overall minimum number of facilities, both basicand comprehensive. These numbers should be comparedwith the actual number of facilities found inorder to classify the services as fully functioning basicor comprehensive.The results of this exercise can also be expressed asa percentage of the minimum acceptable number ofbasic or comprehensive <strong>care</strong> facilities. To calculatethe percentage of the recommended minimum numberof facilities that is actually available to the population,divide the number of existing facilities by therecommended number and multiply by 100. A similarexercise will determine what percentage of the recommendedminimum number of comprehensive facilitiesis available.Minimum acceptable levelFor every 500 000 population, the minimum acceptablelevel is five EmOC facilities, at least one of whichprovides comprehensive <strong>care</strong>.Background and discussionTo save women with <strong>obstetric</strong> complications, thehealth system must have facilities that are equipped,staffed and actually provide EmOC. The compositenature of this indicator tells us not only whether thesignal functions were performed recently; it also indirectlytells us about the availability of equipment anddrugs and the availability and skill of the staff.The number of EmOC facilities required to treat complicationsdepends on where facilities are located,where people live and the size and capabilities of thefacilities. One could count only facilities where all nineEmOC procedures are performed, but that would givethe wrong message, implying that only hospitals withsophisticated equipment and specialist physicianscan reduce maternal mortality. A promising interventionis the upgrading of health centres and other smallfacilities to enable them to provide basic EmOC (36,65). The ‘health centre intrapartum <strong>care</strong> strategy’,proposed in the Lancet series on maternal health,suggests that all births take place in a facility; this islikely to be one of the more cost-efficient strategies forreducing maternal mortality, provided that the qualityof <strong>care</strong> is adequate (101).A health centre that provides basic EmOC can preventmany maternal and perinatal deaths. For someconditions (e.g. some cases of postpartum haemorrhage),basic <strong>care</strong> will be sufficient. For other complications(e.g. obstructed labour), higher-level treatmentis required. Even then, first aid can save lives,because a woman’s condition can be stabilized beforeshe is referred. For example, a woman with obstructedlabour cannot be treated in a health centre that providesonly basic <strong>care</strong>: she needs a caesarean section.
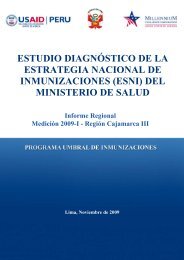
12<strong>Monitoring</strong> <strong>emergency</strong> <strong>obstetric</strong> <strong>care</strong>: a handbookThe minimum acceptable level for Indicator 1 hasbeen defined in relation to the population rather thanbirths because most health planning is based on populationsize. If, however, it is judged more appropriateto assess the adequacy of EmOC services in relationto births, the comparable minimum acceptable levelwould be five facilities for every 20 000 annual births(including at least one comprehensive facility).If a country has a mix of public and private facilities, adecision must be made about whether to collect datafrom all of them or to focus on one sector (generallythe public sector). Only by including the private sector,however, will there be a complete picture of how wellthe health system functions and the overall levels ofavailability, use and quality of <strong>care</strong>. Because the indicatorsare based on population estimates (total population,for example), it makes sense that all health facilities(or a representative sample) be selected for theassessment. The more a country relies on private facilitiesfor EmOC, the more important it is to include theprivate sector. As an illustration of this point, a needsassessment conducted in Benin in 2003 showed thatone fourth of facilities providing comprehensive EmOCand almost all the facilities functioning at the basiclevel were privately operated (7).Interpretation and presentationIf, in the aggregate, a country or region does not havefive EmOC facilities (including at least one comprehensivefacility) per 500 000 population, the overall minimumacceptable level of EmOC services is not met.In this case, a high priority is to increase the numberof functioning facilities until at least the minimum levelis met. This may be done in different ways, e.g. byupgrading existing facilities or building new facilities,or some combination of the two.If the overall minimum acceptable level of EmOC servicesis met, it is reasonable to conclude that, in theaggregate, an acceptable minimum number of facilitiescurrently exists. The next step would be to look at thegeographical distribution of the facilities (Indicator 2).We strongly recommend that, in addition to lookingat the ratio of facilities to population, data on performanceof the signal functions be presented in termsof the proportion of facilities providing each of the signalfunctions, as illustrated in Figure 1. Such data areextremely useful for planning and setting priorities forinterventions. Figure 1 shows that in Benin in 2003, notall hospitals that provided <strong>obstetric</strong> surgery also hadthe capacity to transfuse blood. Furthermore, only 9%of health centres but almost 90% of hospitals removedretained products. Today, manual vacuum aspirationis often used to treat complications of abortion bymid-level professionals at health centres and districthospitals (103). This procedure reduces the need forreferral, which often entails considerable expense forthe family, life-threatening delays and even deaths.In some countries certain signal functions are virtuallymissing because they are not included in pre-servicetraining of health personnel or national treatment protocols.If a signal function is systematically absentin a country, it is possible to use the designation‘Comprehensive minus 1’ or ‘Basic minus 1’ as a temporarymeasure, while policies are reviewed and programmaticinterventions planned to remedy the lack.Supplementary studiesReasons for not performing signal functionsThere are a number of possible reasons that a healthcentre or small hospital does not qualify as a basicEmOC facility. Very often, it is the result of somemanagement problem. When determining a facility’sEmOC status, consider the following for each signalfunction:• Is staff at the facility trained and confident in theirskills to perform the service?• Are the cadres of staff working at the facility orthe facility itself authorized to perform the signalfunction?• Are the requisite supplies and equipment in placeand functioning?• Were there cases for which the use of a particularsignal function was indicated?
<strong>Monitoring</strong> <strong>emergency</strong> <strong>obstetric</strong> <strong>care</strong>: a handbook 13Figure 1. Proportion of health facilities in which each signal function was performed during the past 3 months,Benin, 2003Cesarean delivery0%88%Blood transfusion0%81%Assisted vaginal delivery2%58%Removal of retained products9%88%Manual removal of placenta59%92%Parenteral anticonvulsants86%98%Parenteral oxytocics78%96%Parenteral antibiotics86%100%0%10%20% 30%40% 50% 60% 70% 80% 90% 100%Hospitals (N=48)Health Centres (N=234)From Ministère de la Santé Publique du Bénin, 2003, cited in references (6, 104)The last explanation refers to the fact that a facility mayhave a low caseload, with the result that there mighthave been no need for one of the signal functions duringthe 3-month period. The question of case load, inturn, could be investigated by determining whether thecatchment population is too small given the incidenceof the complication in question, if access is a seriousproblem for reasons related to information, cost, distance,transport or cultural practices, or if bypassingthis facility for another, better-functioning facility iscommon practice.When data on signal functions are presented as shownin Figure 1, it may be possible to see a pattern at thecountry or district level, e.g. whether a particular signalfunction is not being performed. It would be useful toenquire further, for example by discussing the issuewith facility staff to learn what they perceive the problemsto be. That will not elucidate why women use ordo not use a particular facility; that kind of informationcan be derived only from women in the community.Focus groups are often used to collect this kind ofinformation. Community surveys might also be informative,but they are more difficult and expensive toconduct than focus groups.2.2 Indicator 2: Geographical distributionof EmOC facilitiesDescriptionThe second indicator is calculated in the same way asthe first, but it takes into consideration the geographicaldistribution and accessibility of facilities. It canhelp programme planners to gather information aboutequity in access to services at subnational level.To determine the minimum acceptable number ofbasic and comprehensive facilities, begin by dividingthe subnational (e.g. provinces, states or districts)population by 500 000. This will give you the minimumacceptable number of comprehensive EmOCfacilities for the subnational area. Then, multiply thatnumber by 5 to calculate the overall minimum numberof facilities, both basic and comprehensive, for thesubnational area. To calculate the percentage of therecommended minimum number of facilities that isactually available to the subnational population, dividethe number of functioning EmOC facilities by the recommendednumber and multiply by 100. A similarexercise will determine what percentage of the recommendedminimum number of comprehensive EmOCfacilities is available.
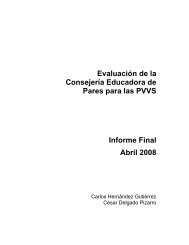
14<strong>Monitoring</strong> <strong>emergency</strong> <strong>obstetric</strong> <strong>care</strong>: a handbookTo determine the percentage of subnational areasthat have the recommended number of EmOC facilities(including the minimum number of comprehensivefacilities) for their population size, the number of subnationalareas with the recommended minimum numberis divided by the number of subnational areas andmultiplied by 100.Minimum acceptable levelTo ensure equity and access, 100% of subnationalareas should have the minimum acceptable numbersof EmOC facilities or at least five facilities (including atleast one comprehensive facility) per 500 000 population.Background and discussionFacilities that offer EmOC must be distributed sothat women can reach them. If facilities are clusteredaround a capital city or only in large commercial centres,women in more remote regions will experiencedelay in getting treatment, which might threaten theirsurvival and the survival of their newborns. Table 6shows the estimated average time from onset of themajor <strong>obstetric</strong> complications to death. It can be seenthat the average time to death is 12 hours or more,although postpartum haemorrhage can kill faster.Therefore, lives could be saved at rural health facilitieswith injectable uterotonics and rehydration with intravenousfluids.Table 6. Estimated average interval between onsetof major <strong>obstetric</strong> complications and death, in theabsence of medical interventionsIn view of the urgency of maternal complications,EmOC services must be distributed throughout acountry. The distribution can be checked efficientlyby calculating the number of facilities available insubnational areas. An analysis at regional, state, provincial,district or other level often reveals discrepanciesin health services equity. The ratio of EmOCfacilities to the total population is often higher than forsmaller geographical areas. In Nicaragua in 2001, forinstance, the coverage of the combined populationsof nine administrative regions with comprehensiveEmOC facilities more than met the required minimum(225%). When the regions were examined individually,however, only four had the minimum acceptable levelof comprehensive <strong>care</strong> (102). A needs assessment inMauritania in 2000 showed that the number and distributionof facilities providing EmOC were both insufficient.Only eight of the 67 facilities surveyed providedsuch <strong>care</strong> (seven provided comprehensive <strong>care</strong>and one provided basic <strong>care</strong>). More than half of allthe comprehensive EmOC facilities were in the capitalcity, Nouakchott, and 9 of 13 regions had no facilities(105).In some situations, especially where the population iswidely dispersed and travel is difficult, it may be advisablefor governments to exceed the minimum acceptablelevel. In Bhutan, for example, an assessment ofneeds for EmOC revealed problems in the geographicaldistribution of facilities, and the Governmentpromptly upgraded facilities to improve the availabilityof <strong>care</strong> (Figure 2).Complication Hours DaysHaemorrhage• Postpartum• Antepartum212Ruptured uterus 1Eclampsia 2Obstructed labour 3Infection 6From Maine, D. Prevention of Maternal Deaths in DevelopingCountries: Program Options and Practical Considerations, inInternational Safe Motherhood Conference. 1987. Unpublisheddata: Nairobi.
<strong>Monitoring</strong> <strong>emergency</strong> <strong>obstetric</strong> <strong>care</strong>: a handbook 15Figure 2. Emergency <strong>obstetric</strong> <strong>care</strong> facilities in BhutanGasaPunakhaBumthangLhuentseTrashiYangtseHaaParoThimphuWangduePhodrangTrongsaMongarTrashigangSamtseChukhaPhuentsholingDaganaTsirangSarpangZhemgangPemagatshelResirbooSamdrupJongkhaComprehensive EmOC centres – 4Basic EmOC centres – 4From UNICEF, Department of Health Services, and Ministry of Health and Education. Semi-annual reports to AMDD, Jan–June 2002 &July–Dec 2002. Unpublished data. 2002: Bhutan, cited in reference (104).
16<strong>Monitoring</strong> <strong>emergency</strong> <strong>obstetric</strong> <strong>care</strong>: a handbookData collection and analysisMany of the same issues in data collection that existfor Indicator 1 are also relevant for Indicator 2. Oneissue is, however, more likely to arise in subnationalthan in national coverage: How many and what typeof EmOC facilities are recommended for populationssmaller than 500 000? No one answer fits all situations,but ‘prorating’ would be advised, e.g. if thepopulation is close to 250 000, three facilities wouldbe acceptable (rounding up is the more conservativeresponse). Whether one of the three should be comprehensivedepends on the location and proximity(distance in terms of time) of comprehensive facilitiesin neighbouring areas.Emergency <strong>obstetric</strong> <strong>care</strong> facilities in subnationalareas can also be stratified by management, to determinethe distribution of public and private facilities.This analysis can be particularly revealing in an areawith private but no government facilities, where governmentfacilities offer free services and private facilitiescharge user fees, or where government facilitiescharge and mission hospitals are free.Interpretation and presentationIf subnational geographical areas do not meet theminimum acceptable ratio, underserved areas shouldbe targeted and resources devoted to improving theavailability of services.The numbers of comprehensive and basic EmOCfacilities per subnational population can be presentedin either tables or maps on which subnational areasare shaded according to the level of coverage (100%or more and at increments of less than 100%).Supplementary studyIndicators of access to EmOC include distance andtime. As digital mapping and geographical informationsystems become more widely available, use ofthis indicator is likely to increase. A reasonable standardfor the availability of services can be established,such as having basic and comprehensive facilitiesavailable within 2–3 hours of travel for most women. Inthe past, determining the distance between facilitiesand where people live was cumbersome; however,geographical information systems make calculationsof distance and travel time much easier, and measurementmethods will become more consistent (106).Maps that show the EmOC status of facilities, the distanceof communities from basic and comprehensivefacilities (both in travel time and in relation to road networks),population dispersion and density and otherfeatures that show inequities in terms of access to<strong>care</strong> can be effective advocacy and planning tools.2.3 Indicator 3: Proportion of all births inEmOC facilitiesDescriptionIndicator 3 is the proportion of all births in an area thattake place in EmOC health facilities (basic or comprehensive).The numerator is the number of womenregistered as having given birth in facilities classifiedas EmOC facilities. The denominator is an estimate ofall the live births expected in the area, regardless ofwhere the birth takes place.We strongly recommend a parallel indicator: the proportionof births in all health facilities in the area, or‘institutional births’ or ‘institutional deliveries’. We recommendthis in order to give a more complete pictureof the patterns of use of the health system (seeFigure 3). The numerator is always service statisticsfor deliveries in the facilities, while the denominator—the expected number of live births—is usually calculatedfrom the best available data and by multiplyingthe total population of the area by the crude birth rateof the same area. Other methods for calculating theexpected number of live births can also be used.Minimum acceptable levelNo minimum acceptable level is proposed. In the previousedition of this handbook, the minimum acceptablelevel was set at 15% of expected births. In theintervening years, many governments have committedthemselves to increasing the proportion of womenwho give birth in health facilities, and some are aimingfor 100%. Therefore, the minimum target for this indicatorshould be set by national or local governments.
<strong>Monitoring</strong> <strong>emergency</strong> <strong>obstetric</strong> <strong>care</strong>: a handbook 17BackgroundIndicator 3 was originally proposed to determinewhether women are using the EmOC facilities identifiedby indicators 1 (Availability of EmOC services) and2 (Geographical distribution of EmOC facilities), and itserves as a crude indicator of the use of <strong>obstetric</strong> servicesby pregnant women. In situations where recordsystems are inadequate to collect data for Indicator 4(Met need for EmOC), the number of women givingbirth in health facilities is almost always available. Useof these data can give administrators a rough idea ofthe extent to which pregnant women are using thehealth system, especially when combined with informationon which facilities provide EmOC.The optimal long-term objective is that all births takeplace in (or very near to) health facilities in which<strong>obstetric</strong> complications can be treated when theyarise. Many countries have made having 100% ofdeliveries in institutions their main strategy for reducingmaternal mortality. As they move closer to thatobjective, other problems arise. In many countries,health systems are unable to cope with the addedpatient load without major expansion in facilities andstaff, and managers have limited information on howhealth facilities are functioning. Giving birth in a healthfacility does not necessarily equate with high-quality<strong>care</strong> or fewer maternal deaths. Smaller health facilitiesmay not have adequately trained staff, or staff maynot have the equipment or the authority to treat lifethreateningcomplications. Many facilities do not functionwell because of poor management, which shouldbe remedied before the number of births in the facilityis increased greatly (107, 108). For these reasons,the EmOC status of health facilities is included inIndicator 3 (Proportion of all births in EmOC facilities),and we recommend that this indicator be calculatedand interpreted with the other indicators.Data collection and analysisAlthough the name of the indicator is ‘Proportion ofbirths in EmOC facilities,’ in practice the numerator isthe number of women giving birth and not the numberof infants born. We recognize that the number of birthswill be slightly higher than the number of women givingbirth, because of multiple births; however, the extraeffort needed to count births rather than women givingbirth might not be necessary, nor is it likely to changethe conclusions drawn from the results. The numbersof women giving birth in facilities are obtained fromhealth facility record systems and are often collectedfor monthly reports to the government. The EmOCstatus of the health facility in which the delivery takesplace is available from the results of routine monitoringor needs assessments under Indicator 1.The total expected number of births in an area is basedon information about the population and the crude birthrate. National statistics offices tend to base populationprojections on the results of their most recent census.They may also have regional crude birth rates. If not,the crude birth rate is often available from nationalpopulation-based surveys, such as Demographic andHealth Surveys. When possible, estimates for the specificgeographical area should be used rather thanapplying the national crude birth rate to all regions.Regions are often selected for interventions or programmesbecause of special needs and thereforetend to have poorer indicators than at national level.Usually, the birth rate in poorer areas is higher than thenational average, so that use of the national averagewould result in an underestimate of the expected numberof births, and the proportion delivered in facilitieswould therefore be overestimated.Parallel analysis of the proportion of all births in all thefacilities surveyed allows comparison of the proportionof births in EmOC facilities with the proportion of birthsin all facilities. This indicates the extent to which otherfacilities provide delivery services. Figure 3 showsthat, for example in Chad all the births in facilities werein EmOC facilities, while in Bolivia, Mozambique andSenegal, the proportions of births in non-EmOC facilitiesadded 9–22%. In contrast, in Benin, only a smallproportion of institutional births occurred in facilitieswhere most <strong>obstetric</strong> complications could be treated.This indicator can also be analysed by level of facility(hospital and non-hospital), by ownership or management(public and private) and by subnational area, inorder to determine where women are delivering. Arewomen more likely to deliver in private or governmentfacilities? Are there more institutional deliveries
18<strong>Monitoring</strong> <strong>emergency</strong> <strong>obstetric</strong> <strong>care</strong>: a handbookFigure 3. Proportions of all births in EmOC facilities and all surveyed facilities80%60%Institutional birth40%9%59%20%19%22%0%24%9% 10%12% 13%Chad (2002) Senegal (2001) Bolivia (2003) Mozambique (2000) Benin (2002)EmOC FacilitiesNon-EmOC facilitiesFrom references (7, 37, 56).in certain subnational areas? Disaggregating data inthis way can provide more specific information aboutwhich interventions are most needed, and where.Interpretation and presentationOverall, this indicator shows the volume of maternityservices provided by facilities. If there appearsto be under-use, the reasons should be explored. Toincrease use, emphasis should be placed on enablingwomen with complications to use EmOC facilities. Thefirst goal of programmes to reduce maternal mortalityshould be to ensure that 100% of women with <strong>obstetric</strong>complications access to functioning <strong>emergency</strong>facilities.Supplementary studiesAt the local level, additional studies to understand theuse of services better are almost always useful. Whichgroups of women are using the services? Whichwomen are not, and why? Clearly, the answers tothese questions have important implications for publichealth and human rights.Which women are not coming to the facilities?Even if the use of health facilities (including EmOCfacilities) is fairly high, it is worthwhile investigatingwhich women are not using them. Certain factorsstrongly affect use of services in a particular area,such as distance to the facility, prevalence of ethnicor religious minority groups, level of education (oftenan indication of social status), the reputation of thefacility and poverty. Information on some of these factors,such as residence, may already be available inhealth facility records, and records can be reviewedto determine whether women come from all parts ofthe catchment area or only from the town in which thefacility is located. For factors for which information isnot routinely recorded, a study can be conducted. Forexample, students or staff members can be posted ina maternity ward for a few weeks or a month to recordrelevant information. It would be important, however,
<strong>Monitoring</strong> <strong>emergency</strong> <strong>obstetric</strong> <strong>care</strong>: a handbook 19to train and supervise these data collectors to ensurethat they follow confidentiality rules, treat patients andtheir families respectfully and ask for information in anunbiased manner.Ideally, the profile of the women who use the servicescan be compared with that of women in the population(national population-based surveys) in order to determinethe characteristics of the women who are underrepresentedas users of the facility (109).Why do some women not use the facility?Once the groups of women who are underrepresentedin the facility have been identified, it is important tofind out why. One should not assume that they knowthe reason, even if they have grown up in the region. Ifthe assumption is wrong, any ‘corrective action’ takenwill probably not work (110). Women should be questioned,either through interviews or in focus groups;or studies to compare subpopulations could be conducted,after adjustment for need or statistical controlfor confounding factors.Various activities can be used to improve use, dependingon the factors that discourage it.• If focus group discussions show that people lackbasic information about <strong>obstetric</strong> complications,a community education programme would be inorder. The precise form of the programme wouldbe determined by local circumstances, but itshould be aimed not only at pregnant women butalso at the people who influence their decision toseek <strong>care</strong>, such as other women of reproductiveage, partners, mothers-in-law and traditional birthattendants.• If transport from a village to the EmOC facility isa problem, the community could be mobilized tocoordinate the use of existing vehicles.• If poor roads are a barrier to <strong>care</strong>, the localgovernment should be approached to improvethem. If shortages of supplies or poor overallquality of <strong>care</strong> make people feel that going to thehospital is not worth the trouble, solutions to theproblems should be sought.• If women are reluctant to use the servicesbecause of practices they have previouslyexperienced or have heard about, those practicescan be discussed with staff at the facility todetermine how the facility norms can be adaptedto local customs or desires.• If the cost of services is an obstacle, medical<strong>emergency</strong> funds or insurance schemes haveproven successful in some places (111).Who attends births in facilities?Deliveries in institutions are not necessarily attendedby skilled birth attendants (112). Therefore, a studycould be carried out to see which cadres of workersare involved in deliveries and their level of competence.Providers could be interviewed to determinetheir understanding; observational studies wouldallow on-site verification of practices; and retrospectivechart reviews would allow an assessment of thoseaspects of <strong>care</strong> that should be documented on chartsor patient records.2.4 Indicator 4: Met need for EmOCDescription‘Met need’ is an estimate of the proportion of allwomen with major direct <strong>obstetric</strong> complications whoare treated in a health facility providing EmOC (basicor comprehensive). The numerator is the number ofwomen treated for direct <strong>obstetric</strong> complications at<strong>emergency</strong> <strong>care</strong> facilities over a defined period, dividedby the expected number of women who would havemajor <strong>obstetric</strong> complications, or 15% of expectedbirths, during the same period in a specified area. Thedirect <strong>obstetric</strong> complications included in this indicatorare: haemorrhage (antepartum and postpartum),prolonged and obstructed labour, postpartum sepsis,complications of abortion, severe pre-eclampsia andeclampsia, ectopic pregnancy and ruptured uterus.(For the operational definitions of these direct <strong>obstetric</strong>complications, refer to Box 2.)As we did for Indicator 3, we strongly recommend thatmet need be calculated at all health facilities as well asat EmOC facilities, to provide a more complete pictureof the use of the health system and where women arebeing treated.
20<strong>Monitoring</strong> <strong>emergency</strong> <strong>obstetric</strong> <strong>care</strong>: a handbookBox 2. Operational definitions of major direct <strong>obstetric</strong> complicationsHaemorrhageAntepartum••severe bleeding before and during labour: placenta praevia, placental abruptionPostpartum (any of the following)••bleeding that requires treatment (e.g. provision of intravenous fluids, uterotonic drugs or blood)••retained placenta••severe bleeding from lacerations (vaginal or cervical)••vaginal bleeding in excess of 500 ml after childbirth••more than one pad soaked in blood in 5 minutesProlonged or obstructed labour (dystocia, abnormal labour) (any of the following)• prolonged established first stage of labour (> 12 h)• prolonged second stage of labour (> 1 h)• cephalo-pelvic disproportion, including scarred uterus• malpresentation: transverse, brow or face presentationPostpartum sepsis• A temperature of 38 °C or higher more than 24 h after delivery (with at least two readings, as labour alonecan cause some fever) and any one of the following signs and symptoms: lower abdominal pain, purulent,offensive vaginal discharge (lochia), tender uterus, uterus not well contracted, history of heavy vaginalbleeding (Rule out malaria.)Complications of abortion (spontaneous or induced)• haemorrhage due to abortion which requires resuscitation with intravenous fluids, blood transfusionor uterotonics• sepsis due to abortion (including perforation and pelvic abscess)Severe pre-eclampsia and eclampsia• Severe pre-eclampsia: Diastolic blood pressure ≥ 110 mm Hg or proteinuria ≥ 3 after 20 weeks’ gestation.Various signs and symptoms: headache, hyperflexia, blurred vision, oliguria, epigastric pain,pulmonary oedema• Eclampsia• Convulsions; diastolic blood pressure ≥ 90 mm Hg after 20 weeks’ gestation or proteinuria ≥ 2.Signs and symptoms of severe pre-eclampsia may be presentEctopic pregnancy• Internal bleeding from a pregnancy outside the uterus; lower abdominal pain and shock possible frominternal bleeding; delayed menses or positive pregnancy testRuptured uterus• Uterine rupture with a history of prolonged or obstructed labour when uterine contractions suddenlystopped. Painful abdomen (pain may decrease after rupture of uterus). Patient may be in shock from internalor vaginal bleedingFrom references (95, 97, 98).
<strong>Monitoring</strong> <strong>emergency</strong> <strong>obstetric</strong> <strong>care</strong>: a handbook 21Minimum acceptable levelAs the goal is that all women who have <strong>obstetric</strong> complicationswill receive EmOC, the minimum acceptablelevel is 100%. Governments may wish to set interimtargets once they have a baseline and they haveembarked on interventions to improve the availabilityand use of such <strong>care</strong>.BackgroundMet need is a more refined measure of the use ofEmOC than Indicator 3 (Proportion of all births inEmOC health facilities), as it addresses whether thewomen who really need life-saving <strong>obstetric</strong> <strong>care</strong>receive it.In order to estimate met need for EmOC, one mustfirst estimate the total need, and then compare thenumber of women with serious <strong>obstetric</strong> complicationswho receive <strong>emergency</strong> <strong>care</strong> in such facilities.The total need for EmOC is estimated to be 15% ofall births, although there has been considerable discussionabout the expected number of complications.Studies have produced a range of results:• A review of studies in various geographical regionsbased on various definitions and methods haveshown levels of met need as low as 1% (113).• One prospective population-based study in sixWest African countries showed that 6% of pregnantwomen had severe direct <strong>obstetric</strong> complications(114). The authors reported that their findingswere likely to be underestimates because the definitionsof the complications that they used werelinked to medical interventions that might not havebeen available at all the participating facilities. Inaddition, they included only direct <strong>obstetric</strong> complicationsoccurring in late stages of pregnancyand omitted complications of abortion and ectopicpregnancies.• A systematic review of the prevalence of severeacute maternal morbidity (‘near miss’ events)based on disease-specific criteria showed a prevalenceof 0.8–8.2% (113). Reviewed studies variedin terms of the range and severity of <strong>obstetric</strong>complications included and the timing of complications(intrapartum and postpartum periods).• A prospective study of deliveries in India showeda 17.7% incidence of direct <strong>obstetric</strong> complicationsduring labour. This study did not includecomplications occurring during pregnancy (suchas complications of abortion), so the actual percentageof women with direct complications wasprobably higher. The authors concluded that15.3% of women needed EmOC, and 24% moreneeded non-<strong>emergency</strong> medical attention (115). Asecond study in India showed that 14.4% of deliverieswere associated with serious complications,but this study too was restricted to complicationsaround the time of childbirth (116). A study ofnational data for 1991–1992 in the United States, acountry with low maternal mortality, showed a totalof 18 hospitalizations for <strong>obstetric</strong> and pregnancyloss per 100 births (117). These findings wereconfirmed by more recent data (66). Although theresults vary, the technical consultation decidedto maintain 15% as an average estimate of thefrequency of serious direct complications for thepurposes of estimating the need for EmOC.Data collection and analysisTo calculate met need, information is needed onwomen in these facilities who are treated for themajor <strong>obstetric</strong> complications listed in Box 2. Thedefinitions were derived from WHO (Managing complicationsin pregnancy and childbirth and Pregnancy,childbirth, postpartum and newborn <strong>care</strong>) (95, 98)and the International Federation of Gynaecology andObstetrics Save the Mothers Project. Standardizationof definitions can be improved by training and supervision.These definitions are critical for training healthworkers, enumerators or interviewers who collectsuch data either routinely or as part of an EmOC needsassessment.
22<strong>Monitoring</strong> <strong>emergency</strong> <strong>obstetric</strong> <strong>care</strong>: a handbookRoutine maternity record systems in many countriesmay not register the ‘reason for admission’ or ‘maternalcomplications’, although complications can leadto maternal deaths. Appendix B gives a list of theinformation needed to calculate the indicators and thetypes of registers that should be consulted. It also listsitems that good registers might include, such as thetime of admission and the time of definitive intervention,which are useful for studying the interval betweenadmission and <strong>emergency</strong> caesarean section as anindicator of hospital efficiency (118).It is likely that incomplete or poor records will be foundwhen data for calculating met need and some of theother indicators are collected, especially the first time.As periodic collection of such data becomes part ofroutine programme monitoring, record keeping shouldimprove. The question is what to do when data collectionproblems are encountered?Poor records usually bias findings, leading to underestimatesof complications in facilities, and this mustbe taken into account in interpreting the data. Inmany situations, the level of EmOC being provided isso low that, allowing for substantial under-counting,the results do not change very much. Figure 4 showsactual measurements of met need over several years.If the records show that only 6% of the need for EmOCis being met in an area and the true proportion isassumed to be twice as high, the met need is still only12%. This sort of change will not alter programming.As record keeping improves, however, met need willincrease and the challenge will be to understand theattribution: Is the increase in met need a true increaseor is it a function of better data collection? Improveddata collection is a success in itself, and longer programmemonitoring should help determine if the metneed is really increasing.Figure 4. Increases in met need for EmOC during AMDD-supported projects (2000–2004)Countries inLatin AmericaCountries inNorth AfricaCountries insub-Saharan AfricaCountriesin AsiaFrom Bailey, P. Evaluating AMDD Phase 1: Policy and Service Improvements. In Delivering Safer Motherhood Symposium - Sharing theEvidence. 2007. London, UK: Unpublished data.
<strong>Monitoring</strong> <strong>emergency</strong> <strong>obstetric</strong> <strong>care</strong>: a handbook 23The most variable element in estimating met needfor EmOC is likely to be complications of abortion.While it is difficult to gather information on the incidenceof unsafe abortions (because they are generallyclandestine), the WHO report Unsafe abortion: globaland regional estimates of incidence of unsafe abortionand associated mortality in 2003 showed that thefrequency of unsafe abortions varies by geographicalarea, from three per 100 live births in Europe to 29 per100 live births in Africa (119).Moreover, recording of abortion complications is highlyvariable, including inaccuracies in whether the abortionwas merely incomplete (which could eventuallylead to a complicated abortion) or truly complicated(with haemorrhage or sepsis) at the time of treatmentor admission. In some settings, no attempt is made todistinguish between the two. Thus, complications ofabortion might actually be over-reported. The definitiongiven in Box 2 covers only those abortion complicationsthat include haemorrhage or sepsis.It would not be appropriate, however, to exclude abortionsfrom the calculation of met need, as complicationsof abortion are a major cause of maternal deathin some countries and regions. For example, in LatinAmerica and the Caribbean, 12% of maternal deathsare attributable to complications from abortion (120).Given the reporting difficulties, analysts presentingdata on met need should state explicitly what typesof abortion they have included and consider conductingstudies to examine the subject in greater detail. Ifit is suspected that abortions without serious complications(i.e. without haemorrhage or sepsis) are beingrecorded as ‘<strong>obstetric</strong> complications’, it might be usefulto calculate and report met need with and withoutabortions, for comparison (88).A frequently asked question is the possibility of overreportingdue to ‘double-counting’ of women who areadmitted to more than one facility, as in the case of areferral, or who are admitted to the same facility morethan once during a pregnancy. We recommend thatreferrals be counted at the facility at which the womenreceive definitive treatment. A study in Thailandshowed that met need was inflated by 16% becauseof double counting and dropped to 96% once it hadbeen adjusted for (90). If there is concern about doublecounting and its effect on met need, we recommendthat a study be designed to measure the effect.The results of this special study can then be taken intoaccount when interpreting the general findings.Many health facilities, of course, perform some but notall of the basic EmOC signal functions. As these facilitiesmay well avert some maternal deaths, we recommendthat met need in both EmOC facilities and in allthe facilities surveyed be calculated. Even when manyfacilities do not perform a few signal functions, it is stillimportant to find out how many <strong>obstetric</strong> complicationsthey manage.Interpretation and presentationIf the minimum acceptable level for this indicator is notmet, i.e. is less than 100%, some women with complicationsare not receiving the medical <strong>care</strong> they need.This is likely to be the norm where maternal mortalityis high. If there are adequate numbers of EmOC facilities,women give birth in those facilities and the metneed is less than 100%, the national priority must be toimprove use of the facilities by women with complications.Depending on the situation, strategies for meetingthis objective could include improving the qualityof <strong>care</strong> at facilities, eliminating barriers to seeking <strong>care</strong>(e.g. transport or cost) and educating the community torecognize complications and the importance of seeking<strong>care</strong>. Met need may also be low because <strong>obstetric</strong>complications are poorly recorded in registers. Inthis case, it is advisable to study record keeping atthe facility (see discussion above and ‘supplementarystudies’ below).If the met need is close to 100%, one might askwhat definition of abortion is used, because it is notuncommon for met need to exceed 100% if all abortions(incomplete, missed, spontaneous, induced) areincluded in the numerator. If that is not the case, it isreasonable to conclude that most women who needEmOC services are receiving them. As discussed earlier,since the true incidence of complications in thepopulation might be greater than 15%, it is possiblethat even if met need is 100% there are still womenwho are not receiving the life-saving EmOC servicesthey need. For this reason alone, the level of met needmight be greater than 100%. This should not be inter-
24<strong>Monitoring</strong> <strong>emergency</strong> <strong>obstetric</strong> <strong>care</strong>: a handbookpreted as being due to faulty data, e.g. over-diagnosisof complications; it is possible that the geographicaldistribution of EmOC facilities is uneven, and metneed exceeds 100% because women from outsidethe catchment area come to the facility. Like the questionof double counting, a study of who uses the facilitycould help explain a met need higher than 100%.When interpreting the indicators, it is helpful to look atindicators 3 and 4 at the same time.Supplementary studiesWhile met need for EmOC is a gauge of the level ofsuch <strong>care</strong> in an area, it does not show what is required,and a low met need cannot indicate where the problemlies. It might be due to under-recording of complicationsor to one of many factors that affect the use ofservices, and further investigation is required.It is important to ensure that women from all the communitiesin the area are treated at the facility. (See thesection on additional studies under Indicator 3 formore ways of exploring this topic.) Studies to addresstwo questions would provide a deeper understandingof who is included in met need and how they affectthis indicator:• How many women have complications after theyare admitted to hospital, and which complicationsare they likely to have once admitted?• How many women are admitted with signsand symptoms of complications, and whichcomplications are those?When women with complications are stabilized at alower-level facility before referral to a higher level of<strong>care</strong>, we suggest that they be counted only at thefacility where they receive definitive treatment. Thereis no easy mechanism for finding out whether areferred woman reaches her destination. A study ofthe women referred, their treatment before referral,their compliance with referral and their definitive treatmentwould elucidate the effect of double counting onmet need and would also show how well the referralsystem functions. In the field, staff at lower levels hasargued in favour of counting these women twice, asthey claim that they too have treated them, usuallyby stabilization. To raise morale, programme managersmight consider counting them twice, and with astudy of referrals they can also document the effectof double counting on met need and make any necessaryadjustments.Several types of study could be used to explore thequality of record keeping at a facility:• Examine how records are kept. Does someoneenter complications into the register 24 h/day, ordoes the senior nurse document them only oncea day from verbal reports by other staff? Thispractice could lead to serious underreporting.Discussions with staff about recent cases can provideinsight into how records are kept.• Compare the complications recorded in the maternityregister with patient charts, operating theatreregisters or <strong>emergency</strong> admissions logbooks.What proportion of serious complications is notreported in the register that is usually used for calculatingmet need? Which complications appearto be most underreported? How do your findingschange when you correct for this underreporting?How often does a diagnosis of complicationchange between the admissions register and theoperating theatre register?• Examine how abortion complications are recordedby discussing the records and case noteswith staff. Are minor complications, or even allincomplete abortions, counted as ‘complications’?Remember, for calculating met need, only seriouscomplications, such as complications of abortionwith sepsis and haemorrhage, are counted.• For more detailed monitoring of abortioncomplications, we recommend a set of ‘processindicators for safe abortion’, which include11 signal functions that define basic andcomprehensive <strong>care</strong>. Like the EmOC indicators,the safe abortion indicators measure theavailability, distribution, use and quality of safeabortion services (121-123).• Knowing more about how well and how completelylogbooks are kept up can identify problems.Investigate whether staff training or supervision ofrecord keeping reduces underreporting over time,and then disseminate your results.
<strong>Monitoring</strong> <strong>emergency</strong> <strong>obstetric</strong> <strong>care</strong>: a handbook 252.5 Indicator 5: Caesarean sections as aproportion of all birthsDescriptionThe proportion of all deliveries by caesarean sectionin a geographical area is a measure of access to anduse of a common <strong>obstetric</strong> intervention for avertingmaternal and neonatal deaths and for preventing complicationssuch as <strong>obstetric</strong> fistula. The numerator isthe number of caesarean sections performed in EmOCfacilities for any indication during a specific period,and the denominator is the expected number of livebirths (in the whole catchment area, not just in institutions)during the same period.Occasionally, hospitals in which caesarean sectionsare performed lack one of the basic signal functions ofEmOC and do not qualify as such a facility. Therefore,as for indicators 3 and 4, we recommend that this indicatorbe calculated for both EmOC facilities and allfacilities.Minimum and maximum acceptable levelsBoth very low and very high rates of caesarean sectioncan be dangerous, but the optimum rate is unknown.Pending further research, users of this handbookmight want to continue to use a range of 5–15% or settheir own standards.BackgroundThe proportion of births by caesarean section waschosen as the indicator of provision of life-saving servicesfor both mothers and newborns, although othersurgical interventions (such as hysterectomy for a ruptureduterus or laparotomy for an ectopic pregnancy)can also save maternal lives. Of all the proceduresused to treat major <strong>obstetric</strong> complications, caesareansection is one of the commonest, and reporting isrelatively reliable (124).Earlier editions of this handbook set a minimum (5%)and a maximum (15%) acceptable level for caesareansection. Although WHO has recommended since1985 that the rate not exceed 10–15% (125), thereis no empirical evidence for an optimum percentageor range of percentages, despite a growing body ofresearch that shows a negative effect of high rates(126-128). It should be noted that the proposed upperlimit of 15% is not a target to be achieved but rather athreshold not to be exceeded. Nevertheless, the ratesin most developed countries and in many urban areasof lesser-developed countries are above that threshold.Ultimately, what matters most is that all womenwho need caesarean sections actually receive them.The technical consultation for these guidelines notedthe difficulty of establishing a lower or upper limit forthe proportion of caesarean sections and suggestedthat a lower limit of 5% is reasonable for caesareansperformed for both maternal and fetal reasons.If elective or planned caesarean sections and thoseperformed for fetal indications were excluded, a lowerrange would be indicated; however, the record systemmay not always register the indication for the operationand such precision is usually not available. A detailedanalysis of the reasons for caesarean section in a hospitalwould be worthwhile.Where maternal mortality is high, the rate of caesareansections tends to be low, especially in rural areas. Arecent review of global, regional and national rates ofcaesarean section showed that the lowest rate (3.5%)was in Africa; in the 49 least-developed countries, therates ranged from 0.4% in Chad to 6% in Cape Verde(or an average of 2%) (129). Figure 5 shows how lowrates of caesarean section in several countries of Asiaand in sub-Saharan Africa changed after several yearsof interventions to improve EmOC.Despite the clear inverse relation between very highmaternal mortality and low rates of caesarean section,this procedure (like any major surgery) carries arisk for surgical or anaesthetic accident, postoperativeinfection, and even death for the patient (129). Auterine scar increases the risk for uterine rupture infuture pregnancies. Where conditions in a facility areparticularly precarious, the case fatality rate amongwomen who undergo caesarean sections can be unacceptablyhigh, as found by the Network for UnmetObstetric Need in Benin, Burkina Faso, Haiti, Mali andNiger in 1998 and 1999. 1 The risks should be weighedagainst the potential benefits of the surgery. In the1 de Brouwere V. Personal communication about case fertility ratesfor caesareans, 2006.
26<strong>Monitoring</strong> <strong>emergency</strong> <strong>obstetric</strong> <strong>care</strong>: a handbookcase of transverse fetal lie, when external version failsor is not advisable, the benefits of surgery definitelyoutweigh the risks. Without a caesarean section, mostwomen with obstructed labour will either die or beseverely maimed (130). A caesarean section is the keyintervention for preventing <strong>obstetric</strong> fistula caused byprolonged or obstructed labour, making this indicatoran important means for measuring progress in the preventionof this condition.Many observers consider that we are experiencing aworldwide epidemic of overuse of caesarean section(131) and that the rates will continue to rise, in viewof practitioners’ and administrators’ fear of litigation,local hospital culture and practitioner style as well asincreasing pressure from women in highly industrializedcountries to undergo caesarean sections for nonmedicalreasons (132, 133). At the same time, evidencefor the negative consequences of caesarean section isincreasing: recent studies in countries with high ratessuggest that caesarean section carries increased risksfor maternal and neonatal morbidity and mortality(126-128).Figure 5. Caesarean sections as a proportion of births in AMDD-supported projects (2000–2005)Data collection and analysisWhile data on the rate of caesarean sections can becollected in population surveys, such as demographicand health surveys, data for this indicator are collectedfrom hospital records (134), as rates based onservice statistics are considered more precise thanpopulation-based rates, which tend to be marginallyhigher than those based on health facility records(124). Facility data are collected routinely from operatingtheatre logbooks, which are often the most completerecords available.The numerator for this indicator covers caesarean sectionsperformed for all indications, including those formaternal and neonatal reasons, as well as caesareansections performed in emergencies and those that areplanned or scheduled.Throughout the discussion of the indicators, we havestressed the importance of including data from alltypes of facilities. In countries or regions where theprivate sector plays a major role in delivering obstetsFrom Bailey, P. Evaluating AMDD Phase 1: Policy and Service Improvements in Delivering Safer Motherhood Symposium - Sharing theEvidence. 2007. London, UK: Unpublished data.
<strong>Monitoring</strong> <strong>emergency</strong> <strong>obstetric</strong> <strong>care</strong>: a handbook 27ric services, the rate of caesarean section will be particularlysensitive to inclusion of such hospitals. Forinstance, in Latin America and Asia, the proportion ofcaesarean sections is higher in private than in publicfacilities. In El Salvador, roughly one-half of all caesareansections are performed outside the public sector,through the private sector and social security hospitals(135). This raises the possibility that some of theseoperations are performed (or not) for financial, ratherthan medical, reasons.A common misunderstanding of this indicator is that itrefers to the proportion of deliveries in a hospital thatare performed by caesarean section, i.e. the ‘institutionalcaesarean section rate’ or the proportion ofdeliveries in the facility that are done by caesareansection. The institutional caesarean rate is difficult tointerpret, because it depends on the patients in thehospital (Is the hospital a regional referral hospital thatreceives many complicated cases? Or is it a districthospital, where most complicated cases are referredfurther?) as well as the skills, preferences and habits ofthe providers. The population-based indicator recommendedhere gives an overview of the level of provisionof this critical service in a geographical region.To reduce the possibility that this indicator will maskinequities in access to and use of caesarean section,we strongly encourage authorities to look closely attheir data. For instance, in Morocco, Peru and VietNam, the national rates of caesarean section are5–15%, but the national data mask the high rates inmajor cities and the very low rates in rural areas. Therange of patterns is shown in Table 7.Table 7. Population rates of caesarean section from Demographic and Health Surveys amongwomen who gave birth within three years of the survey .Region Country YearRate of caesarean sectionTotal Urban RuralLatin AmericaDominican RepublicPeru2002200033.112.936.221.027.23.2South-East AsiaBangladeshNepalViet Nam2004200120024.51.09.913.75.022.92.20.77.2AfricaEthiopiaKenyaMoroccoZambia200020032003–20042001–20020.64.35.62.25.29.59.34.40.13.01.91.2From reference (134)Another example of inequitable access to caesareansection is presented in Figure 6. Ronsmans et al. useddemographic and health survey data to show therange of rates by wealth quintile in 13 countries withnational rates of 2.0–4.9% (136). This analysis showsthat the poorest women have less access to this lifesavingprocedure.
28<strong>Monitoring</strong> <strong>emergency</strong> <strong>obstetric</strong> <strong>care</strong>: a handbookFigure 6. Rates of caesarean section by wealth quintile in 13 countries with national rates between 2.0%and 4.9%19181716Côte d’lvoire 98 Uganda 00 Pakistan 90Malawi 00 Ghana 03 Benin 01Comoros 96Rwanda 00 Bangladesh 04Indonesia 02 Tanzania 99Mozambique 02 Kenya 03Key: Country and year data151413Percent of deliveries by caesarean1211109876543210Poorest quintile Poor quintile Middle quintile Richer quintile Richest quintileReproduced, with permission, from reference (136).Interpretation and presentationWhen less than 1–2% of births are by caesarean section,there is little doubt that pregnant women havepoor access to surgical facilities. Rates in this rangeare common in rural sub-Saharan Africa and in somecountries of South Asia (Figure 6 and Table 7). Wherecaesarean section rates are very low, most are probablydone for maternal emergencies; as the ratesincrease, a greater share may be for fetal emergencies.As the number of caesarean sections increases,the uncertainty between these classifications alsoincreases (137).Supplementary studiesWho has caesarean section and where?Studies on caesarean sections should include the proportionsof births in urban and rural areas, as well as insmaller administrative or geographical units. Variablesthat are used to measure equity, such as economic
<strong>Monitoring</strong> <strong>emergency</strong> <strong>obstetric</strong> <strong>care</strong>: a handbook 29quintiles, ethnicity and education, can be used toreveal where access to services is limited. Anothermethod for understanding data on caesarean sectionsis investigating the type of hospital (e.g. public orprivate) where caesarean sections are performed, asthis can indicate how the various components of thehealth system interact.Indications for caesarean sectionThe final responsibility for ensuring that caesareansection is performed only when necessary is with clinicians.The chief medical officer or the head of an<strong>obstetric</strong>s and gynaecology department in a hospitalshould review the indications for the caesareans thatare performed. One approach is to look at the proportionperformed for absolute maternal indications,which would almost certainly lead to the woman’sdeath if untreated, including severe antepartum haemorrhagedue to placenta praevia or placental abruption,major cephalo-pelvic disproportion, transverse lie andbrow presentation (138). Another approach is to identifycaesarean sections that are performed for maternaland for fetal indications, and a third approach is touse the Robson classification system, which relies onthe characteristics of women who have had caesareansections (139). The classification sorts women into 10mutually exclusive groups on the basis of parity, previous<strong>obstetric</strong> history, the course of labour and deliveryand gestational age (140). It can be used to identifywomen who have had caesarean sections for reasonsother than as a response to an imminent <strong>emergency</strong>.Who performs caesarean sections?When the level of Indicator 5 is under the recommendedminimum, poorly functioning health facilitiesmay be a contributing factor. This often results fromfactors such as postings and transfers of key staff ora real shortage of health professionals trained to performthis life-saving service. Studies can be done toinvestigate whether this indicator is affected by lackof human resources. For example, an analysis of whois trained and authorized to provide caesarean sectionsmay be informative. In countries where a smallgroup of health professionals, primarily based at facilitiesin large urban centres, are the only practitionersable to provide caesarean section, a strategy must bedevised to address shortages of health professionalsin rural areas. One strategy that has been successfullyused in Malawi, Mozambique and the United Republicof Tanzania is to train mid-level providers (e.g. clinicalofficers, assistant medical officers) to perform caesareansections (141–144). Similarly, in India, a newprogramme under the auspices of the Governmentand the <strong>obstetric</strong>s society is training doctors with aBachelor’s degree in medicine and surgery in comprehensiveEmOC, including caesarean section (145).Quality of <strong>care</strong>Training, supervision and leadership by senior physiciansare important in maintaining standards. Nationalsocieties of <strong>obstetric</strong>s and gynaecology shouldencourage the use of evidence-based protocols. Infacilities at all levels, routine clinical audits can be usedto monitor change, improve practice and maintain agood quality of <strong>care</strong>; several tools exist to facilitatethis process (146–148). The infection rate in womenwho have undergone <strong>obstetric</strong> surgery is another indicatorof the quality of <strong>care</strong>.Unmet <strong>obstetric</strong> needThe indicator ‘Unmet <strong>obstetric</strong> need’ is not the sameas Indicator 4 (Met need for EmOC) but describes theneed for <strong>obstetric</strong> surgery for absolute maternal indications.Indicator 4 encompasses all the direct <strong>obstetric</strong>complications treated with the EmOC signal functions,which are both surgical and nonsurgical (e.g. parenteralanticonvulsants, uterotonic drugs). The indicatorfor unmet <strong>obstetric</strong> need refers to the need for <strong>obstetric</strong>surgery, including hysterectomy or laparotomy,in addition to caesarean section. Caesarean sectionconstitutes most <strong>obstetric</strong> surgical procedures. Thisindicator focuses strictly on maternal life-threateningconditions for which major <strong>obstetric</strong> surgery is performed.It is intended to help health personnel answerthe questions:• Are pregnant women receiving the major surgical<strong>obstetric</strong> interventions they need?• How many women’s needs are unmet?• Where are those women whose needs are unmet?Box 3 provides detailed information on this indicator.
30<strong>Monitoring</strong> <strong>emergency</strong> <strong>obstetric</strong> <strong>care</strong>: a handbookBox 3. Indicator of unmet <strong>obstetric</strong> needUnmet <strong>obstetric</strong> need is an estimate of the number of women needing a major <strong>obstetric</strong> interventionfor life-threatening complications who did not have access to appropriate <strong>care</strong>. This indicator isparticularly appropriate for identifying geographical or social inequity in access to hospital <strong>care</strong>.The conceptThe concept of unmet <strong>obstetric</strong> need is the difference between the number of women who need<strong>obstetric</strong> surgery and the number of women who are in fact covered by health services.Estimatednumber ofabsolute maternalindications–Observed numberof major <strong>obstetric</strong>interventionsperformed forabsolute maternalindications=Estimated numberof women whoneeded but did notreceive life-saving<strong>care</strong>The indicator is restricted to absolute (life-threatening) <strong>obstetric</strong> indications that require <strong>obstetric</strong>surgery (caesarean section, hysterectomy, laparotomy) or internal version and craniotomy. Astandard list of such indications was drawn up on the basis of the degree of severity of theindication, the relative stability of its incidence and relatively reproducible diagnosis. It comprises:• antepartum haemorrhage due to placenta praevia or abruptio placenta;• abnormal presentation (transverse lie or shoulder presentation, face with persistent mentoposteriorposition or brow presentation);• major feto-pelvic disproportion (e.g. mechanical cephalo-pelvic disproportion, small pelvisincluding pre-rupture and rupture of uterus); and• uncontrollable postpartum haemorrhage.In most situations, the incidence of <strong>obstetric</strong> need is not known precisely. A benchmark can beused to estimate the number of women with absolute maternal indications, which is 1.4% (95%confidence interval, 1.27–1.52), the median for five sub-Saharan African countries, Haiti, Moroccoand Pakistan (http://www.uonn.org/uonn/pdf/engintc00.pdf). Multiplied by the number of expectedbirths in an area, this gives the estimated number of women with absolute maternal indications inthe area. The second element of the equation—the number of major <strong>obstetric</strong> interventions actuallyperformed for absolute maternal indications—is the sum of all such interventions performed in thepopulation of women in the area, wherever the intervention took place (private or public sector, inor outside the defined area). The difference between the number of women with absolute maternalindications and the number of major <strong>obstetric</strong> interventions actually performed for those indicationsis the unmet need.Example: In the rural part of district X, 20 000 births are expected in 2007. The number of major<strong>obstetric</strong> interventions for absolute maternal indications is estimated to be 1.4% (benchmark)x 20 000 = 280 interventions. When all public and private comprehensive <strong>emergency</strong> <strong>obstetric</strong> <strong>care</strong>facilities had been visited, the total number of major <strong>obstetric</strong> interventions performed for absolutematernal indications was 84. The unmet need was thus 280 – 84 = 196, or an unmet need of 70%.This means that 196 women did not have access to necessary life-saving surgery.For additional information and forms used to construct this indicator, see the website of the unmet<strong>obstetric</strong> needs network, www.uonn.org.
<strong>Monitoring</strong> <strong>emergency</strong> <strong>obstetric</strong> <strong>care</strong>: a handbook 312.6 Indicator 6: Direct <strong>obstetric</strong> casefatality rateDescriptionThe direct <strong>obstetric</strong> case fatality rate is the proportionof women admitted to an EmOC facility with majordirect <strong>obstetric</strong> complications, or who develop suchcomplications after admission, and die before discharge.We include all seven major <strong>obstetric</strong> complicationslisted in Box 2.The numerator is the number of women dying of direct<strong>obstetric</strong> complications during a specific period atan EmOC facility. The denominator is the number ofwomen who were treated for all direct <strong>obstetric</strong> complicationsat the same facility during the same period.In general, the denominator for the direct <strong>obstetric</strong>case fatality rate is the numerator for met need.Like indicators 3–5, the direct <strong>obstetric</strong> case fatalityrate should be calculated for all facilities, not justEmOC facilities. It is usually calculated at individualfacilities and across facilities, especially those of thesame type, such as district hospitals.Maximum acceptable levelThe maximum acceptable level is less than 1%.BackgroundAfter determining the availability and use of services,the next concern is quality of <strong>care</strong>, which is the subjectof a growing, complex literature. The set of EmOC indicatorsincludes the direct <strong>obstetric</strong> case fatality rate asa relatively crude indicator of quality. This should besupplemented with more detailed assessments.In the earlier editions of this publication, this indicatorwas simply called the ‘case fatality rate’. It has beenrenamed ‘Direct <strong>obstetric</strong> case fatality rate’ for thesake of clarity and because a new indicator has beenadded for indirect <strong>obstetric</strong> complications.Researchers have gained substantial experience withthis indicator in the past 10 years. Periodic monitoring(every 6–12 months) has been the norm when theEmOC indicators are used routinely (15, 36, 65). Theavailable data, an example of which is presented inTable 8, indicates that substantial reductions are possiblewithin 3–5 years, if not sooner, with improvedquality of <strong>obstetric</strong> <strong>care</strong>. The direct <strong>obstetric</strong> casefatality rate in these studies ranged from almost 2%to 10%, whereas an analysis of application of theEmOC indicators to data from the United States in2000 showed a direct <strong>obstetric</strong> case fatality rate of0.06%. (66)Table 8. Direct <strong>obstetric</strong> case fatality rates before and after interventions to improve <strong>emergency</strong> <strong>obstetric</strong> <strong>care</strong>Setting Before interventions After interventions ReductionAyacucho, Peru(2000–2004, five facilities)Gisarme, Rwanda(2001–2004, three facilities)Mwanza, United Republic ofTanzania(2000–2004, four facilities)Sofala, Mozambique(2000–2005, 12 facilities)Oromiya, Ethiopia(2000–2004, three facilities)1.7% 0.1% 94%2.0% 0.9% 55%3.0% 1.9% 37%3.5% 1.7% 33%10.4% 5.2% 50%From references (15, 36, 65)
32<strong>Monitoring</strong> <strong>emergency</strong> <strong>obstetric</strong> <strong>care</strong>: a handbookGiven the range, 1% would appear to be a reasonablemaximum acceptable level, falling between the ratesfor less and more developed countries. The postinterventionrates in Table 8 show that it is possible toreduce a high rate to below 1%; however, countriesthat reach this benchmark should strive to reduce therate even further. Sometimes, circumstances beyondthe control of hospital managers may make it difficultto achieve a rate below 1%. If few facilities providebasic and comprehensive EmOC, women with complicationsare likely to arrive at the hospital after a longjourney, jeopardizing their survival. There are neverthelesslow-cost ways to improve the quality of <strong>care</strong>and to reduce the direct <strong>obstetric</strong> case fatality rateprogressively.Data collection and analysisThe direct <strong>obstetric</strong> case fatality rate can be calculatedfor any facility that treats complications, experiencesmaternal deaths and has adequate recordson both these events. The same issues in collectingdata on major direct <strong>obstetric</strong> complications formet need apply, although new issues arise for thecollection of information on the number of maternaldeaths. Maternal deaths are notoriously underestimatedbecause of misclassification or underreporting,sometimes out of fear of rebuke or reprisal (149).Both deaths and complications should be thoroughlysought in all wards where adult women are admitted,not only the <strong>obstetric</strong> ward.We encourage calculation of separate cause-specificfatality rates for each of the major causes of maternaldeath. Treatment of some complications, such asobstructed labour, may improve more rapidly thanothers, such as eclampsia. Cause-specific case fatalityrates indicate where progress has been made andwhere it has not (36). The number of maternal deathsin a given facility or aggregate of facilities is, however,often too small (e.g. fewer than 20) to calculatea stable rate for each complication. Therefore, in mostfacilities, only an aggregate direct <strong>obstetric</strong> case fatalityrate will be calculated, and the number of maternaldeaths can be small.There are good reasons for using this indicator forindividual facilities, for all facilities to reflect the stateof the health system, or for a subset of facilities inthat system (see Table 11 in section 2.9). Averagingthe rates for all facilities is one crude monitoring measure,but it does not show which facilities contributemost heavily to the direct <strong>obstetric</strong> case fatality rateand therefore where interventions are most needed.To identify those facilities or regions that need greaterattention, data from various types of facilities (or indifferent areas) can be analysed separately and thencombined.Interpretation and presentationDirect <strong>obstetric</strong> case fatality rates do not take intoaccount deaths outside the health system. This doesnot affect the value of the indicator, because it is usedonly to measure the performance of the EmOC facility.If the indicators of the availability of facilities, the proportionof births in facilities and met need (indicators1–5) show that EmOC services are well distributed andwell used and the direct <strong>obstetric</strong> case fatality ratesare low, it is safe to say that the maternal <strong>care</strong> systemin the country is working fairly well. If, however,the direct <strong>obstetric</strong> case fatality rate is acceptable butEmOC coverage or met need is insufficient, the implicationis that women who deliver in EmOC facilitiesare likely to survive but maternal deaths outside healthfacilities might still be common.Comparisons of direct <strong>obstetric</strong> case fatality ratesamong individual facilities can be difficult to interpretwhen the facilities are not comparable. For example, itmay not be valid to compare the rate in a district hospitalwith that in a teaching hospital, as women withthe most serious complications may be referred to theteaching hospital at the last moment, where they die.This difference would lower the direct <strong>obstetric</strong> casefatality rate at the district hospital and raise it at theteaching hospital.The direct <strong>obstetric</strong> case fatality rate in a facility canexceed the maximum acceptable level for several reasons.In many cases, the quality of <strong>care</strong> is inadequate;however, there may be other explanations. For example,long delays in reaching EmOC facilities can resultin a poor status on arrival; or a facility with a high direct<strong>obstetric</strong> case fatality rate might be the end-point of
<strong>Monitoring</strong> <strong>emergency</strong> <strong>obstetric</strong> <strong>care</strong>: a handbook 33the local referral chain, so that women with the mostserious complications are sent there. It is also importantto consider the number of women counted incalculating the direct <strong>obstetric</strong> case fatality rate. If therate is based on a small number of women, even asingle death can create a deceptively large increase.Given the problems of interpreting small numbers, thedirect <strong>obstetric</strong> case fatality rate is most useful at districtlevel or at high-volume facilities where there aremany maternal deaths. Therefore, these rates tend tobe calculated only at comprehensive EmOC facilities.The occurrence of some maternal deaths in a facilitycan indicate that women go there for treatment of complications;conversely, the absence of maternal deathsmight indicate that women with serious complicationsare not brought there or are routinely referred on, evenwhen they should be treated on site. The absenceof reported deaths could also suggest that deathsare not being reported. In addition, the numbers ofdeaths and direct <strong>obstetric</strong> case fatality rates mayincrease when efforts are made to improve hospitalservices and more women come for treatment, fromfurther away. Thus, the direct <strong>obstetric</strong> case fatalityrate must be interpreted in the context of the previousindicators, and studies should be conducted fordeeper understanding. By no means should the direct<strong>obstetric</strong> case fatality rate be a cause for administrativesanctions. That would just increase the likelihoodthat women with serious complications are referred toanother facility rather than treated, or that deaths thatoccur on site are not reported.Bar charts or scatter plots can effectively highlightvariations in direct <strong>obstetric</strong> case fatality rates at differentlevels or in different types of health facility orgeographical region. Each type of facility or region canbe depicted as a separate graph, or different coloursand shading can highlight differences in the samegraph.Supplementary studiesHigh direct <strong>obstetric</strong> case fatality rates indicate problemsbut do not, by themselves, identify correctiveactions. They are, however, a good beginning for furtherstudies.Case studies of women’s condition on admissionInformation on the condition on admission of womenwith major complications on admission (e.g. pulse,blood pressure, and temperature) can be collected,for women who survive and those who do not. Betterunderstanding of patients’ condition on admissionwould help differentiate the effect of condition onarrival from the quality of <strong>care</strong> after arrival.Delays in diagnosis or treatmentThere are many possible reasons for delayed diagnosisor treatment once a woman has reached a facility.For example, patients’ families may have to buy drugsand medical supplies from local pharmacies becausethe hospitals do not have enough. The causes ofdelays can vary from back-ups in the <strong>emergency</strong>room, to a gatekeeper who demands a tip, to electricityfailures (150).Studies of ‘the third delay’ (once women have reachedhealth facilities) and the ‘client flow analysis’ exercisein the Tool book for improving the quality of services(150) are useful models for this type of supplementarystudy; they systematize the observation and measurementof delays and allow researchers to identifyat what stage they are most frequent. The exercisesare based on evidence-based standards and expertopinion to determine what constitutes a delay. Anotherapproach is to collect data on the interval between thetime a woman with a complication is admitted andwhen she receives definitive treatment. Good-qualitymonitoring reveals which delays are the longest andmost dangerous, and the direct <strong>obstetric</strong> case fatalityrate can be lowered by reducing those delays.In the university hospital of Zaria, Nigeria, the intervalbetween admission and treatment was reduced by57% (from 3.7 to 1.6 hours) between 1990 and 1995.During this time, the case fatality rate (combiningdirect and indirect causes) decreased by 21%, from14% to 11% (151).Reviewing maternal deathsWhen a direct <strong>obstetric</strong> case fatality rate is high orfails to decrease, a study should be conducted.Maternal deaths can be reviewed in health facilitiesand at district, regional or national level (sometimes
34<strong>Monitoring</strong> <strong>emergency</strong> <strong>obstetric</strong> <strong>care</strong>: a handbookreferred to as ‘confidential enquiry’) to identify gapsin management or clinical service delivery. The WHOpublication Beyond the numbers—reviewing maternaldeaths and complications to make pregnancy safer(148) describes two types of review:• A facility-based review is a detailed study of thesystemic causes of and circumstances surroundingmaternal deaths at the facility. The goal is todetermine which of the factors that contributed tomaternal deaths were avoidable and what couldbe changed to improve the quality of EmOC at thefacility.• A confidential enquiry into maternal deaths is ananonymous, systematic study of all or a randomsample of maternal deaths occurring in a specifiedarea (urban, district, region or national). Theresearchers look at issues such as substandard<strong>care</strong>, women’s access to <strong>care</strong> and the availabilityof medicines and drugs. By aggregating thecauses and factors that contribute to maternaldeaths in a wider area, evidence can be generatedto help decision-makers design and implementsystematic solutions for improving EmOC.Reviewing cases of women who survive lifethreateningcomplications (‘near misses’)An alternative, more positive and sometimes lessthreatening approach to improving quality is to studysystematically the <strong>care</strong> given to women with lifethreatening<strong>obstetric</strong> complications who are saved bythe health facility (‘near misses’). One benefit of thismethod is that near misses occur more frequently thanmaternal deaths and therefore provide more opportunitiesfor studying the quality of <strong>care</strong>. Another benefitis that such a review provides an occasion to look atwhat health professionals did correctly to save thewoman rather than focus on the problems. This helpsto create a more supportive environment in which todiscuss aspects of <strong>care</strong> that could be improved. TheWHO publication Beyond the numbers (148) givesmore detailed information, including operational definitionsof near misses and a standard set of criteriawith which a near-miss case is identified is beingdeveloped by WHO (1, 52)2.7 Indicator 7: Intrapartum and very earlyneonatal death rateDescriptionIndicator 7 is the proportion of births that result ina very early neonatal death or an intrapartum death(fresh stillbirth) in an EmOC facility. This new indicatorhas been proposed to shed light on the quality ofintrapartum <strong>care</strong> for foetuses and newborns deliveredat facilities (153). The numerator is the sum of intrapartumand very early neonatal deaths within the first 24hours of life occurring in the facility during a specificperiod, and the denominator is all women who gavebirth in the facility during the same period.Because the objective of this indicator is to measurethe quality of intrapartum and newborn <strong>care</strong>, it is recommendedthat newborns under 2.5 kg be excludedfrom the numerator and the denominator wheneverthe data permit, as low birthweight infants have a highfatality rate in most circumstances.As for the previous indicators, the intrapartum andvery early neonatal death rate should be calculated forall facilities, not just EmOC facilities.Maximum acceptable levelNo standard has been set; a maximum acceptablelevel may be determined after the indicator has beentested in various circumstances.BackgroundGlobally, nearly 2 million infants die each year aroundthe time of delivery: 900 000 neonatal deaths, or 23%of all neonatal deaths, and 1.02 million intrapartumstillbirths, or 26% of all stillbirths (154). Good-quality<strong>care</strong> during intrapartum is therefore crucial for boththe mother and her infant. When appropriate, timely<strong>care</strong> is provided, most maternal and neonatal deathscan be prevented.A major cause of fetal death intrapartum or immediatelypostpartum is birth asphyxia, which can resultfrom poorly managed <strong>obstetric</strong> complications, suchas obstructed or prolonged labour, ruptured uterus,
<strong>Monitoring</strong> <strong>emergency</strong> <strong>obstetric</strong> <strong>care</strong>: a handbook 35eclampsia or antepartum haemorrhage, and theabsence of neonatal resuscitation (155). Birth asphyxiacan also be a result of preterm birth or congenital malformation,conditions that are not directly related tothe quality of <strong>care</strong> given intrapartum. As we are concernedhere primarily with the health system’s abilityto provide good-quality intrapartum and immediatepostpartum <strong>care</strong>, this indicator focuses on those stillbirthsand very early neonatal deaths that could havebeen averted by the availability and use of good-quality<strong>obstetric</strong> <strong>care</strong> and neonatal resuscitation.Data collection and qualityThe operational definitions for this indicator includethe following components, as defined by Lawn andcolleagues (154):• Stillbirths occurring intrapartum or fresh stillbirths:infants born dead after more than 28 weeks ofgestation without signs of skin disintegrationor maceration; the death is assumed to haveoccurred less than 12 hours before delivery;excludes those born with severe, lethal congenitalabnormalities.• Early neonatal deaths related to intrapartumevents: neonates born at term who could not beresuscitated (or for whom resuscitation was notavailable) or who had a specific birth trauma.The death must have occurred within 24 hours ofdelivery.These two subgroups should not be equated withperinatal deaths. The universally accepted definitionof perinatal death is death in the uterus after the 28thweek of pregnancy plus deaths of all liveborn infantsup to 7 days of life. This new indicator excludes maceratedstillbirths and newborns who die after the first24 h, because mothers and their infants are often dischargedat 24 h, if not earlier.At the technical consultation in 2006, it was suggestedthat this indicator include only stillbirths and neonatesweighing ≥ 2.5 kg, which is the international standard;however, countries may prefer to use 2.0 kg as theirthreshold. Many small facilities in poor countries mightnot have data on birth weight, especially of stillbirths.Accurate recording of stillbirths (fresh and macerated)and very early neonatal deaths may be an aspect ofcurrent information systems that also will require moreattention.One way of determining whether an intrapartum deathoccurred during labour is to ascertain whether the fetalheartbeat is recorded on the admission log. In practice,in facilities with high turnover and where mothersstay less than 24 hours after delivery, it may be wiseto restrict neonatal deaths to those occurring in theirfirst 6–12 hours (rather than 24 hours), because deathsoccurring after discharge will go undetected.The denominator for this indicator is ‘all women givingbirth in the EmOC facility’, which is the same numeratoras for Indicator 3 (Proportion of all births in EmOCfacilities). This denominator was chosen to facilitatedata collection and is recommended for the sake ofinternational comparability. As information systemsimprove, the denominator may become births, and theindicator will become a true rate.Supplementary studiesTesting the indicatorThis indicator should be tested, and the results withand without the birth weight restriction should becompared to determine whether 2.0 kg or 2.5 kg is thebetter threshold. If the birth weight restriction is tooonerous in terms of data collection, studies are neededto determine whether no birth weight restriction wouldaffect the death rate. Additionally, a maximum acceptablelevel for the indicator should be explored and set,if appropriate.Refining the dataOther studies that would improve understanding ofintrapartum and early neonatal <strong>care</strong> include investigationsof whether the fetal heartbeat is recorded routinelyat admission and whether stillborns are routinelyweighed and documented. It could also be importantto study the exact time of early neonatal death, whichis rarely recorded with precision.In facilities with high early neonatal and stillbirth rates,it might be useful to conduct perinatal death auditsto gain a better understanding of how to improve thequality of <strong>care</strong> (156).
36<strong>Monitoring</strong> <strong>emergency</strong> <strong>obstetric</strong> <strong>care</strong>: a handbook2.8 Indicator 8: Proportion of deaths dueto indirect causes in EmOC facilitiesDescriptionThe numerator of this new indicator is all maternaldeaths due to indirect causes in EmOC facilities duringa specific period, and its denominator is all maternaldeaths in the same facilities during the same period.Direct causes of death are those ‘resulting from <strong>obstetric</strong>complications of the pregnant state (pregnancy,labour, and puerperium), from interventions, omissions,incorrect treatment, or from a chain of eventsfrom any of the above’. Indirect causes of death resultfrom ‘previous existing disease or disease that developedduring pregnancy and which was not due todirect <strong>obstetric</strong> causes, but which was aggravated bythe physiologic effects of pregnancy’ (157).Other categories of maternal death (death after 42days postpartum, fortuitous, coincidental or incidentaldeaths) are generally not included in the calculation ofmaternal death rates or ratios, and they are excludedfor the purposes of this indicator.Acceptable levelThis indicator does not lend itself easily to a recommendedor ideal level. Instead, it highlights the largersocial and medical context of a country or region andhas implications for intervention strategies, especiallyin addition to EmOC, where indirect causes kill manywomen of reproductive age.BackgroundA substantial proportion of maternal deaths in mostcountries are due to indirect causes. This is particularlytrue where HIV and other endemic infections, such asmalaria and hepatitis, are prevalent. Too often, whereinfectious and communicable disease rates are high,the number of maternal deaths due to direct causesis also high. The causes of maternal deaths are oftenmisclassified in such cases; for example, the death ofan HIV-positive woman might be classified as due toAIDS even if it was due to a direct cause such as haemorrhageor sepsis. Most maternal deaths fall into thecategories listed in Table 9; we know even less about‘accidental or incidental’ causes of death for womenin poor countries.The most recent systematic study of the causes ofmaternal death was published in 2006 by researchersat WHO, who reviewed the literature since 1990(120). Table 10 summarizes the proportions of directand indirect causes of death by world region.Table 9. Main conditions leading to maternal deathDirect causesIndirect causesHaemorrhageHypertensive diseasesAbortionSepsis or infectionsObstructed labourEctopic pregnancyInfections (e.g. malaria, hepatitis)Cardiovascular diseasePsychiatric illnesses, including suicide and violenceTuberculosisEpilepsyDiabetesEmbolismAnaesthesia-related
<strong>Monitoring</strong> <strong>emergency</strong> <strong>obstetric</strong> <strong>care</strong>: a handbook 37Table 10. Estimates of direct and indirect causes of maternal death by regionRegionDue to indirectcausesMaternal deaths (%)Due to direct causesUnclassifiedDeveloped countries 14.4 80.8 4.8Africa 26.6 68.0 5.4Asia 25.3 68.6 6.1Latin America and the Caribbean 3.9 84.4 11.7From references (120).Data collection and qualityThe reporting of maternal deaths and their causes varieswidely and is associated with a country’s statisticaldevelopment; nevertheless, all tend to follow someversion of the International Classification of Diseases(157). In countries with well-developed statistical systems,the source of this information is the vital registrationsystem, but, as stated above, misclassificationresults in serious under-recording in official statisticsin virtually all countries. Where vital registration systemsare weak, omission and misclassification lead tounder-recording and problems of attribution of cause.Death certificates may never be filled out, or they mayfail to indicate whether pregnancy was a recent occurrence;therefore, the fact that the death was a maternaldeath goes undetected. Multiple causes of deathmay be listed, but an underlying cause may not beregistered.This is likely to be the case with regard to HIV infection.In many countries with a high prevalence ofHIV infection, the number of maternal deaths amongHIV-positive women will be underreported, until thereis universal HIV testing, serological status is reliablyrecorded and reported, and discrimination and stigmado not inhibit testing or reporting. On the one hand,HIV infection might be an underreported cause ofmaternal death. On the other, when the woman’s HIVstatus is known, the cause of death may be reportedas AIDS even though the actual cause was a direct<strong>obstetric</strong> condition.Although official statistics in resource-poor countriesare likely to include underreporting of indirect causesof death, industrialized countries also underreport.In a review of WHO databases on maternal health in1991–1993, of the 60 countries reporting vital registrationfigures for causes of maternal deaths, 33 reportedno indirect deaths (158).Collecting data for this new indicator will be difficult;however, the technical consultation considered thatit would be useful for governments and internationalagencies. In a few years, we shall review experiencewith these new indicators to see whether they are usefuland whether they should be modified.Supplementary studiesA great deal of research remains to be done in the areaof indirect maternal deaths, including on the mechanismsby which indirect conditions cause maternaldeath and programmes that could reduce them. Aswith the recording of <strong>obstetric</strong> complications, trainingstaff to comply with national standards of deathcertificate completion can result in more accurate andcomplete recording. Reviews of all deaths of womenof reproductive age in facilities, especially those whodo not die on the maternity ward, could lead to morecomplete recording. As discussed under Indicator 6,it might be useful to review maternal deaths and nearmisses to learn how to improve the quality of <strong>care</strong>.
38<strong>Monitoring</strong> <strong>emergency</strong> <strong>obstetric</strong> <strong>care</strong>: a handbook2.9 Summary and interpretation ofindicators 1–8Table 11 provides a summary of the indicators, howthey are calculated, and acceptable levels, whenappropriate. One of the benefits of using these indicatorsis that, when used as a set, they give a full pictureof a health system’s response to <strong>obstetric</strong> emergencies.Below, we discuss issues that affect the interpretationof most of the indicators, including distinguishingbetween ‘minimum or maximum’ and ‘optimum’levels, assessing the generalizability of results andworking with incomplete or poor data. The sectionalso provides examples of interpreting sets of indicatorsand ends with an exercise in interpreting the indicatorstogether.Minimum or maximum and optimum levelsAn important distinction that applies to most of theindicators is the difference between minimum ormaximum and optimum levels. By necessity, the minimumor maximum acceptable levels proposed in thismanual are approximations. Therefore, if the acceptablelevel is met for a particular indicator, this doesnot imply that the optimum level has been reached.For instance, a key assumption in setting acceptablelevels is that approximately 15% of pregnant womenexperience serious <strong>obstetric</strong> complications. If thisis an underestimate—as recent studies indicate itmay be—the maximum level for Indicator 5 (15% ofexpected births are delivered by caesarean section inEmOC facilities) may be low (159, 160). A number ofstudies have shown, however, that it is difficult or evenimpossible to measure morbidity accurately from surveys(161). Therefore, we assume (on the basis of theevidence used throughout this manual) that a countrythat achieves acceptable levels for each indicator hasa strong programme for reducing maternal deaths.Even if the minimum acceptable level for an indicatoris met at the national level, however, there may beproblems in specific areas. When the level falls belowthe minimum acceptable, one can conclude that theneed for EmOC is not being met in most areas of thecountry. The general principle is that favourable findings,while reassuring, do not justify complacency;unfavourable findings clearly indicate that action isneeded.Generalizability of resultsWhen subnational areas or facilities are selected forstudy, the generalizability of the findings may be a concern.Visiting all the facilities in an area, when possible,can have strong programmatic implications, as healthmanagers will be able to design site-specific changes.In section 3.2, on preparation for data collection, theselection of facilities for study comprises two steps:selection of areas and, within these areas, selection offacilities. If these steps are followed (i.e. the worksheetis used), bias is minimized.If it appears that, due to chance, random selectionhas produced a bias (for example, most of thefacilities selected are concentrated in one area of acertain region), this should be noted, as even biaseddata are useful if the direction of the bias is known.For instance, suppose that the EmOC facilities in thestudy were not randomly selected and were thereforemuch more likely to be located on a major road thana randomly selected group would have been. In thiscase, it is possible to say with reasonable certainlythat hospitals far from major roads are less likely thanhospitals on major roads to perform caesarean sections.Therefore, the estimate derived from the biasedsample probably presents an unrealistically favourablepicture of Indicator 5, and the situation is probablyworse than the data indicate. If the information isstill not useful for generalization, e.g. if it is not clearwhich way the bias works, the data may neverthelessbe useful for managing or evaluating health servicesin the area. To use the example above, the data mayshow that some hospitals are not providing life-savingservices such as caesarean section, even though governmentstandards state that they should. This information,by itself, can be used to guide activities toreduce maternal deaths.Incomplete or poor dataRoutine maternity record systems in many countries donot facilitate the collection of data on <strong>obstetric</strong> complications,maternal deaths, stillbirths and very earlyneonatal deaths. Often, staff has fallen out of the habitof filling in some of the columns of the maternity registeror the admissions and discharge registers. This is amanagement problem that requires attention over timeto ensure complete, accurate record keeping.
<strong>Monitoring</strong> <strong>emergency</strong> <strong>obstetric</strong> <strong>care</strong>: a handbook 39Table 11. Emergency <strong>obstetric</strong> <strong>care</strong> indicatorsIndicator Description Numerator Denominator Acceptable level1&2*Availabilityof EmOC(national orsubnational)Ratio of EmOCfacilities topopulation andgeographicaldistribution offacilitiesNo. of facilities inarea providing basicor comprehensiveEmOCNo. of facilitiesin area providingcomprehensiveEmOCPopulation ofarea dividedby 500 000Population ofarea dividedby 500 000≥ 5 EmOC facilitiesper 500 000population≥ 1 comprehensivefacility per 500 000population3 Proportionof all birthsin EmOCfacilitiesProportion of allbirths in population inEmOC facilitiesNo. of women givingbirth in EmOCfacilities in specifiedperiodExpected no.of births inarea in sameperiodRecommendedlevel to be setlocally4 Met need forEmOCProportion ofwomen with majordirect <strong>obstetric</strong>complications treatedat EmOC facilitiesNo. of womenwith majordirect <strong>obstetric</strong>complicationstreated in EmOCfacilities in specifiedperiodExpected no.of women withsevere direct<strong>obstetric</strong>complicationsin area insame period**100%5 Caesareansection as aproportionof all birthsProportion of allbirths in populationby caesarean sectionin EmOC facilitiesNo. of caesareansections in EmOCfacilities in specifiedperiodExpected no.of births inarea in sameperiod5–15%6 Direct<strong>obstetric</strong>case fatalityrateProportion ofwomen with majordirect <strong>obstetric</strong>complications whodie in EmOC facilitiesNo. of maternaldeaths due to direct<strong>obstetric</strong> causes inEmOC facilities inspecified periodNo. of womentreatedfor direct<strong>obstetric</strong>complicationsin EmOCfacilities insame period< 1%7 Intrapartumand veryearlyneonataldeath rateProportion of birthsthat result in anintrapartum or a veryearly neonatal deathwithin the first 24 h inEmOC facilitiesNo. of intrapartumdeaths (freshstillbirths; ≥ 2.5kg) and very earlyneonatal deaths(≥ 24 h; ≥ 2.5 kg) inEmOC facilities inspecified periodNo. of womengiving birthin EmOCfacilities insame periodTo be decided8 Proportionof maternaldeaths dueto indirectcausesPercentage of allmaternal deaths inEmOC facilities dueto indirect causesNo. of maternaldeaths due toindirect causes inEmOC facilities inspecified periodAll maternaldeaths (fromdirect andindirectcauses)in EmOCfacilities insame periodNone set* Indicators 1 and 2 involve the same calculations, with data on the corresponding regional population and facility insteadof aggregated national data.** Equal to 15% of expected births in the same area and period.
40<strong>Monitoring</strong> <strong>emergency</strong> <strong>obstetric</strong> <strong>care</strong>: a handbookAs stated earlier, in many countries maternity registersdo not have a column for ‘reason for admission’or ‘maternal complications’. When providers want torecord maternal complications, therefore, they have tomake a note in another column, such as ‘remarks’, orin the margin. While this may appear to be an administrativedetail, it is a strong indication of commitment toimproving maternal health. There is often room in registersto add such a column, perhaps by replacing acolumn used for uncommon events, such as multiplebirths. Persuading ministries of health (and funders) toadd this column is an important step in making theseindicators part of health management information systems.(Appendix B lists the items that should appearin facility registers.) As periodic collection of thesedata becomes part of routine programme monitoring,record keeping should improve.Data on maternal deaths, stillbirths and very early neonataldeaths are often difficult to collect for some ofthe same reasons stated above. In addition, becauseof the sensitive nature of these events, health staffmay not record them for fear of reprisal. Interventionsgeared to improve the working environment should,over time, help health staff feel more comfortableabout accurately recording deaths.As record keeping of complications, maternal deaths,stillbirths and very early neonatal deaths improves,the reported number of complications and deaths inthe facility will increase. It is critical to reassure staffthat these temporary increases will be appropriatelyinterpreted; that they will not be assumed to be theresult of poor or deteriorating patient <strong>care</strong>. One wayof identifying ‘recording bias’ is to use other indicatorsin the set as benchmarks, especially those indicatorsbased on services that are reported often and are fairlyreliable, such as the numbers of women giving birthand caesarean sections in the facility. Using the indicatorsas a set can help clarify whether the apparentincrease in complications or deaths is due to betterreporting or if it is a real increase. For example, if thereported number of women with major complicationstreated in the facility increases by 150% over 3 years,but the number of women giving birth in the facilityincreases by 75% and the number of caesarean sectionsperformed increases by 50%, it can be assumedthat some of the reported increase in complications isdue to better reporting (probably in the range of onehalf to two thirds). As the community’s confidence inthe quality of <strong>care</strong> improves and women with complicationsare more likely to be brought for treatment,many of the women will require a caesarean section;therefore, the numbers of complications and of caesareansections should rise together, unless there isa problem that limits the availability of surgery. Thisexample illustrates the kind of exploration of the datathat can be useful at local level.Relation of EmOC indicators to maternal mortalityAs noted earlier in this handbook, met need for EmOCand caesarean section as a proportion of all birthsare closely correlated with maternal mortality ratios,and it is logical that as met need goes up and thedirect <strong>obstetric</strong> case fatality rate declines, the numberof deaths in the population due to direct <strong>obstetric</strong>complications will decline as well. Maternal mortalityratios, however, are difficult to measure, especially ina relatively small area (such as a project area) or overa short period. Nevertheless, methods for capturingthe effect of maternal health programmes are continuingto improve. For example, a method for estimatingdeaths averted, based on the EmOC indicators, hasbeen proposed, although it must be tested (162). A setof tools is available at: http://www.immpact-international.org/index.php?id=67&top=60.An exercise in interpreting the indicators as a setTable 12 shows three very different scenarios forEmOC indicators. This exercise shows that such dataare directly applicable for programming. Examine thesets of indicators in the three scenarios as if you werean official of the ministry of health in country X, lookingat data from various districts of the country. Onthe basis of the hypothetical data and the acceptablelevels, identify priorities for improving the situation forwomen with <strong>obstetric</strong> complications.
<strong>Monitoring</strong> <strong>emergency</strong> <strong>obstetric</strong> <strong>care</strong>: a handbook 41Table 12. Three scenarios for <strong>emergency</strong> <strong>obstetric</strong> <strong>care</strong> (EmOC) indicators and levelsIndicatorLevelScenario 1Population 950 000Number of functioning EmOC facilities:• basic 2• comprehensive 1Geographical distribution of EmOC facilitiesMostly in district capitalProportion of all births in basic and comprehensive EmOC facilities 10%Met need for EmOC 8%Caesarean sections as a percentage of all births 0.7%Direct <strong>obstetric</strong> case fatality rate 5%Scenario 2Population 950 000Number of EmOC facilities:• basic 7• comprehensive 2Geographical distribution of EmOC facilitiesSome urban, some ruralProportion of all births in basic and comprehensive EmOC facilities 10%Met need for EmOC 8%Caesarean sections as a percentage of all births 2%Direct <strong>obstetric</strong> case fatality rate 2%Scenario 3Population 950 000Number of EmOC facilities• basic 10• comprehensive 3Geographical distribution of EmOC facilitiesSome urban, some ruralProportion of all births in basic and comprehensive EmOC facilities 25%Met need for EmOC 65%Caesarean sections as a percentage of all births 12%Direct <strong>obstetric</strong> case fatality rate 15%In Scenario 1, there are far too few functioning EmOCfacilities. For a population of nearly 1 million, thereshould be 10 such facilities, at least two of whichare comprehensive, rather than the existing three.Furthermore, the functioning facilities are mostly inurban areas. The other indicators are not very goodeither (e.g. the direct <strong>obstetric</strong> case fatality rate is toohigh at 5%), but clearly the first priority is to see whichhealth facilities can be upgraded to provide appropriate<strong>care</strong>, especially in rural areas.In Scenario 2, the number of functioning EmOC facilitiesis much higher: there are nine; two of these providecomprehensive <strong>care</strong>, and some are in rural areas.
42<strong>Monitoring</strong> <strong>emergency</strong> <strong>obstetric</strong> <strong>care</strong>: a handbookThe proportion of deliveries that take place in thesefacilities is, however, low (10%), as is the met need(8%). The direct <strong>obstetric</strong> case fatality rate is not veryhigh (at 2%), but this is not a reason for complacency,because so few women are <strong>care</strong>d for at these facilities.The highest priority here would be to find out whyuse is so low, by using a variety of methods: communityfocus groups, discussions with staff, observationof the services and a review of the record-keepingsystem.In Scenario 3, there is more than the minimum numberof EmOC facilities (13); three of these are comprehensive(rather than the minimum of two), and theyseem to be well distributed in terms of urban and ruralareas. The proportion of births in the facilities (25%of all births) and met need (65%) are fairly high. Theproportion of deliveries by caesarean section (12%) istowards the high end of the acceptable range (5–15%),and the direct <strong>obstetric</strong> case fatality rate is very high at15% (with a maximum acceptable level of 1%). In thissituation, the quality of <strong>care</strong> in the EmOC facilities isthe first concern. Clinical audits and direct observationof services would be appropriate. As met need and thedirect <strong>obstetric</strong> case fatality rate are both high in thisscenario, it is important to analyse why. For instance,women may present at the health facility very late,which is not related to the quality of the health facility.Maternal death audits and verbal autopsies presentopportunities for health managers to understand therelevant issues.
<strong>Monitoring</strong> <strong>emergency</strong> <strong>obstetric</strong> <strong>care</strong>: a handbook 433. Collecting data for the indicators3.1 Types of data requiredConstructing the EmOC indicators proposed in thisdocument requires data on the population, birth rate,and health facility. Table 13 shows how the indicatorsare composed of such data.Information on population and birth rates is availablein most countries at central level (e.g. the centralstatistical office). Gathering information on the signalfunctions, mode of childbirth, <strong>obstetric</strong> complicationsand maternal deaths, however, means visiting healthfacilities and reviewing facility registers. The emphasisis on the EmOC services that a facility actually providesrather than on what it is supposed to be able toprovide.This section lays out the steps for collecting the datanecessary for the indicators of EmOC. Table 14 gives asummary of the steps, and each is discussed in detailbelow. Sample data collection forms are to be found inAppendix A and are discussed here. In addition, suggestionsare given about additional data that can be ofuse in area monitoring3.2 PreparationMost of the data necessary for calculating these indicatorswill be collected in facilities. In a relatively smallcountry, visiting every hospital should not be too difficult,but in a large country it might not be possible.Visiting every health centre that might provide EmOC,although ideal from a programme viewpoint would bedifficult even in some small countries. Therefore, inmost countries, a subset of potential EmOC facilitieswill have to be selected for review.We hope that in a few years the kind of informationrequired for these indicators will be reported routinelyto ministries of health, in which case data for all facilitieswould be compiled and available. If this informationis available in a regular health management informationsystem, it is easier to assess the availability ofservices and make changes and improvements in thehealth system.The steps described in this section and the next willhelp in identifying a group of facilities that gives a reasonablyaccurate picture of the situation, while at thesame time not requiring an unreasonable amount ofwork. In countries where financial and human resourcesare constrained, the approach described below willsuffice to yield informative data about the maternity<strong>care</strong> system. Ensuring that the facilities selected forreview give a fairly accurate picture of the situationdepends largely on avoiding two major pitfalls: systematicbias and the effects of chance variation.Systematic bias can occur when conscious or unconsciousfactors affect the selection of facilities for study.For example, the people selecting the facilities mightwant to present the situation in the most favourablelight possible, or they might select facilities that areeasily accessible (e.g. on a paved road or near a largetown). In either case, the data collected might give anoverly favourable impression. The effects of chanceare, of course, unpredictable, but they do tend todiminish as the number of facilities studied increases.Selection is done in two stages: selecting areas of acountry for study and then selecting facilities withinthose areas. Sections 3.2.1 and 3.2.2 present a guidefor selecting areas for study at national level. Facilitieswithin those areas are selected at the area level, asdescribed in sections 3.3.1 and 3.3.2.3.2.1 Determine the number of areas to bestudiedConsider a level smaller than ‘national’. The term forthis administrative level will vary by country, e.g. state,province, but is referred to here as an ‘area’. In a fewcountries where the administrative units of ‘provinces’or ‘states’ are exceptionally large, it may be preferableto define smaller areas, e.g. district or county,for selection into the study. Alternatively, it may belogistically better to select the original administrativeunits even if they are large, but then select subareasfor study at a second stage. As a rough guide, if anarea has more than 100 hospitals (public and private),subareas may be selected; the number of subareas
44Table 13. Types of data used to construct <strong>emergency</strong> <strong>obstetric</strong> <strong>care</strong> indicatorsType of data Indicator 1Availability ofEmOC (basic andcomprehensive)Indicator 2Geographicaldistribution ofEmOC facilitiesIndicator 3Proportionof all birthsin EmOCfacilitiesIndicator 4Met need forEmOCIndicator 5Caesareansections asproportion ofall birthsIndicator 6Direct <strong>obstetric</strong>case fatality rateIndicator 7Intrapartumand very earlyneonataldeath rateExisting estimates:Population size x x x x xCrude birth rate of area x x xHealth facility data:EmOC signal functions x x x x x x x xNo. of women givingxxbirthNo. of women withxx<strong>obstetric</strong> complicationsNo. of caesareanxsectionsNo. of maternal deathsxxdue to direct <strong>obstetric</strong>causesNo. of maternal deathsxdue to indirect causesIntrapartum deaths(fresh stillbirths;≥ 2.5kg) and very earlyneonatal deaths(≤ 24h; ≥ 2.5kg) infacilityxIndicator 8Proportionof maternaldeaths dueto indirectcauses<strong>Monitoring</strong> <strong>emergency</strong> <strong>obstetric</strong> <strong>care</strong>: a handbook
<strong>Monitoring</strong> <strong>emergency</strong> <strong>obstetric</strong> <strong>care</strong>: a handbook 45studied should represent at least 30% of the total. Forthe purposes of the forms, each subarea should beconsidered an ‘area’. Professional help from a statisticianshould be sought in obtaining national estimatesin countries where subareas are selected.The following guidelines should be used to determinewhether to study all areas of a country:• If a country has 100 or fewer hospitals (public andprivate), then study all areas.• If a country has more than 100 hospitals (publicand private), then a subset of areas may beselected for study. Select as many subnationalareas as possible, but the number selected shouldbe at least 30% of the total number of subnationalareas in the country.In selecting a subset of areas, the aim should be tostudy as many areas as possible, without compromisingthe quality of the data collected. For example,if there are 21 administrative areas in a country, 10might be selected for study. Fewer can be studiedif resources are scarce, but the proportion selectedshould not be less than 30% or a minimum of sevenadministrative areas.Table 14. Guide to data collection and formsActivity Action Refer to or useSimple selection1. Select areas for study, if not national.2. Determine a single 12–month period to studyand enter on form 2 (Facility case summaryform).3. List all possible facilities in the area that mightprovide EmOC.4. If sampling is necessary, select facilities to bevisited.Sections 3.2.1, 3.2.2.Section 3.2.3.Sections 3.3–3.3.2, form 1and worksheets 1a and 1bData collection 5. Conduct site visits to facilities. Sections 3, 4 and form 2Data preparationCalculation andinterpretation ofindicators6. If a sample of facilities was visited, separatethem into health centres (or other lower-levelfacilities) and hospitals by area and then adjustthe data for area estimates.7. If all facilities in an area were surveyed,separate them into three groups by area:• actual comprehensive EmOC facilities• actual basic EmOC facilities• non-EmOC facilities8. Summarize findings for all indicatorsdisaggregated by classified level of facility (i.e.basic and comprehensive and all surveyedfacilities).9. Calculate indicators for (each) area (for EmOCfacilities and for all facilities).10. Interpret.11. Consolidate forms 1–4 (with worksheets) for allstudy areas if national.12. Calculate indicators for entire country.13. Interpret.Section 3.5, form 3 andworksheets 3a, 3b and 3c orworksheets 3d, 3e and 3fSection 3.6 and form 4Section 3.1 and text on eachindicator (section 2)Section 3.7, form 5 andworksheet 5aSection 3.1 and text on eachindicator (section 2)An area is the administrative level or geographic area in the country included in the facility survey; e.g., district,state, province.
46<strong>Monitoring</strong> <strong>emergency</strong> <strong>obstetric</strong> <strong>care</strong>: a handbook3.2.2 Random selection of areasTo avoid bias, described above, the selection of areaswithin each type must be random. The procedure forrandom selection is as follows:Step 1: Make a list of all areas in the country. The listshould be in alphabetical order, to minimize the possibilityof bias.Step 2: Assign each area a consecutive number, startingwith 1 for the first area on the list.Step 3: Calculate the ‘sampling interval’, which will tellyou to select every nth area, once the first area hasbeen selected at random. Use the following formula:Sampling interval =total number of areas in the countrydivided bynumber of areas selectedCountry W has a total of 21 areas, of which 10 are tobe selected for study, giving a sampling interval of 2(21/10 = 2.1). Sampling intervals should be rounded tothe nearest whole number. If, for example, it had beendecided that 15 of the 21 areas would be studied, thesampling interval would be 1.4, which would thereforeround down to 1, an indication that either fewer areasshould be selected for study or all areas should beincluded in the sample.Step 4: Identify the first area to be included in thesample by generating a random number that is lessthan or equal to the sampling interval but greater thanzero. This can be done with a random number table(Appendix C). To use the table, look away from thepage and touch it with the point of a pencil. The digitclosest to where the pencil touches the page is therandom number. If the digit is less than or equal to thesampling interval and greater than zero, use it; if not,read from left to right until a digit that satisfies thiscondition is reached. This number will be the first areaselected.For country W, the sampling interval is 2. Using therandom number table, our pencil point falls on the digit7, at row 22, column 5. This is larger than our samplinginterval, so we read from left to right, passing the digits0, 7 and 0, until we come to 2. Thus, area 2 on the listwill be the first area selected.Step 5: Identify all other areas to be included in thesample by adding the sampling interval to the numberof the first area and continue to select areas until thedesired number has been reached. As the first selectedarea is 2 on the list of areas, the next one would be 2plus 2, or 4, and the next 6, and so on, until 10 areashave been selected.3.2.3 Determine a nationally uniform12–month period to be studiedThe data collected from facilities will be retrospective,but the 12-month period selected should be arecent one, to ensure that the data will still be available.For comparability of data, it is important that alldata collected throughout the country be for the same12–month period. A decision about which period touse should be made at national level, and it shouldthen be entered on the top of the facility case summaryform of form 2 before it is duplicated for use. Thiswill ensure that data collected at all facilities refer tothe same period. The 12–month period can be eithera calendar year (e.g. 1 January 2010–31 December2010) or any other 12-month period (e.g. 1 June 2012–31 May 2013).Once areas have been selected for study, forms 1–4and all the worksheets should be duplicated and acomplete set given to the person coordinating theresearch in each area.3.3 Form 1: All potential EmOC facilities inselected areasThe first step in gathering the required data is to makean exhaustive, up-to-date list of all the facilities in eachselected areas that may be providing delivery andEmOC services (basic or comprehensive), as definedby the signal functions (Table 4). A facility that may beproviding EmOC services is one that is:• on the ministry of health’s list of hospitals andlower-level facilities that should be providing deliveryservices;
<strong>Monitoring</strong> <strong>emergency</strong> <strong>obstetric</strong> <strong>care</strong>: a handbook 47• on a list of private hospitals and lower level facilitiesthat might be providing at least some deliveryservices; or• known by the area medical officer as possibly providingdelivery services.The list should be as complete as possible so that noEmOC facility is overlooked; however, <strong>care</strong> should betaken to avoid double counting. Worksheets 1a and 1bcan be used for this purpose and should be used tolist all of the various facilities—hospitals, maternities,health centres, clinics and health posts—that may beproviding basic or comprehensive EmOC in the area.As each worksheet has space to list only 10 facilities, itis likely that the lists of each type of facility will be severalpages long. It is recommended that these lists bein alphabetical order to reduce any bias in the selectionprocess (see 3.3.2 below). Form 1 summarizes thenumber of facilities listed on worksheets 1a and 1b.3.3.1 Determine the number of facilities tobe reviewedIn a relatively small area, it may be possible to visitevery hospital, while in larger areas it will not. Evenin small areas, it will often be difficult to visit everylower-level facility that provides delivery services andmight be providing basic EmOC. Thus, in most areas,a subset of facilities may be selected for review. Toavoid bias, this second stage of selection should alsobe random. The criteria below can be used to decidewhether to study all facilities or to select a subset forreview.It is important to include private sector facilities in thisexercise. Therefore, countries may want to conductthe following exercise separately for public and privatefacilities.Hospitals (e.g. regional, district, rural, maternity):• If there are 25 or fewer, study all of them.• If there are more than 25, a subset can beselected. Select as many as possible, but thenumber should represent at least 30% and thereshould not be fewer than 20 facilities.Lower-level facilities (e.g. health centres, health posts,clinics):• If there are 100 or fewer, study all of them.• If there are more than 100, a subset can beselected. Select as many as possible, but thenumber should represent at least 30%.Example: In area X, there are 48 hospitals of differentlevels and types. Although 48 is greater than 25, it isdecided that it is feasible to visit all of them. There arealso 390 health centres and health posts, but it wouldbe too difficult and costly to visit all of them and a subsetof these facilities must be selected for review.If a subset of either type of facility is to be selected, thenumber to be visited must be decided. As describedabove, this number should be as large as possible inorder to minimize the effects of chance variation, andshould be at least 30% of all facilities of each type. Indetermining the number of facilities to visit, it is importantto strike a good balance between the number offacilities and the quality of the data that will be collectedfrom them. In other words, the number of facilitiesselected should be as large as possible while stillallowing for <strong>care</strong>ful data collection at each facility.Example: In area X, all 48 hospitals will be visited, and40% of the health centres and posts will be selectedfor review. Thus, 156 (0.4 x 390) health centres andposts will be selected. The percentages of selected ofhospitals and lower-level facilities in each area shouldbe recorded, so that this can be taken into accountwhen combining the information from all areas. Thisstep is not needed if the same percentage is selectedin all areas.3.3.2 Random selection of facilitiesOnce the number of facilities to be visited has beendecided, the next step is to select the actual facilities.To minimize the chance of bias, this should be donerandomly, in a procedure similar to that followed forselecting areas. If all facilities are to be visited, thisstep will not be necessary. If a subset of both hospitalsand lower-level facilities is to be selected, randomselection should be carried out separately for eachlevel. The procedure is outlined below. Random selec-
48<strong>Monitoring</strong> <strong>emergency</strong> <strong>obstetric</strong> <strong>care</strong>: a handbooktion will be done with all the lists in worksheet 1a or1b that have been filled out for the geographical areain question.Step 1: Assign each facility a consecutive number.In order to minimize the possibility of bias, facilitiesshould be listed in alphabetical order before beingnumbered.Step 2: Calculate the sampling interval, which will tellyou to select every nth facility once the first facility hasbeen selected at random. Use the following formula:Sampling interval =number of facilities in the areadivided bynumber of facilities to be selectedExample: In area X, a total of 390 health centres, ofwhich 156 are to be selected for review, produces asampling interval of 3 (390/156 = 2.5). Sampling intervalsare rounded to the nearest whole number.Step 3: Identify the first facility to be included in thesample by generating a random number that is lessthan or equal to the sampling interval but greater thanzero. This can be done using a random number table(Appendix C). To use the table, look away from thepage and touch it with the point of a pencil. The digitclosest to where the pencil touches the page is therandom number. If the digit is less than or equal tothe sampling interval and greater than zero, use it; ifnot, read from left to right until a digit that satisfiesthis condition is reached. This number will be the firstfacility selected.Example: For lower-level facilities in area X, the samplinginterval is 3. Using the random number table, ourpencil point falls on the digit 4, in row 12, column 2.This is larger than our sampling interval, so we readfrom left to right, passing the digits 0, 9 and 6, untilwe come to 1. Thus, facility 1 on the list of lower-levelfacilities will be the first area selected.Step 4: Identify all other facilities to be studied byadding the sampling interval to the number of the firstfacility. Continue to select facilities until the desirednumber has been reached. If you come to the end ofthe list in the selection process, return to the beginning,but do not count those facilities that have alreadybeen selected.Example: Since the first selected facility is 1 on thelist, the next one would be 1 plus 3, or 4, and thenext 7, and so on. Facility 388 will be the 129th facilityselected, and facility 3 will be the 130th (since facility 1has already been selected and should not be countedin the second pass through the list). Every third facilitywill continue to be selected in this way until all 156have been selected.Once the facilities to be reviewed have been selected,site visits to collect data at each facility can begin.3.4 Form 2: Review of EmOC at facilitiesA copy of form 2 should be used at each facility torecord the type and amount of services provided. Theinformation compiled on this form will enable researchstaff to determine whether a given facility is actuallyproviding EmOC services and, if it is, whether it is functioningat the basic or comprehensive level. Except fordata on population size and the crude birth rate, allthe information needed to construct the indicators iscontained in form 2.EmOC signal functionsTo determine whether the EmOC signal functions wereperformed in the past 3 months, review facility registers,observe and if necessary interview health workersin the maternity ward and other departments.• Record whether the signal function has been performedin the past 3 months and, if not, why it hasnot been performed.• Consider all the following when determiningwhether a particular signal function was available:––Is staff at facility trained to provide the service?––Are the requisite supplies and equipment present?Is the equipment functioning?––Were there cases for which the use of aparticular signal function was indicated?––Are the cadres of staff working at the facilityauthorized to perform the service?
<strong>Monitoring</strong> <strong>emergency</strong> <strong>obstetric</strong> <strong>care</strong>: a handbook 49• If a signal function was not performed in the past3 months, indicate why not, using the followingdefinitions:––Training issues:- Authorized cadre is available, but not trained;- Providers lack confidence in their skills.––Supplies and equipment issues:- Supplies or equipment are not available, notfunctional or broken;- Needed drugs are unavailable.––Management issues:- Providers demand compensation to performthis function;- Providers are encouraged to performalternative procedures;- Providers are uncomfortable or unwilling toperform the procedure for reasons unrelatedto training.––Policy issues:- The required level of staff is not posted to thisfacility in adequate numbers (or at all);- National or hospital policies do not allow thefunction to be performed.––No indication:- No woman needing this procedure came tothe facility during the period. (Before marking‘No indication’, consider the previousoptions; for example, if a site does not havesomeone trained to provide a procedure orequipment and drugs, women will not comefor the procedure.).Number of women giving birth• This is the number of women with normal vaginalbirths + the number of women with assistedvaginal deliveries + the number of caesareansections in the facility.• If breech deliveries are recorded separately, addthese as well, but remember to check that theyare not already included in normal deliveries orcaesarean sections.• Remember to count the number of women and notthe number of births (i.e. infants).Number of caesarean sections• Remember to count all <strong>emergency</strong> caesareansections and all planned or scheduled caesareansections.• Count caesarean sections performed for neonatalas well as maternal reasons.Number of women with direct <strong>obstetric</strong>complications• In order to be considered a case and to beincluded in the data, a woman must be pregnantat the time of admission, recently delivered oraborted.• Include only events of sufficient severity thatshould be treated with a life-saving procedure orare stabilized and then referred to another facility.• The patient has a clear diagnosis of any one of the<strong>obstetric</strong> complications (see Box 2).• Treatment was started before referral to anotherfacility (including stabilization).• When diagnosis of complications is not available,use the following criteria for inclusion:––Records indicate clear signs or symptoms suchas bleeding, high blood pressure, fever withdischarge and convulsions.––Records indicate definite interventions such ascaesarean section, vacuum or forceps delivery,blood transfusion, manual removal of placenta,injection of anticonvulsant or injection ofoxytocin.• Exclude women who were admitted without anydiagnosis (or clues leading to a diagnosis asmentioned above) and who received no treatmentbefore being referred to another facility.• If one patient has two diagnoses, select the moreserious one. For example, if a pregnant womanwas admitted for haemorrhage and ruptureduterus, the main diagnosis is ruptured uterus. If theinterviewer is unsure about the diagnosis, he orshe should consult the staff working in the health
50<strong>Monitoring</strong> <strong>emergency</strong> <strong>obstetric</strong> <strong>care</strong>: a handbookfacility. Remember to count the number of womenwith <strong>obstetric</strong> complications and not the numberof <strong>obstetric</strong> complications.• Abortion complications include only those withinfection or haemorrhage (see case definitions inBox 2).• Complications of abortion can result from eitherinduced or spontaneous abortion.• When searching for complications of abortion, theteam should look in female ward registers, <strong>emergency</strong>registers and maternity, labour, delivery, orward registers.Number of maternal deaths due to direct<strong>obstetric</strong> causes• The WHO definition of ‘maternal death’ should beused: “The death of a woman while pregnant orwithin 42 days of termination of pregnancy, irrespectiveof the duration or site of the pregnancy,from any cause related to or aggravated by thepregnancy or its management, but not from accidentalcauses.”• Count only maternal deaths that occurred in thefacility being studied.• The definitions of <strong>obstetric</strong> causes listed in Box 2should be referred to when filling in this section.• Maternal deaths can be difficult to find in somefacility registers. Therefore, it is very important tolook at as many sources as possible (e.g. maternityward registers, morgue record books, <strong>emergency</strong>room records).• Maternal deaths can be a sensitive issue to discusswith health workers. Sometimes it might behelpful to explain that the review is not an audit.In order to make staff feel more at ease, one canpoint out something positive about their facility (forexample, how many women they have been ableto treat).Number of indirect maternal deaths• Before filling in the form, list the major indirectcauses of maternal deaths that are relevant to thecountry under review, e.g. HIV infection, severeanaemia and malaria.Number of fresh stillbirths and very early neonataldeaths ≥ 2.5 kg• Refer to the definitions of fresh stillbirths and veryearly neonatal deaths above.• Omit very early neonatal deaths when mothersgave birth outside health facilities (i.e. in the communityor at home).• When the birthweight is unavailable, record thedeath and state that the birthweight was unknown.Collecting case summary dataDepending on the size of each facility and the qualityof its records, it may be too difficult to collect thenecessary information for the entire year directly onform 2. Therefore, two plans are presented.Plan 1 should be followed whenever possible. Thisentails completing the grid on form 2 (i.e. recording thenumber of women giving birth, each type of complication,caesarean section, maternal deaths, intrapartumdeaths and very early neonatal deaths) at the facilityduring each of the 12 months being studied.Plan 2 can be followed if the facility’s patient volumeis so large that collecting this information for all 12months would be too time-consuming (e.g. if there aremore than 10 000 deliveries per year). In this plan, asample of 4 months distributed throughout the year isused and then multiplied by three to estimate the totalnumber for the year. In countries where there are vastseasonal differences in deliveries, it may be importantto choose 4 months distributed throughout the year toaccount for this variation.3.5 Form 3: Summary of data on EmOCfacilities in an areaIf the analysis is to be conducted manually and not bycomputer, after all the sections of form 2 have beencompleted, the forms should be collected and sortedby geographical area. The next step is to summarizethe findings for each area. Form 3 is used for this purposeand has two sections, A and B, only one of whichshould be completed.
<strong>Monitoring</strong> <strong>emergency</strong> <strong>obstetric</strong> <strong>care</strong>: a handbook 51Section A which requests a straightforward summaryof the data collected from facilities, should be usedonly if all facilities in the area were visited (that is,there was no selection of facilities). Facilities shouldbe sorted into three groups on the basis of the entriesin the box entitled ‘Determination of EmOC status’on form 2. The three groups are facilities that providecomprehensive EmOC, facilities that provide basicEmOC and facilities that do not fully provide eitherbasic or comprehensive services. Worksheets 3a, 3band 3c are then used to prepare the summary.Section B should be used if a sample of facilities waschosen. It includes an intermediate step for adjustingthe data collected into estimates for all facilities in thearea. Worksheets 3d, 3e and 3f are needed to preparethis summary.Thus, one copy of form 3 will be filled out for each areaincluded in the study, completing either section A orsection B (delete the part you do not use).3.6 Form 4: Calculation of indicators foreach areaOnce the findings from site visits have been summarized,form 4 can be used to calculate the indicatorsfor each area. This form lays out the steps for usingthe information summarized in form 3 and includes asummary checklist to determine whether each indicatormeets an acceptable level.While, ultimately, the data on facilities will be aggregatedin order to calculate the indicators for the wholecountry, the area-level indicators provide useful informationfor setting programme priorities at the arealevel, and an entire set of completed forms 1–4 shouldbe maintained in the area for this purpose. Secondly,these indicators allow comparisons among study areasat the national level. Using the information obtainedfor each selected area, researchers can examine differencesin the availability of EmOC services, use andperformance in different areas of the country. This canhave important implications for policy and setting programmepriorities.3.7 Form 5: Calculation of indicators forthe countryIn order to calculate the EmOC indicators for thecountry as a whole, researchers must collect copiesof all forms 3 and 4 (including worksheets) from eachstudy area. The information needed for this final stepis summarized on form 5 and worksheet 5a. The lattersummarizes information on the number of EmOCfacilities, women giving birth, women with <strong>obstetric</strong>complications, caesarean sections, maternal deaths(direct and indirect) and intrapartum and very earlyneonatal deaths in all the areas selected.The indicators for the country as a whole are determinedon form 5. Similarly to form 4 for the calculationof indicators at the area level, a summary checklist ofacceptable levels for each indicator is provided.Once the indicators have been calculated, the last stepis interpretation. General notes on the interpretation ofEmOC indicators are included under the description ofeach indicator in the first section of this handbook.3.8 <strong>Monitoring</strong> at the area levelArea officials and planners may be interested ingreater detail than is required for national monitoring.Therefore, further questions might be added duringsite visits to facilities. This can be done by attachingan extra sheet to form 2 (Review of EmOC facilities).Some questions that might be of interest arediscussed below. It is important, however, that all thedata required for the calculation of the indicators becollected uniformly for the whole country. While questionsmay be added to form 2, none of the existingquestions should be modified or deleted. Additionalmodules useful for conducting a more extensiveneeds assessment are available at: http://www.amddprogram.org3.8.1 Level of functioning of facilitiesFor the purposes of monitoring, it is crucial that onlyfacilities that provide full basic or comprehensiveEmOC (i.e. facilities that performed all the designatedsignal functions in Table 4 in the past 3 months) beincluded in the first analysis. Area planners might also
52<strong>Monitoring</strong> <strong>emergency</strong> <strong>obstetric</strong> <strong>care</strong>: a handbookbe interested in knowing what signal functions theother facilities in the area have performed, and whichof them could potentially function as basic or comprehensiveEmOC facilities. Tables can be preparedto determine how many facilities did not performone or more signal functions, and which signal functionsfacilities they did or did not provide in the past 3months. Understanding why signal functions were notperformed is important. These investigations would beparticularly useful if the analysis of EmOC indicatorsreveals a shortage of facilities. In that case, informationabout which facilities are close to providing such <strong>care</strong>can be used in planning which facilities to upgrade. Ifa particular signal function, such as assisted vaginaldelivery, is often not performed, a policy review mightbe called for in order to ascertain who is trained to dowhat, at what level of the health system.3.8.2 Time availability of servicesAnother factor that area officials might wish to examineis whether <strong>obstetric</strong> services are available 24 h/day, 7 days/week at facilities that are already fullyfunctioning. For example, a question on the hours perday and days per week that signal functions are actuallyavailable might be added to the facility review form(form 2). As <strong>obstetric</strong> complications are unpredictable,it is important that women have access to life-savingEmOC around the clock. Analyses of local patterns inthe availability of signal functions might show that theEmOC coverage is actually lower than the number offacilities would imply. In such cases, expanding thehours when services are available is strongly recommended.3.8.3 Geographical distribution of services withinareasThe geographical distribution of EmOC facilities alsoaffects the accessibility of services. Although thenumber of facilities in an area might meet or exceedthe minimum acceptable level, smaller geographicalregions may have too few or no facilities. At the arealevel, therefore, it may be desirable to locate facilitieson a map in order to identify local areas where womendo not have access to EmOC, either because facilitiesdo not exist or because the existing facilities are notaccessible, e.g. because of poor or nonexistent roadsand bridges.3.8.4 Differences between public- and privatesectorfacilitiesHealth planners may be interested in examining differencesbetween facilities that are government-operatedand those that are managed by religious institutions,nongovernmental organizations or for-profit organizations.Such differences can have important implicationsfor programming. For example, one might wantto know the proportions of women with complicationswho receiving EmOC in public and in private facilities,or which types of facilities perform more EmOC signalfunctions. One might also examine differences in casefatality rates in hospital by type of facility. In some situations,access to services and issues of equity can berelated to facility ownership and cost of services.3.8.5 Quality of <strong>care</strong> at facilitiesAs discussed earlier, case fatality rates are a crudeindicator of the level of performance at EmOC facilities.Area researchers or administrators might thereforewish to collect additional information to gain moreinsight into the quality of <strong>care</strong> provided at selectedlocal facilities. One approach is to collect data on theinterval between the time a woman is admitted to anEmOC facility and the time she actually receives treatment,as discussed under ‘Supplementary studies’ inthe section on direct <strong>obstetric</strong> case fatality rates.Detailed case reviews or audits of both maternaldeaths and ‘near misses’ can also provide valuableinformation about the quality of <strong>care</strong>. Case reviewsand audits have the advantage of identifying problemareas within facilities and suggesting possible remedies.Some resources that can be used for studies ofthe quality of <strong>care</strong> are:• EngenderHealth and AMDD. Quality improvementfor EmOC: leadership manual and tool book(http://www.engenderhealth.org/res/offc/mac/EmOC/index.html) (163). This publication can helphealth-<strong>care</strong> providers to identify and solve theirown problems. It outlines a continuous, four-stepquality improvement process based on participa-
<strong>Monitoring</strong> <strong>emergency</strong> <strong>obstetric</strong> <strong>care</strong>: a handbook 53tory principles, with staff involvement and ownershipand focusing on clients’ rights and needs. Italso contains instruments for collecting informationand instructions for their use.• AMDD. Improving EmOC through criterionbasedaudit, 2002 (http://www.amddprogram.org/resources/CriterionBased%20AuditEN.pdf).This manual describes ‘criterion-based audit’ asa comparison of actual practice with evidencebasedstandards of <strong>care</strong>. It is used to improve clinicaland managerial practice, to make more rationaluse of scarce resources and to improve staffmorale. The audit cycle includes data collection,analysis, and a plan of action to correct deficiencies,implementation of that plan and repetitionof the cycle to measure change. Criterion-basedaudit can also be used to examine management orthe organization of services and human rights in aclinical setting.• WHO. Beyond the numbers. Reviewing maternaldeaths and complications to make pregnancysafer, 2004 (http://www.who.int/reproductivehealth/publications/btn).This book is directed athealth professionals, health-<strong>care</strong> planners andmanagers working on maternal and newbornhealth who wish to improve the quality of <strong>care</strong>provided. They should be in a position and willingto take remedial action on the basis of the findingsof these reviews. The information can be used toimprove maternal health outcomes by encouraginghealth professionals to evaluate current practicescritically and to change them if necessary. Asaction is the ultimate goal of these reviews, it isimportant that people who can implement the recommendedchanges participate actively.3.8.6 Quality of facility recordsArea-level officials should examine the method bywhich the number of women with complications isderived in the facility review forms (form 2). The formoffers two plans for arriving at this number (see discussionin section 3.4.1). Some facilities are probablytreating more women with <strong>obstetric</strong> complicationsthan their records indicate, and the final questions onthe form ask the reviewer to give an informed opinionabout the completeness of the facility’s records. Arealevelofficials might be interested in examining thereplies to this question for facilities in their area. If therecords for a number of facilities appear to be incomplete,a workshop on facility record keeping could beconducted.
54<strong>Monitoring</strong> <strong>emergency</strong> <strong>obstetric</strong> <strong>care</strong>: a handbookReferences1. UNICEF, WHO, UNFPA. Guidelines for monitoring theavailability and use of <strong>obstetric</strong> services. New York, UnitedNations Children Fund, 1997.2. Freedman LP et al. Practical lessons from globalsafe motherhood initiatives: Time for a new focus onimplementation. Lancet, 2007, 370(9595):1383-1391.3. Graham WJ. Now or never: The case for measuring maternalmortality. Lancet, 2002, 359(9307):701-704.4. Smith JB et al. Estimates of the maternal mortality ratio intwo districts of the Brong-Ahafo region, Ghana. Bulletin ofthe World Health Organization, 2001, 79:400-408.5. Stanton C, Abderrahim N, Hill K. An assessment of DHSmaternal mortality indicators. Studies in Family Planning,2000, 31(2):111-123.6. Ministère de la Santé Publique du Bénin. Evaluation desbesoins en soins obstétricaux d’urgence au Bénin – rapportfinal [Needs assessment for <strong>emergency</strong> <strong>obstetric</strong> <strong>care</strong> inBenin – final report]. Cotonou, Benin, 2003.7. AMDD Working Group on Indicators. Program note: UsingUN process indicators to assess needs in <strong>emergency</strong><strong>obstetric</strong> services: Benin and Chad. International Journal ofGynecology and Obstetrics, 2004, 86:110-120.8. Konate S, Traore, A., Gueye, A. Evaluation de la disponibilitéet de l’utilisation des services obstétricaux au Cameroun[Evaluation of the availability and use of <strong>obstetric</strong> <strong>care</strong> inCameroon]. UNFPA, IFORD, 2001.9. AMDD Working Group on Indicators. Program note: UsingUN process indicators to assess needs in <strong>emergency</strong><strong>obstetric</strong> services: Bhutan, Cameroon and Rajasthan, India.International Journal of Gynecology and Obstetrics, 2002,77(3):277-284.10. UNFPA. Making safe motherhood a reality in West Africa -using indicators to programme for results. New York, 2003.11. Ministère de la Santé Publique du Tchad. Evaluation desbesoins en soins obstétricaux d’urgence au Tchad [Needsassessment for <strong>emergency</strong> <strong>obstetric</strong> <strong>care</strong> in Chad].N’Djamena, 2003.12. Affane S. Rapport d’étude sur les indicateurs de processuspour le suivi et la surveillance de la mortalité maternelle[Report of a study on process indicators for follow-up andmonitoring of maternal mortality]. Moroni, Ministère de laSanté, 2005.13. Ministère de la Santé Publique et al. Disponibilité, utilisationet efficacité des soins obstétricaux d’urgence (SOU) enCôte d’Ivoire [Availability, use and eficcacity of <strong>emergency</strong><strong>obstetric</strong> <strong>care</strong> in Côte d’Ivoire]. Abidjan, 2001.14. Gottlieb P, Lindmark G. WHO indicators for evaluation ofmaternal health <strong>care</strong> services, applicability in least developedcountries: A case study from Eritrea. African Journalof Reproductive Health, Aug 2002, 6(2):13-22.15. Kayongo M et al. Making <strong>emergency</strong> <strong>obstetric</strong> <strong>care</strong> areality—CARE’s experiences in areas of high maternalmortality in Africa. International Journal of Gynecology andObstetrics, 2006, 92(3):308-319.16. Ministry of Public Health of the République Gabonaise.Evaluation de la disponibilité, de l’utilisation et de la qualitedes soins obstétricaux d’urgence au Gabon [Evaluation ofthe availability, use and quality of <strong>emergency</strong> <strong>obstetric</strong> <strong>care</strong>in Gabon]. Libreville, 2003.17. Fauveau V. Program note: Using UN process indicatorsto assess needs in <strong>emergency</strong> <strong>obstetric</strong> services: Gabon,Guinea-Bissau, and The Gambia. International Journal ofGynecology and Obstetrics, 2007, 96(3):233-240.18. Njie I, Kah-Janneh M. Evaluation of availability, utilisationand quality of <strong>emergency</strong> <strong>obstetric</strong> <strong>care</strong> in The Gambia:Draft report. Banjul, UNFPA (The Gambia), Department ofState for Health, 2004.19. Ministry of Health, UNFPA. Accelerating improvements inmaternal and newborn health in northern Ghana. Accra,2005.20. Ministère de la Santé Publique, Programme National deMaternité Sans Risques, UNICEF. Rapport de l’evaluationnationale des besoins en soins obstétricaux d’urgence enRépublique de Guinee [Report on the national evaluationof needs for <strong>emergency</strong> <strong>obstetric</strong> <strong>care</strong> in Guinea-Bissau].Conakry, 2004.21. Nogueira J et al. Avaliacao dos cuidados <strong>obstetric</strong>os de urgenciana Guine-Bissau [Evaluation of <strong>emergency</strong> <strong>obstetric</strong><strong>care</strong> in Guinea-Bissau]. Guinea Bissau, Ministerio de SaudePublica, UNFPA, AMDD, 2003.22. Reproductive Health Section, Ministry of Health, UNICEFKenya Country Office. Report: Emergency <strong>obstetric</strong> <strong>care</strong>service, North Eastern Province, Kenya. Nairobi, 2003.23. Pearson L, Shoo R. Availability and use of <strong>emergency</strong><strong>obstetric</strong> services: Kenya, Rwanda, Southern Sudan, andUganda. International Journal of Gynecology and Obstetrics,2005, 88(2):208-215.24. National Coordinating Agency for Population and Developmentet al. Kenya service provision assessment survey2004. Nairobi, 2005.25. Lesotho Ministry of Health and Social Welfare. Emergency<strong>obstetric</strong> <strong>care</strong> assessment report Lesotho, March-May2005. Maseru, 2005.
<strong>Monitoring</strong> <strong>emergency</strong> <strong>obstetric</strong> <strong>care</strong>: a handbook 5526. Rasolofomanana J, Ralisimalala A. Evaluation des besoinsen matière de soins obstétricaux ex néo-natals d’urgence àMadagascar [Evaluation of needs for <strong>emergency</strong> <strong>obstetric</strong><strong>care</strong> in Madagascar]. Tananarive, 2004.27. Ministry of Health. Emergency <strong>obstetric</strong> <strong>care</strong> services inMalawi, report of a nationwide assessment. Lilongwe,2005.28. Goodburn EA et al. <strong>Monitoring</strong> <strong>obstetric</strong> services: Puttingthe UN guidelines into practice in Malawi. I: Developing thesystem. International Journal of Gynecology and Obstetrics,2001, 74(2):105-117.29. Hussein J et al. <strong>Monitoring</strong> <strong>obstetric</strong> services: Puttingthe ‘UN guidelines’ into practice in Malawi: 3 years on.International Journal of Gynecology and Obstetrics, 2001,75:63-73.30. Leigh B et al. Emergency <strong>obstetric</strong> <strong>care</strong>: How do westand in Malawi? International Journal of Gynecology andObstetrics, 2008, 101(1):107-111.31. Ministère de la Santé, Division Santé de la Reproduction.Evaluation de l’offre des besoins obstétricaux d’urgence auMali [Evaluation of the availability of <strong>emergency</strong> <strong>obstetric</strong>needs in Mali]. Bamako, 2003.32. Otchere SA, Kayo A. The challenges of improving <strong>emergency</strong><strong>obstetric</strong> <strong>care</strong> in two rural districts in Mali. InternationalJournal of Gynecology and Obstetrics, 2007, 99(2):173-182.33. Faire de la Maternité Sans Risque une Réalité, UNFPA.Résultat des etudes pays sur les soins obstétricauxd’urgence [Results of country studies on <strong>emergency</strong><strong>obstetric</strong> <strong>care</strong> - Mauritania]. Nouakchott; 2001.34. Jamisse L, Eduardo M, Derveeuw M. Needs assessmenton availability and use of <strong>emergency</strong> <strong>obstetric</strong> <strong>care</strong> servicesin Sofala Province, Mozambique. Final report of the needsassessment, December, 2000. Ministério da Saúde,Direcção Nacional de Saúde, Departamento de Saúde daComunidade, 2000.35. Jamisse L et al. Assessment of the capacity of thehealth services to provide essential <strong>obstetric</strong> <strong>care</strong> inTete province, Mozambique. Final report of the needsassessment, December, 2000. Tete, Ministério da Saúde,Direcção Nacional de Saúde, Departamento de Saúde daComunidade, 2000.36. Santos C et al. Improving <strong>emergency</strong> <strong>obstetric</strong> <strong>care</strong> inMozambique: The story of Sofala. International Journal ofGynecology and Obstetrics, 2006, 94(2):190-201.37. Bailey PE, Paxton A. Program note: Using UN processindicators to assess needs in <strong>emergency</strong> <strong>obstetric</strong> services.International Journal of Gynecology and Obstetrics, 2002,76(3):299-305.38. Ministry of Health and Social Services. Report of needs assessmentfor <strong>emergency</strong> <strong>obstetric</strong>s <strong>care</strong>. Windhoek, 2006.39. AMDD Working Group on Indicators. Program note. UsingUN process indicators to assess needs in <strong>emergency</strong><strong>obstetric</strong> services: Niger, Rwanda and Tanzania.International Journal of Gynecology and Obstetrics, Oct2003, 83(1):112-120.40. UNICEF. Report on <strong>emergency</strong> <strong>obstetric</strong> <strong>care</strong> assessment:Gakoma, Kabaya, Muhororo and Nyanza health districts.Kigali, 2004.41. Kayongo M et al. Improving availability of <strong>emergency</strong><strong>obstetric</strong> <strong>care</strong> services in Rwanda—CARE’s experiencesand lessons learned at Kabgayi referral hospital.International Journal of Gynecology and Obstetrics, 2006,92(3):291-298.42. National Institute of Statistics of Rwanda. Rwanda serviceprovision assessment survey 2007. Ongoing.43. Moreira I et al. Evaluation de la disponibilité, de l’utilisationet de la qualité des soins obstétricaux d’urgence auSenegal. Rapport final (draft) [evaluation of the availability,use and quality of <strong>emergency</strong> <strong>obstetric</strong> <strong>care</strong> in Senegal.Final report (draft)]. Dakar, Ministerè de la Santé, ServiceNational de la Santé de la Reproduction, FNUAP, Universityof Colombia, 2001.44. The Sierra Leone Prevention of Maternal Mortality Program,and WHO. Assessment of district hospitals in Sierra Leonefor the delivery of safe motherhood and reproductive healthservices: A needs assessment survey report. Freetown,2002.45. Uganda Ministry of Health, UNICEF. Status of <strong>emergency</strong><strong>obstetric</strong> <strong>care</strong> in Uganda, a national needs assessment of<strong>emergency</strong> <strong>obstetric</strong> <strong>care</strong> process indicators. Kampala,2004.46. Orinda V et al. A sector-wide approach to <strong>emergency</strong> <strong>obstetric</strong><strong>care</strong> in Uganda. International Journal of Gynecologyand Obstetrics, 2005, 91(3):285-291.47. Malecela M et al. Situation analysis of <strong>emergency</strong> <strong>obstetric</strong><strong>care</strong> for safe motherhood in public health facilities inTanzania mainland. Dodoma, National Institute forMedical Research, Ministry of Health and Social Welfare,Reproductive and Child Health Section, 2006.48. National Bureau of Statistics, Macro International Inc.Tanzania service provision assessment survey 2006.Dodoma, 2007.49. Olsen Ø, Ndeki S, Norheim OF. Availability, distributionand use of <strong>emergency</strong> <strong>obstetric</strong> <strong>care</strong> in northern Tanzania.Health Policy and Planning, 2005, 20(3):167-175.50. Urasra DP et al. Are process indicators adequate to assessessential <strong>obstetric</strong> <strong>care</strong> at district level? A case study fromRufiji district, Tanzania. African Journal of ReproductiveHealth, 2005, 9(3):100-111.
56<strong>Monitoring</strong> <strong>emergency</strong> <strong>obstetric</strong> <strong>care</strong>: a handbook51. Olsen OE, Ndeki S, Norheim OF. Complicated deliveries,critical <strong>care</strong> and quality in <strong>emergency</strong> <strong>obstetric</strong> <strong>care</strong> innorthern Tanzania. International Journal of Gynecology andObstetrics, 2004, 87(1):98-108.52. Ministry of Health and Central Board of Health. A nationalassessment of <strong>emergency</strong> <strong>obstetric</strong> <strong>care</strong> services in Zambia.Lusaka, 2005.53. Ministry of Health and Child Welfare and ReproductiveHealth Unit. Assessment of coverage and utilisation ofessential <strong>obstetric</strong> <strong>care</strong> in Zimbabwe. Harare, 2000.54. Ministry of Health and Child Welfare. Assessment of maternaland neonatal health services in Zimbabwe (workingdraft). Harare, Ministry of Health and Child Welfare, UNICEF,UNFPA, WHO, 2005.55. UNFPA Bolivia. Informe final de la evaluacion de necesidadespara los cuidados obstétricos de emergencia [finalreport on the needs assessment for <strong>emergency</strong> <strong>obstetric</strong><strong>care</strong>]. La Paz, 2004.56. Bailey P. Program note: Using UN process indicators toassess needs in <strong>emergency</strong> <strong>obstetric</strong> services: Bolivia, ElSalvador and Honduras. International Journal of Gynecologyand Obstetrics, 2005, 89(2):221-230.57. Canales de Calderón R, Hernández M, Morales Velado M.Evaluación de disponibilidad y uso de cuidados obstétricosde emergencia en El Salvador [evaluation of the availabilityand use of <strong>emergency</strong> <strong>obstetric</strong> <strong>care</strong> in El Salvador]. SanSalvador, 2003.58. Ministerio de Salud Publica y Asistencia Social. Linea debase de mortalidad materna en El Salvador: Junio 2005- Mayo 2006 [baseline maternal mortality in El Salvador:June 2005 - May 2006]. San Salvador, Sistema Activo deVigilancia Epidemiologica de la Mortalidad Materna, 2006.59. Bailey P et al. <strong>Monitoring</strong> utilization and need for <strong>obstetric</strong><strong>care</strong> in the highlands of Guatemala. International Journal ofGynecology and Obstetrics, 2005, 89(2):209-217.60. Deras V, Discua F. Informe final sobre: Disponibilidad yuso de cuidados obstétricos de emergencia [final reporton the availability and use of <strong>emergency</strong> <strong>obstetric</strong> <strong>care</strong>].Tegucigalpa, 2003.61. Managua F. Maternidad segura evaluación de necesidadesen los servicios de emergencia obstétrica [safe motherhoodevaluation of the need for <strong>emergency</strong> <strong>obstetric</strong> <strong>care</strong>services]. Managua, FNUAP Managua and MINSA, 2001.62. AMDD Working Group on Indicators. Program note: usingthe UN process indicators to assess needs in <strong>emergency</strong><strong>obstetric</strong> services: Morocco, Nicaragua and Sri Lanka.International Journal of Gynecology and Obstetrics, 2003,80:222-230.63. FEMME. Reporte de la línea de base evaluación denecesidades en emergencias obstétricas [report on thebaseline evaluation of needs for <strong>emergency</strong> <strong>obstetric</strong> <strong>care</strong>].Ayacucho, CARE, 2000.64. AMDD Working Group on Indicators. Program note: usingUN process indicators to assess needs in <strong>emergency</strong><strong>obstetric</strong> services: Pakistan, Peru and Vietnam.International Journal of Gynecology and Obstetrics, 2002,78:275-282.65. Kayongo M et al. Strengthening <strong>emergency</strong> <strong>obstetric</strong> <strong>care</strong>in Ayacucho, Peru. International Journal of Gynecology andObstetrics, 2006, 92(3):299-307.66. Lobis S, Fry D, Paxton A. Program note: Applying the UNprocess indicators for <strong>emergency</strong> <strong>obstetric</strong> <strong>care</strong> to theUnited States. International Journal of Gynecology andObstetrics, 2005, 88(2):203-207.67. Mouniri H. Project collaboration agreement to supportmaternal mortality reduction in Afghanistan January2003-March 2005: End of the project report. Kabul, UNICEFAfghanistan Country Office and Columbia University/AMDD,2005.68. Programme Santé de la Reproduction. Evaluation desbesoins en soins obstétricaux et néonataux d’urgence enRépublique de Djibouti [needs assessment for <strong>emergency</strong><strong>obstetric</strong> and neonatal <strong>care</strong> in the Republic of Djibouti].Djibouti, 2005.69. Ministère de la Santé, Direction de la Population, UNFPA.Evaluation des ressources, des besoins et monitoragedes soins <strong>obstetric</strong>aux d’urgence au Maroc [evaluation ofresources, needs and monitoring of <strong>emergency</strong> <strong>obstetric</strong><strong>care</strong> in Morocco]. Rabat, 2002.70. UNICEF Karachi. Needs assessment for 9 districts inSindh Province. UNICEF Karachi and Pakistan MedicalAssociation, 2000.71. Ali M et al. Emergency <strong>obstetric</strong> <strong>care</strong> in Pakistan: Potentialfor reduced maternal mortality through improved basic<strong>emergency</strong> <strong>obstetric</strong> <strong>care</strong> facilities, services, and access.International Journal of Gynecology and Obstetrics, 2005,91(1):105-112.72. Ali M et al. Emergency <strong>obstetric</strong> <strong>care</strong> availability,accessibility and utilization in eight districts in Pakistan’sNorthwest Frontier Province. Journal of the Ayub MedicalCollege of Abbottabad, 2006, 18(4):10-15.73. Ali M, Kuroiwa C. Accurate record keeping in referral hospitalsin Pakistan’s Northwest Frontier Province and Punjab:A crucial step needed to improve maternal health. Journalof the Pakistan Medical Association, 2007, 57(9):443-446.74. Reproductive Health Program and UNICEF. Draft reportof the needs assessment for <strong>emergency</strong> <strong>obstetric</strong>s <strong>care</strong>Somaliland (NWZ). Mogadishu, 2007.75. Federal Ministry of Health and Reproductive Health Directorate.Report on: National <strong>emergency</strong> <strong>obstetric</strong> <strong>care</strong> needsassessment: October - December 2005. Khartoum, 2005.76. Kashmiry A. Final report: Baseline assessment for theFEMME project. Dushanbe, CARE Tajikistan, 2000.
<strong>Monitoring</strong> <strong>emergency</strong> <strong>obstetric</strong> <strong>care</strong>: a handbook 5777. Associates for Community and Population Research.Review of availability and use of <strong>emergency</strong> <strong>obstetric</strong> <strong>care</strong>services in Bangladesh. Dhaka, UNICEF, 2001.78. Reproductive Health Program et al. Emergency <strong>obstetric</strong><strong>care</strong> services: Inventory report. Dhaka, 2006.79. Islam MT et al. Improvement of coverage and utilizationof <strong>emergency</strong> <strong>obstetric</strong> <strong>care</strong> services in southwesternBangladesh. International Journal of Gynecology andObstetrics, 2005, 91(3):298-305.80. Wangmo D et al. Report on first phase needs assessmentin <strong>emergency</strong> <strong>obstetric</strong> <strong>care</strong> facilities and service delivery inthe district hospitals of Bhutan. Thimphu, Ministry of Healthand Education, Department of Health Services, 2000.81. Khamgaonkar M. Women’s right to life and health project,State of Maharashta, needs assessment phase. Final report.Mumbai, UNICEF, 2000.82. Pal P, Joshi S. Women’s right for life and health annualreport - Rajasthan. New Delhi, UNICEF, 2000.83. AMDD, UNFPA. Facility survey reports IPD districts ofRajasthan. Jaipur, 2000.84. Government of Rajasthan. Facility survey for <strong>emergency</strong><strong>obstetric</strong> services. Jaipur, 2000.85. Biswas AB et al. Availability and use of <strong>emergency</strong> <strong>obstetric</strong><strong>care</strong> services in four districts of West Bengal, India. Journalof Health Population and Nutrition, 2005, 23(3):266-274.86. Family Health Division of Ministry of Health and UNICEF.Needs assessment on the availability of <strong>emergency</strong> <strong>obstetric</strong><strong>care</strong> services in eastern, western and mid-western regionsof Nepal. Final report. New era. Katmandu, 2000.87. Rana TG et al. Strengthening <strong>emergency</strong> <strong>obstetric</strong> <strong>care</strong>in Nepal: The women’s right to life and health project(WRLHP). International Journal of Gynecology andObstetrics, 2007, 98(3):271-277.88. Pathak LR et al. Process indicators for safe motherhoodprogrammes: Their application and implications asderived from hospital data in Nepal. Tropical Medicine andInternational Health, 2000, 5(12):882-890.89. Family Health Bureau, Sri Lanka College of Obstetriciansand Gynaecologists, UNICEF. Needs assessment studywomen’s right to life and health project Sri Lanka. Colombo,UNICEF, 2001.90. Liabsuetrakul T et al. Emergency <strong>obstetric</strong> <strong>care</strong> in thesouthernmost provinces of Thailand. International Journalfor Quality in Health Care, 2007, 19(4):250-256.91. Save the Children. Needs assessment reports for theprovinces of Quang Tri and Thanh Hoa. Hanoi, 2000.92. Otchere SA, Binh HT. Strengthening <strong>emergency</strong> <strong>obstetric</strong><strong>care</strong> in Thanh Hoa and Quang Tri provinces in Vietnam.International Journal of Gynecology and Obstetrics, 2007,99(2):165-172.93. Technical consultation on Guidelines for monitoring theavailability and use of <strong>obstetric</strong> services. World HealthOrganization/UNFPA/UNICEF/AMDD, Geneva, 2006.94. Complications of abortion: Technical and managerialguidelines for prevention and treatment. World HealthOrganization, Geneva, 1994.95. Managing complications in pregnancy and childbirth: Aguide for midwives and doctors. (WHO/RHR/00.7). WorldHealth Organization, Geneva, 2003.96. Managing newborn problems: A guide for doctors, nurses,and midwives. Geneva, World Health Organization, 2003.97. Paxton A, Maine D, Hijab N. Using the UN process indicatorsof <strong>emergency</strong> <strong>obstetric</strong> <strong>care</strong>: Questions and answers.AMDD Workbook. New York, AMDD Program, HeilbrunnDepartment of Population and Family Health, 2003.98. Pregnancy, childbirth, postpartum and newborn <strong>care</strong>: Aguide to essential practice. World Health Organization,Geneva, 2003.99. JHPIEGO. Basic maternal and newborn <strong>care</strong>: A guide forskilled providers (BMNC) http://www.jhpiego.org/scripts/pubs/category_detail.asp?category_id=24. Accessed:December 2008.100. Maine D et al. The design and evaluation of maternal mortalityprograms. New York, Center for Population and FamilyHealth School of Public Health Columbia University, 1997.101. Campbell OMR, Graham WJ. Strategies for reducing maternalmortality: Getting on with what works. Lancet, 2006,368(9543):1284-1299.102. Paxton A et al. Global patterns in availability of <strong>emergency</strong><strong>obstetric</strong> <strong>care</strong>. International Journal of Gynecology andObstetrics, 2006, 93(3):300-307.103. Ipas and IHCAR. Deciding women’s lives are worth saving:Expanding the role of midlevel providers in safe abortion<strong>care</strong>. In: Issues in abortion <strong>care</strong>. Vol 7. Chapel Hill, Ipas,2002.104. Paxton A, Bailey P, Lobis S. The United Nations process indicatorsfor <strong>emergency</strong> <strong>obstetric</strong> <strong>care</strong>: Reflections based ona decade of experience. International Journal of Gynecologyand Obstetrics, 2006, 95(2):192-208.105. UNFPA. Faire de la maternité sans risque une réalité. Résultatsde l’enquête sur les soins <strong>obstetric</strong>aux d’urgence enMauritanie [making safe motherhood a reality: Results of asurvey of <strong>emergency</strong> <strong>obstetric</strong> <strong>care</strong> in Mauritania]. Nouakchott,2000.106. Fauveau V, Donnay F. Can the process indicators for<strong>emergency</strong> <strong>obstetric</strong> <strong>care</strong> assess the progress of maternalmortality reduction programs? An examination of UNFPAprojects 2000-2004. International Journal of Gynecologyand Obstetrics, 2006, 93(3):308-316.
58<strong>Monitoring</strong> <strong>emergency</strong> <strong>obstetric</strong> <strong>care</strong>: a handbook107. Miller S et al. Quality of <strong>care</strong> in institutionalized deliveries:The paradox of the Dominican Republic. InternationalJournal of Gynecology and Obstetrics, 2003, 82(1):89-103.108. Koblinsky M et al. Going to scale with professional skilled<strong>care</strong>. Lancet, 2006, 368(9544):1377-1386.109. Pitchforth E et al. Development of a proxy wealth index forwomen utilizing <strong>emergency</strong> <strong>obstetric</strong> <strong>care</strong> in Bangladesh.Health Policy and Planning, 2007, 22(5):311-319.110. Wilson JB et al. The maternity waiting home concept:The Nsawam, Ghana experience. International Journal ofGynecology and Obstetrics, 1997, 59 (Suppl. 2):S 165-172.111. Renaudin P et al. Ensuring financial access to <strong>emergency</strong><strong>obstetric</strong> <strong>care</strong>: Three years of experience with <strong>obstetric</strong> riskinsurance in Nouakchott, Mauritania. International Journalof Gynecology and Obstetrics, 2007, 99(2):183-190.112. Harvey SA et al. Skilled birth attendant competence: Aninitial assessment in four countries, and implications forthe safe motherhood movement. International Journal ofGynecology and Obstetrics, 2004, 87(2):203-210.113. Say L, Pattinson R, Gulmezoglu AM. WHO systematicreview of maternal morbidity and mortality: The prevalenceof severe acute maternal morbidity. Reproductive Health,2004, 1(3):1-5.114. Prual A et al. Severe maternal morbidity from direct<strong>obstetric</strong> causes in West Africa: Incidence and case fatalityrates. Bulletin of the World Health Organization, 2000,78(5):882-890.115. Bang RA et al. Maternal morbidity during labour and thepuerperium in rural homes and the need for medical attention:A prospective observational study in Gadchiroli,India. British Journal of Obstetrics and Gynecology, 2004,111(3):231-238.116. McCord C et al. Efficient and effective <strong>emergency</strong> <strong>obstetric</strong><strong>care</strong> in a rural Indian community where most deliveries areat home. International Journal of Gynecology and Obstetrics,2001, 75(3):297-307.117. Bennett TA et al. Pregnancy-associated hospitalizations inthe United States in 1991 and 1992: A comprehensive viewof maternal morbidity. American Journal of Obstetrics andGynecology, 1998, 178(2):346-354.118. The Prevention of Maternal Mortality Network. Situationanalyses of <strong>emergency</strong> <strong>obstetric</strong> <strong>care</strong>: Examples fromeleven operations research projects in West Africa SocialScience and Medicine, 1995, 40(5):657-667.119. Unsafe abortion: Global and regional estimates of incidenceof unsafe abortion and associated mortality in 2003. WorldHealth Organization, Geneva, 2007.120. Khan KS et al. WHO analysis of causes of maternal death: Asystematic review. Lancet, 2006, 367(9516):1066-1074.121. Healy J, Otsea K, Benson J. Counting abortions so thatabortion counts: Indicators for monitoring the availabilityand use of abortion <strong>care</strong> services. International Journal ofGynecology and Obstetrics, 2006, 95:209-220.122. Otsea K. Workbook for monitoring safe abortion <strong>care</strong> (SAC)service provision. Chapel Hill, North Carolina, Ipas, 2007.123. Otsea K, Tesfaye S. <strong>Monitoring</strong> safe abortion <strong>care</strong> serviceprovision in Tigray, Ethiopia: Report of a baseline assessmentin public-sector facilities. Chapel Hill, North Carolina,Ipas, 2007.124. Stanton CK et al. Reliability of data on caesarean sectionsin developing countries. Bulletin of the World Health Organization,2005, 83(6):449-455.125. WHO. Appropriate technology for birth. Lancet 1985,2(8452 ):436-437.126. Deneux-Tharaux C et al. Postpartum maternal mortalityand caesarean delivery. Obstetrics and Gynecology, 2006,108(3 Part 1):541-548.127. MacDorman MF et al. Infant and neonatal mortality forprimary caesarean and vaginal births to women with “Noindicated risk,” United States, 1998-2001 birth cohorts.Birth, 2006, 33(3):175-182.128. Villar J et al. Caesarean delivery rates and pregnancyoutcomes: The 2005 WHO global survey on maternaland perinatal health in Latin America. Lancet, 2006,367(9525):1819-1829.129. Betrán AP et al. Rates of caesarean section: Analysis ofglobal, regional and national estimates. Paediatric andPerinatal Epidemiology, 2007, 21(2):98-113.130. Essential elements of <strong>obstetric</strong> <strong>care</strong> at first referral level.World Health Organization, Geneva, 1991.131. Flamm BL. Cesarean section: A worldwide epidemic? Birth2000, 27(2):139-140.132. What is the right number of caesarean sections? (Editorial)Lancet, March 22 1997, (349):815.133. Lavender T et al. Caesarean section for non-medicalreasons at term. Cochrane Database of Systematic Reviews,2006, 3:CD004660.134. DHS Datasets and Macro International Inc. MEASUREDHS - Stat compiler created map.www.measuredhs.com.Accessed July 24, 2007.135. Encuesta Nacional de Salud Familiar FESAL 2002/03.Informe final San Salvador, Asociación DemográficaSalvadoreña, USAID 2004.136. Ronsmans C, Holtz S, Stanton C. Socioeconomic differentialsin caesarean rates in developing countries: A retrospectiveanalysis. Lancet, 2006, 368(9546):1516-1523.
<strong>Monitoring</strong> <strong>emergency</strong> <strong>obstetric</strong> <strong>care</strong>: a handbook 59137. Kalish RB, McCullough LB, Chervenak FA. Decision-makingabout caesarean delivery. Lancet, 2006, 367(9514):883-885.138. Unmet Obstetric Need Network. Tackling unmet <strong>obstetric</strong>needs. Comparative study in Benin, Burkina Faso, Haiti,Mali, Morocco, Niger, Pakistan and Tanzania. Antwerp,Institute of Tropical Medicine, 2002.139. Stanton C, Ronsmans C, the Baltimore Group on Caesarean.Recommendations for routine reporting on indicationfor cesarean delivery in developing countries. Birth, 2008,35:201-211.140. Robson MS. Classification of caesarean sections. Fetal andMaternal Medicine Review, 2001, 12:23-39.141. Bergström S. Who will do the caesareans when there is nodoctor? Finding creative solutions to the human resourcecrisis. British Journal of Obstetrics and Gynaecology, 2005,112(9):1168-1169.142. Chilopora G et al. Postoperative outcome of caesareansections and other major <strong>emergency</strong> <strong>obstetric</strong> surgery byclinical officers and medical officers in Malawi. HumanResources for Health, 2007, 5(1):17.143. Mbaruku G, Bergström S. Reducing maternal mortalityin Kigoma, Tanzania. Health Policy and Planning, 1995,10(1):71-78.144. Pereira C et al. Meeting the need for <strong>emergency</strong> <strong>obstetric</strong><strong>care</strong> in Mozambique: Work performance and histories ofmedical doctors and assistant medical officers trained forsurgery. BJOG: An International Journal of Obstetrics andGynaecology, 2007, 114(12):1530-1533.145. Ministry of Family Health and Welfare. Annual report 2006-2007. New Delhi, Government of India, 2006.146. AMDD. Improving <strong>emergency</strong> <strong>obstetric</strong> <strong>care</strong> throughcriterion-based audits. New York City, Mailman School ofPublic Health, 2002.147. Wagaarachchi PT, et al. Conducting criterion-based clinicalaudit of <strong>obstetric</strong> <strong>care</strong>: A practical field guide. Aberdeen,Dugald Baird Centre for Research on Women’s Health,2001.148. Beyond the numbers: Reviewing maternal deaths andcomplications to make pregnancy safer. World HealthOrganization, Geneva, 2004.149. Deneux-Tharaux C, Berg C. Underreporting of pregnancyrelatedmortality in the United States and Europe. Obstetricsand Gynecology, 2005, 106:684-692.151. Ifenne D et al. Improving the quality of <strong>obstetric</strong> <strong>care</strong> at theteaching hospital, Zaria, Nigeria. International Journal ofGynecology and Obstetrics, 1997, 59 (Suppl 2):S.37-46.152. Say L, Souza J, Pattinson R. Severe acute maternal mortalityor near miss - towards a standard tool for monitoringquality of maternal health <strong>care</strong>. Best Practice and ResearchClinical Obstetrics and Gynaecology, in press.153. Fauveau V. New indicator of quality of <strong>emergency</strong> <strong>obstetric</strong>and newborn <strong>care</strong>. Lancet, 2007, 370(9595):1310-1310.154. Lawn J, Shibuya K, Stein C. No cry at birth: Globalestimates of intrapartum stillbirths and intrapartum-relatedneonatal deaths Bulletin of the World Health Organization,2005, 83(6):409-417.155. Lawn J. 4 million neonatal deaths: When? Where? Why?Lancet, 2005, 365:891-900.156. Pattinson R, ed. Saving babies: A perinatal <strong>care</strong> survey ofSouth Africa 2000. Pretoria: Medical Research Council;2000.157. International Statistical Classification of Diseases andRelated Health Problems. Tenth Revision (ICD-10). Geneva:World Health Organization, 1992.158. AbouZahr C. Maternal mortality overview. In: Murray CJ,Lopez AD, eds. Health dimensions of sex and reproductionGeneva, WHO, 1998:111-164.159. Bhatia JC, Cleland J. Obstetric morbidity in south India:Results from a community survey. Social Science andMedicine, 1996, 43(10):1507-1516.160. Koblinsky MA. Beyond maternal mortality - magnitude,interrelationship and consequences of women’s health,pregnancy-related complications and nutritional status onpregnancy outcomes. International Journal of Gynecologyand Obstetrics, 1995, 48(Suppl 1):S21-S32.161. Fortney J, Smith J. The base of the iceberg: Prevalence andperceptions of maternal morbidity in four developing countries.Research Triangle Park, North Carolina, Family HealthInternational, 1996.162. Maine D et al. Research note: Estimating maternal deathsaverted: A field-based methodology. International Journal ofGynecology and Obstetrics, 2005, 89(2):218-220.163. EngenderHealth and AMDD. Quality improvement for <strong>emergency</strong><strong>obstetric</strong> <strong>care</strong>: Leadership manual and toolbook. NewYork City, EngenderHealth, 2003.150. Edson W et al. Safe motherhood studies--timelinessof in-hospital <strong>care</strong> for treating <strong>obstetric</strong> emergencies:Results from Benin, Ecuador, Jamaica, and Rwanda.Operations research results. Washington, D.C., QualityAssurance Project, United States Agency for InternationalDevelopment, 2006.
<strong>Monitoring</strong> <strong>emergency</strong> <strong>obstetric</strong> <strong>care</strong>: a handbook61Appendix A: Forms and worksheets for data collection and calculation ofEmOC indicatorsForm 1Worksheet 1aWorksheet 1bForm 2Form 3Worksheet 3aWorksheet 3bWorksheet 3cWorksheet 3dWorksheet 3eWorksheet 3fForm 4Form 5Worksheet 5aList of possible EmOC facilitiesList of health centres, health clinics and health postsList of hospitalsReview of potential EmOC facilitiesSummary of data on EmOC facilities in areaSummary of reviews of basic EmOC facilitiesSummary of reviews of comprehensive EmOC facilitiesSummary of reviews of non-EmOC facilitiesSummary of health centres, health clinics and health postsSummary of hospitalsArea-wide estimates of EmOCCalculation of indicators for areasCalculation of indicators for a countryAmount of EmOC services and number of women giving birth (births), women with complications,caesarean sections, maternal deaths, intrapartum deaths and very early neonatal deathThese forms are useful for collecting information. The format can be adapted if necessary. It is important that all the data becollected in order to have a complete picture of the services available and services needed.
62 This page has been left blank
<strong>Monitoring</strong> <strong>emergency</strong> <strong>obstetric</strong> <strong>care</strong>: a handbook 63Form 1. Possible EmOC facilities1. Name of area2. Population of area3. Crude birth rate of area4. Form completed by (list name and title)5. Form completed on (date)Worksheets 1a–1b need to be completed before filling in the total below.6. Total number of health centres, health clinics and health posts7. Total number of hospitals
64 This page has been left blank
Worksheet 1a. List of health centres, health clinics and health postsArea (province, region, district, etc.) _____________________________________________________________This worksheet should be used to list all facilities that provide some maternity <strong>care</strong> but are not hospitals, including health centres, health clinics and health posts.The easiest way to organize this information is to create a table in Excel or another software package.Facility name Location Type of facility (health centre, clinic) Ownership (government, private, mission)Total number of facilities that are not hospitals but offer some maternity <strong>care</strong><strong>Monitoring</strong> <strong>emergency</strong> <strong>obstetric</strong> <strong>care</strong>: a handbook 65
66 This page has been left blank
Worksheet 1b. List of hospitalsArea (province, region, district): _____________________________________________________________This worksheet should be used to list all hospitals that provide maternity <strong>care</strong>. The easiest way to organize this information is to create a table in Excel or another software package.Facility name Location Type of facility(district hospital, regional hospital)Ownership (government, private, mission)Total number of hospitals offering maternity <strong>care</strong><strong>Monitoring</strong> <strong>emergency</strong> <strong>obstetric</strong> <strong>care</strong>: a handbook 67
68 This page has been left blank
<strong>Monitoring</strong> <strong>emergency</strong> <strong>obstetric</strong> <strong>care</strong>: a handbook 69Form 2. Review of possible EmOC facilitiesIdentificationFacility nameDistrict name (or othersubnational area)Region name (or othersubnational area)Date of data collectionDay Month Year NameInterviewerAdapt the following lists of options to the local situation.Type of facility: (circle one)1. National hospital 2. Regional hospital 3. District hospital 4. Maternity5. Health centre 6. Clinic 7. Other: specify__________________________Type of operating agency: (circle one)1. Government 2. Private 3. Nongovernmental organization 4. Religious mission5. Other: specify__________________EmOC signal functionsAnswer the following questions about EmOC signal functions by reviewing facility registers, through observation and if necessaryinterviewing health workers in the maternity ward and other departments. Record whether the function has been performed in the past3 months, and if not, why it has not been performed.Consider all of the following when determining whether a particular signal function was performed:• Are staff at the facility trained to provide the service?• Are the requisite supplies and equipment present? Is the equipment functioning?• Were there no cases for which the use of a particular signal function was indicated?• Are the cadres of staff working at the facility authorized to perform the service?
70 This page has been left blank
<strong>Monitoring</strong> <strong>emergency</strong> <strong>obstetric</strong> <strong>care</strong>: a handbook 71Performance of signal functionsItem(a) Administer parenteral antibiotics(b) Administer uterotonic drugs(e.g. parenteral oxytocin, ergometrin,misoprostol)(c) Administer parenteralanticonvulsants for pre-eclampsia andeclampsia (e.g. magnesium sulfate)(d) Perform manual removal of placenta(e) Perform removal of retainedproducts (e.g. manual vacuumaspiration, dilation and curettage)(f) Perform assisted vaginal delivery(e.g. vacuum extraction, forcepsdelivery)Performed in past3 months? 0. No 1. Yes 0. No 1. Yes 0. No 1. Yes 0. No 1. Yes 0. No 1. Yes 0. No 1. YesIf not performed in past 3 months, why? 1. Training issues 2. Supplies, equipment, drugs issue 3. Management issue 4. Policy issues 5. No indication 1. Training issues 2. Supplies, equipment, drugs issue 3. Management issue 4. Policy issues 5. No indication 1. Training issues 2. Supplies, equipment, drugs issue 3. Management issue 4. Policy issues 5. No indication 1. Training issues 2. Supplies, equipment, drugs issue 3. Management issue 4. Policy issues 5. No indication 1. Training issues 2. Supplies, equipment, drugs issue 3. Management issue 4. Policy issues 5. No indication 1. Training issues 2. Supplies, equipment, drugs issue 3. Management issue 4. Policy issues 5. No indication
72 This page has been left blank
<strong>Monitoring</strong> <strong>emergency</strong> <strong>obstetric</strong> <strong>care</strong>: a handbook 73Item(g) Perform newborn resuscitation(e.g. with bag and mask)(h) Perform blood transfusion(i) Perform surgery(e.g. caesarean section)Performed in past3 months? 0. No 1. Yes 0. No 1. Yes 0. No 1. YesIf not performed in past 3 months, why? 1. Training issues 2. Supplies, equipment, drugs issue 3. Management issue 4. Policy issues 5. No indication 1. Training issues 2. Supplies, equipment, drugs issue 3. Management issue 4. Policy issues 5. No indication 1. Training issues 2. Supplies, equipment, drugs issue 3. Management issue 4. Policy issues 5. No indicationTraining issues: Authorized cadre is available but not trained, or there is lack of confidence in providers’ skills.Supplies, equipment issue: Supplies or equipment are not available, not functional or broken, or needed drugs are unavailable.Management issues: Providers desire compensation to perform this function, providers are encouraged to perform alternativeprocedures, or providers uncomfortable or unwilling to perform procedure for reasons unrelated to training.Policy issues: Required level of staff is not posted to this facility in adequate numbers (or at all), or national or hospital policies donot allow function to be performed.No indication: No client needing this procedure came to the facility during this period.Determination of EmOC statusUse the questions above on the performance of signal functions. Check only one category below.If all questions a–i = Yes, tick_____ comprehensive EmOCIf all questions a–g = Yes, tick_____ basic EmOCIf any questions a–g = No, tick_____ non-EmOC
74 This page has been left blank
Form 2 (continued)Facility case summary Facility nameComplete the following chart by reviewing facility registers and counting the number of women giving birth, the number of caesarean sections, the number of women with <strong>obstetric</strong>complications, the number of maternal deaths and the number of intrapartum and very early neonatal deaths.Data collection plan 1: For facilities in which fewer than 10 000 women give birth per year, data for all 12 months are the most useful.Data collection plan 2: If more than 10 000 women give birth per year, select 4 months that provide a good distribution of data throughout the year (e.g. months 1, 4, 7 and 10).For more information on plan 2, refer to section 3.4.1 of the handbook.EmOC indicator dataMonth (write the name of amonth above each number)Year 1 2 3 4 5 6 7 8 9 10 11 12 Total 1No. of women giving birth (normalvaginal, assisted vaginal, breechand caesarean)No. of caesarean sectionsDirect <strong>obstetric</strong> complicationsHaemorrhage (ante- andpostpartum)Obstructed or prolonged labourRuptured uterusPostpartum sepsis<strong>Monitoring</strong> <strong>emergency</strong> <strong>obstetric</strong> <strong>care</strong>: a handbook 75
76 This page has been left blank
Month (write the name of amonth above each number)Year 1 2 3 4 5 6 7 8 9 10 11 12 Total 1Severe pre-eclampsia oreclampsiaComplications of abortion(with haemorrhage or sepsis)Ectopic pregnancyTotal no. of direct <strong>obstetric</strong>complications(add each column)Other <strong>obstetric</strong> complications notlisted above or not specified; listsome of the causes, if specified,in the space below:<strong>Monitoring</strong> <strong>emergency</strong> <strong>obstetric</strong> <strong>care</strong>: a handbook 77
78 This page has been left blank
Year 1 2 3 4 5 6 7 8 9 10 11 12 Total 1Maternal deaths fromdirect <strong>obstetric</strong> causesHaemorrhage(ante- and postpartum)Obstructed or prolongedlabourRuptured uterusPostpartum sepsisSevere pre-eclampsia oreclampsiaComplications of abortion(with haemorrhage or sepsis)Ectopic pregnancyTotal no. of maternaldeaths from direct<strong>obstetric</strong> causes(add each column)Other maternal deaths dueto direct <strong>obstetric</strong> causes,other than those listed aboveor not specified; list some ofthe causes, if specified, inthe space below:<strong>Monitoring</strong> <strong>emergency</strong> <strong>obstetric</strong> <strong>care</strong>: a handbook 79
80 This page has been left blank
Year 1 2 3 4 5 6 7 8 9 10 11 12 Total 1Indirect maternal deaths: List causes of indirect <strong>obstetric</strong> complications and maternal deaths that are relevant for the local context (e.g. HIV, severe anaemia, malaria)Indirect maternal death(put relevant cause here)Indirect maternal death(put relevant cause here)All other indirect maternaldeathsStillbirths and neonatal deathsIntrapartum deaths (freshstillbirths) ≥ 2.5 kgVery early neonatal deaths(≥ 24 h) ≥ 2.5 kg1If plan 2 was selected (i.e. only 4 months of data were collected), multiply the total of 4 months by 3 to estimate the data for 12 months.<strong>Monitoring</strong> <strong>emergency</strong> <strong>obstetric</strong> <strong>care</strong>: a handbook 81
82 This page has been left blank
<strong>Monitoring</strong> <strong>emergency</strong> <strong>obstetric</strong> <strong>care</strong>: a handbook 83Quality of informationItemIn your informed opinion (e.g. from talking to staff, looking at therecord system), what proportion of complications treated in thefacility are recorded on this form?(tick one)In your informed opinion (from talking to staff, looking at the recordsystem, etc.), what proportion of the maternal deaths that occurredin the facility are recorded on this form?(tick one)Responses None Some (less than half) Most (more than half) All None Some Most AllWhat sources of data were used to complete this form? (e.g. maternity ward register, delivery book, general admissionsregister, operating theatre register, female ward register, discharge register).Type of register used Yes NoMaternity ward registerDelivery register or bookGeneral admissions registerOperating theatre registerFemale ward registerDischarge registerOther:Other:
84 This page has been left blank
<strong>Monitoring</strong> <strong>emergency</strong> <strong>obstetric</strong> <strong>care</strong>: a handbook 85Form 3. Summary of data on EmOC facilities in the areaThis form summarizes all the data on facilities within the geographical area that have been entered in all sections of form 2.One copy of form 3 should be completed for each area.Name of areaPopulation size of areaCrude birth rate (no. of births per 1000 population) of areaExpected births in area[(crude birth rate of area ÷ 1000) x Population size of area]Complete either section A or section B on the following page. The other section can then be deleted.If all facilities in the area were visited, complete section A only (and delete section B).If a subset of facilities in the area were selected, complete section B only (and delete section A).
86 This page has been left blank
<strong>Monitoring</strong> <strong>emergency</strong> <strong>obstetric</strong> <strong>care</strong>: a handbook 87Section A:Use worksheets 3a–c on the following pages to complete the table below.In a 12–month period Column 1Column 2Column 3Column 4Column 5Basic EmOCfacilitiesComprehensiveEmOC facilitiesTotal no.of EmOCfacilities(column 1+column 2)Non-EmOCfacilitiesTotal no. offacilitiessurveyed(column 3 +column 4)No. of facilitiesNo. of women giving birthNo. of women withcomplicationsNo. of caesarean sectionsNo. of maternal deaths fromdirect <strong>obstetric</strong> causesNo. of maternal deaths fromindirect causesNo. of intrapartum deaths(fresh stillbirths; ≥ 2.5 kg)+ No. of very early neonataldeaths (≤ 24 h; ≥ 2.5 kg)
88 This page has been left blank
<strong>Monitoring</strong> <strong>emergency</strong> <strong>obstetric</strong> <strong>care</strong>: a handbook 89Section B:Use worksheets 3d–f to complete the table below.In 12–month period: Column 1Column 2Column 3Column 4Column 5Basic EmOCfacilitiesComprehensiveEmOC facilitiesTotal no. ofEmOC facilities(column 1+column 2)Non-EmOCfacilitiesTotal no. offacilitiessurveyed(column 3 +column 4)No. of facilitiesNo. of women giving birthNo. of women withcomplicationsNo. of caesarean sectionsNo. of maternal deathsfrom direct <strong>obstetric</strong>causesNo. of maternal deathsfrom indirect causesNo. of intrapartum deaths(fresh stillbirths; ≥ 2.5 kg)+ No. of very early neonataldeaths (≤ 24 h; ≥ 2.5 kg)
90 This page has been left blank
Worksheet 3a. Summary of reviews of basic EmOC facilitiesArea: ______________________________________________This worksheet summarizes the data collected on form 2 from all basic EmOC facilities. Use form 2 to identify all basic EmOC facilities.Attach additional sheets if necessary.Excel or another software package can be used for this summary.Column 1 Column 2 Column 3 Column 4 Column 5 Column 6 Column 7FacilityNo. of women givingbirthNo. of women withcomplicationsNo. of caesareansectionsNo. of maternal deathsfrom direct <strong>obstetric</strong>causesNo. of maternal deathsfrom indirect causesNo. of intrapartumdeaths (fresh stillbirths;≥ 2.5 kg) + No.of very early neonataldeaths(≤ 24 h; ≥ 2.5 kg)Column totals**If more than one sheet was used, add sheet totals to obtain the overall total.Total number of basic EmOC facilities listed in column 1 =<strong>Monitoring</strong> <strong>emergency</strong> <strong>obstetric</strong> <strong>care</strong>: a handbook 91
92 This page has been left blank
Worksheet 3b. Summary of reviews of comprehensive EmOC facilitiesArea: ______________________________________________This worksheet summarizes the data collected on form 2 from all comprehensive EmOC facilities. Use form 2 to identify all comprehensive EmOC facilities.Attach additional sheets if necessary. Excel or another software package can be used for this summary.Column 1 Column 2 Column 3 Column 4 Column 5 Column 6 Column 7FacilityNo. of women givingbirthNo. of women withcomplicationsNo. of caesareansectionsNo. of maternal deathsfrom direct <strong>obstetric</strong>causesNo. of maternal deathsfrom indirect causesNo. of intrapartumdeaths (fresh stillbirths;> 2.5 kg) + No.of very early neonataldeaths (≤ 24 hours;> 2.5 kg)Column totals**If more than one sheet was used, add sheet totals to obtain the overall total.Total number of comprehensive EmOC facilities listed in column 1 =<strong>Monitoring</strong> <strong>emergency</strong> <strong>obstetric</strong> <strong>care</strong>: a handbook 93
94 This page has been left blank
Worksheet 3c. Summary of reviews of non-EmOC facilitiesArea: ______________________________________________This worksheet summarizes the data collected on form 2 from all non-EmOC facilities. Use form 2 to identify all non-EmOC facilities.Attach additional sheets if necessary. Excel or another software package can be used for this summary.Column 1 Column 2 Column 3 Column 4 Column 5 Column 6 Column 7FacilityNo. of women givingbirthNo. of women withcomplicationsNo. of caesareansectionsNo. of maternal deathsfrom direct <strong>obstetric</strong>causesNo. of maternal deathsfrom indirect causesNo. of intrapartumdeaths (fresh stillbirths;≥ 2.5 kg) + No.of very early neonataldeaths(≤ 24 h; ≥ 2.5 kg)Column totals** If more than one sheet was used, add sheet totals to obtain the overall total.Total number of non-EmOC facilities listed in column 1 =<strong>Monitoring</strong> <strong>emergency</strong> <strong>obstetric</strong> <strong>care</strong>: a handbook 95
96 This page has been left blank
Worksheet 3d. Summary of health centres and other lower-level facilitiesArea: ______________________________________________This worksheet summarizes data collected on form 2 from all health centres and other lower-level facilities in a geographical area. Use form 2 to identify the EmOC status of the healthcentres and other lower-level facilities visited. Attach additional sheets if necessary. Excel or another software package can be used for this summary.Column 1 Column 2 Column 3 Column 4 Column 5 Column 6 Column 7 Column 8FacilityEmOC status(basic,comprehensive ornone)No. of womengiving birthNo. of women withcomplicationsNo. of caesareansectionsNo. of maternaldeaths from direct<strong>obstetric</strong> causesNo. of maternaldeaths fromindirect causesNo. of intrapartumdeaths (fresh stillbirths;(≥ 2.5 kg)+ No. of very earlyneonatal deaths(≤ 24 h; ≥ 2.5 kg)Column totals** If more than one sheet was used, add sheet totals to obtain the overall totalTotal number of basic EmOC facilities listed in column 2 =Total number of comprehensive EmOC facilities listed in column 2 =Total number of non-EmOC facilities listed in column 2 =<strong>Monitoring</strong> <strong>emergency</strong> <strong>obstetric</strong> <strong>care</strong>: a handbook 97
98 This page has been left blank
Worksheet 3e. Summary of hospitalsArea: ______________________________________________This worksheet summarizes data collected on form 2 from all hospitals in a geographical area. Use form 2 to identify the EmOC status of the hospitals visited.Attach additional sheets if necessary. Excel or another software package can be used for this summary.Column 1 Column 2 Column 3 Column 4 Column 5 Column 6 Column 7 Column 8FacilityEmOC status(basic, comprehensiveor none)No. of womengiving birthNo. of women withcomplicationsNo. of caesareansectionsNo. of maternaldeaths from direct<strong>obstetric</strong> causesNo. of maternaldeaths fromindirect causesNo. of intrapartumdeaths (fresh stillbirths;≥ 2.5 kg) +No. of very earlyneonatal deaths(≤ 24 h; ≥ 2.5 kg)Column totals**If more than one sheet was used, add sheet totals to obtain the overall total.Total number of basic EmOC facilities listed in column 2 =Total number of comprehensive EmOC facilities listed in column 2 =Total number of non-EmOC facilities listed in column 2 =<strong>Monitoring</strong> <strong>emergency</strong> <strong>obstetric</strong> <strong>care</strong>: a handbook 99
100 This page has been left blank
<strong>Monitoring</strong> <strong>emergency</strong> <strong>obstetric</strong> <strong>care</strong>: a handbook 101Worksheet 3f. Area-wide estimates of EmOCArea: ______________________________________________This worksheet allows conversion of the data from the subset of facilities that were selected for site visits into estimatesfor the entire area.If a subset of health centres (and other lower-level facilities) were selected for study:No. of health centres (or other) visited in areaTotal no. of health centres (or other) in areaProportion of health centres (or other) for which data were collected (No. of health centresvisited in area ÷ Total no. of health centres in area)Use worksheet 3d for the health centres (and other lower-level facilities) studied.Totals fromfacilities visited÷ Proportion ofhealth centresvisited(see chart above)Estimated no. of basic EmOC facilities ÷ =Estimated no. of comprehensive EmOC facilities ÷ =Estimated no. of non-EmOC facilities ÷ == Estimate forareaEstimated no. of women giving birth in facilitiesclassified as basic and comprehensive facilitiesEstimated no. of women giving birth in facilitiesclassified as non-EmOC facilitiesEstimated no. of women with complications infacilities classified as basic and comprehensivefacilitiesEstimated no. of women with complications infacilities classified as non-EmOC facilitiesEstimated no. of caesarean sections in facilitiesclassified as basic and comprehensive facilitiesEstimated no. of caesarean sections in facilitiesclassified as non-EmOC facilitiesEstimated no. of maternal deaths from direct<strong>obstetric</strong> causes in facilities classified as basic andcomprehensive÷ =÷ =÷ =÷ =÷ =÷ =÷ =
102 This page has been left blank
<strong>Monitoring</strong> <strong>emergency</strong> <strong>obstetric</strong> <strong>care</strong>: a handbook 103Estimated no. of maternal deaths from direct<strong>obstetric</strong> causes in facilities classified as providingnon-EmOCEstimated no. of maternal deaths from indirectcauses in facilities classified as basic andcomprehensiveEstimated no. of maternal deaths from indirectcauses in facilities classified as providing non-EmOCEstimated no. of intrapartum deaths (freshstillbirths; ≥ 2.5 kg) and very early neonatal deaths(≤ 24 h; ≥ 2.5 kg) in facilities classified as basicand comprehensiveEstimated no. of intrapartum deaths (freshstillbirths; ≥ 2.5 kg) and very early neonataldeaths (≤ 24 h; ≥ 2.5 kg) in facilities classified asproviding non-EmOCTotals fromfacilities visited÷ Proportion ofhealth centresvisited(see chart above)÷ =÷ =÷ =÷ =÷ == Estimate forareaIf a sub-set of hospitals was selected for study:No. of hospitals visited in areaTotal no. of hospitals in areaProportion of hospitals for which data were collected above (No. of hospitals visited in area ÷Total no. of hospitals in area)
104 This page has been left blank
<strong>Monitoring</strong> <strong>emergency</strong> <strong>obstetric</strong> <strong>care</strong>: a handbook 105Use worksheet 3e for the hospitals studied.Totals fromfacilities visited÷ Proportion of hospitalsvisited (seechart above)Estimated no. of basic EmOC facilities ÷ =Estimated no. of comprehensive EmOC facilities ÷ =Estimated no. of non-EmOC facilities ÷ == Estimate forareaEstimated no. of women giving birth in facilitiesclassified as basic and comprehensiveEstimated no. of women giving birth in facilitiesclassified as providing non-EmOCEstimated no. of women with complications infacilities classified as basic and comprehensiveEstimated no. of women with complications infacilities classified as providing non-EmOCEstimated no. of caesarean sections in facilitiesclassified as basic and comprehensiveEstimated no. of caesarean sections in facilitiesclassified as providing non-EmOCEstimated no. of maternal deaths from direct<strong>obstetric</strong> causes in facilities classified as basic andcomprehensiveEstimated no. of maternal deaths from direct<strong>obstetric</strong> causes in facilities classified as providingnon-EmOCEstimated no. of maternal deaths from indirectcauses in facilities classified as basic andcomprehensiveEstimated no. of maternal deaths from indirectcauses in facilities classified as providing non-EmOCEstimated no. of intrapartum deaths (freshstillbirths; ≥ 2.5 kg) and of very early neonataldeaths (≤ 24 h; ≥ 2.5 kg) in facilities classified asbasic and comprehensiveEstimated no. of intrapartum deaths (freshstillbirths; ≥ 2.5 kg) and of very early neonataldeaths (≤ 24 h; ≥ 2.5 kg) in facilities classified asproviding non-EmOC÷ =÷ =÷ =÷ =÷ =÷ =÷ =÷ =÷ =÷ =÷ =÷ =
106 This page has been left blank
Form 4. Calculation of indicators for geographic areaUse form 3, section A or B, to calculate the indicators below.Area: ____________________Indicator 1: Availability of EmOCIs acceptable level met?Total no. of basic +comprehensive EmOCfacilities in areaPopulation of areaIndicator 1aNo. of EmOC facilities per 500 000populationMinimum acceptable level≥ 5 per 500 000 population( ÷ ) X 500 000 =Total no. of comprehensiveEmOC facilities in areaPopulation of area( ÷ ) X 500 000 =Indicator 1bNo. of comprehensive EmOC facilitiesper 500 000 populationo Meto Not metMinimum acceptable level≥ 1 per 500 000 populationo Meto Not met<strong>Monitoring</strong> <strong>emergency</strong> <strong>obstetric</strong> <strong>care</strong>: a handbook 107
108 This page has been left blank
<strong>Monitoring</strong> <strong>emergency</strong> <strong>obstetric</strong> <strong>care</strong>: a handbook 109Indicator 2: Geographical distribution of EmOC facilitiesThis indicator is generally intended for use at the national level. In large areas (e.g. with millions of inhabitants), it is reasonableto calculate the distribution of EmOC facilities for subareas. This can be done by repeating the steps above (in Indicator 1), andthen calculating the percentage of subareas meeting the minimum acceptable levels. The minimum acceptable level for thisindicator is 100%.Another option is to lay the facilities in the area on a map that shows roads and topographic areas, to identify problems of accessand showing referral systems. This can be done with a geographical information system or another mapping method.
110 This page has been left blank
Indicator 3: Proportion of all births in EmOC facilities and all surveyed facilitiesTotal no. of women giving birth inEmOC facilities in areaExpected births in areaIndicator 3aProportion of births in EmOC facilitiesMinimum acceptablelevel: targets to be setlocally÷ = _________ x 100 = ________ %o Meto Not metTotal no. of women giving birth inall surveyed facilities in areaExpected births in areaIndicator 3bProportion of births in all surveyed facilitiesMinimum acceptablelevel: targets to be setlocally÷ = _________ x 100 = ________ %o Meto Not met<strong>Monitoring</strong> <strong>emergency</strong> <strong>obstetric</strong> <strong>care</strong>: a handbook 111
112 This page has been left blank
Indicator 4: Met need for EmOCTotal no. of women withcomplications in EmOCfacilities in areaExpected births in areaIndicator 4aProportion of women estimated to have<strong>obstetric</strong> complications who are treated inEmOC facilitiesAcceptable level = 100%÷ ( X 0.15* ) = ______ x 100 = ______ %oMetoNot metTotal no. of women withcomplications in all surveyedfacilities in areaExpected births in areaIndicator 4bProportion of women estimated to have<strong>obstetric</strong> complications who are treated inall surveyed facilitiesoNo target÷ ( X 0.15* ) = ______ x 100 = ______ % oNot applicable* Expected births are multiplied by 0.15 to estimate the total <strong>obstetric</strong> complications in the population.<strong>Monitoring</strong> <strong>emergency</strong> <strong>obstetric</strong> <strong>care</strong>: a handbook 113
114 This page has been left blank
116 This page has been left blank
Indicator 6: Direct <strong>obstetric</strong> case fatality rateTotal no. of maternal deaths fromdirect <strong>obstetric</strong> causes in EmOCfacilities in areaTotal no. of women with<strong>obstetric</strong> complications inEmOC facilities in areaIndicator 6aDirect <strong>obstetric</strong> case fatality rate in EmOC facilitiesAcceptable level:≤ 1%÷ = _________ x 100 = ________ %o Meto Not metTotal no. of maternal deaths fromdirect <strong>obstetric</strong> causes in all surveyedfacilities in areaTotal no. of women with<strong>obstetric</strong> complications in allsurveyed facilities in areaIndicator 6bDirect <strong>obstetric</strong> case fatality rate in all surveyedfacilitiesAcceptable level:≤ 1%÷ = _________ x 100 = ________ %o Meto Not metIn addition to the aggregated calculations, the direct <strong>obstetric</strong> case fatality rate should be calculated for each hospital. The results can be presented as a bar chart: the horizontal axisshould be labelled with the facility names, and the vertical axis should be labelled “Direct <strong>obstetric</strong> case fatality rate (%)”. Another way of presenting facility-based results is to give therange of direct <strong>obstetric</strong> case fatality rates from different hospitals as well as the aggregate direct case fatality rate.<strong>Monitoring</strong> <strong>emergency</strong> <strong>obstetric</strong> <strong>care</strong>: a handbook 117
120 This page has been left blank
122 This page has been left blank
Form 5. Calculation of indicators for a countryComplete worksheet 5a before calculating the indicators below.Indicator 1: Availability of EmOC servicesTotal no. of basic +comprehensive EmOCfacilitiesTotal population(worksheet 5a; column 3total)Indicator 1aNo. of EmOC facilities per 500 000populationIs acceptable level met?Minimum acceptable level≥ 5 per 500 000 population( ÷ ) X 500 000 =o Meto Not metTotal no. of comprehensiveEmOC facilitiesTotal population( ÷ ) X 500 000 =Indicator 1bNo. of comprehensive EmOC facilitiesper 500 000 populationMinimum acceptable level≥ 1 per 500 000 populationo Meto Not met<strong>Monitoring</strong> <strong>emergency</strong> <strong>obstetric</strong> <strong>care</strong>: a handbook 123
124 This page has been left blank
Indicator 6: Direct <strong>obstetric</strong> case fatality rateTotal no. of maternal deaths fromdirect <strong>obstetric</strong> causes in all EmOCfacilitiesTotal no. of women with<strong>obstetric</strong> complications in allEmOC facilitiesIndicator 6aDirect <strong>obstetric</strong> case fatality rate in EmOC facilitiesAcceptable level:≤ 1%÷ = _________ x 100 = ________ %o Meto Not metTotal no. of maternal deaths fromdirect <strong>obstetric</strong> causes in allsurveyed facilitiesTotal no. of women with<strong>obstetric</strong> complications in allsurveyed facilitiesIndicator 6bDirect <strong>obstetric</strong> case fatality rate in all surveyedfacilitiesAcceptable level:≤ 1%÷ = _________ x 100 = ________ %o Meto Not metIn addition to the aggregated calculations, the direct <strong>obstetric</strong> case fatality rate should be calculated for each hospital. The results can be presented as a bar chart: the horizontal axisshould be labelled with the facility names, and the vertical axis should be labelled “Direct <strong>obstetric</strong> case fatality rate (%)”. Another way of presenting the facility-based results is to givethe range of case fatality rates from direct <strong>obstetric</strong> causes and the mean case fatality rate.<strong>Monitoring</strong> <strong>emergency</strong> <strong>obstetric</strong> <strong>care</strong>: a handbook 133
134 This page has been left blank
Indicator 7: Intrapartum and very early neonatal death rateTotal no. of intrapartum deaths(≥ 2.5 kg) + very early neonataldeaths (≤ 24 h; ≥ 2.5 kg) in allEmOC facilitiesTotal no. of women giving birthin all EmOC facilitiesIndicator 7aIntrapartum and very early neonatal death rate inEmOC facilitiesAcceptable level:oNo standard has been set÷ = _________ x 100 = ________ % oNot applicableTotal no. of intrapartum deaths(≥ 2.5 kg) + very early neonataldeaths (≤ 24 h; ≥ 2.5 kg) in allsurveyed facilitiesTotal no. of women giving birthin all surveyed facilitiesIndicator 7bIntrapartum and very early neonatal death rate in allsurveyed facilitiesAcceptable level:oNo standard has been set÷ = _________ x 100 = ________ % oNot applicable<strong>Monitoring</strong> <strong>emergency</strong> <strong>obstetric</strong> <strong>care</strong>: a handbook 135
136 This page has been left blank
138 This page has been left blank
<strong>Monitoring</strong> <strong>emergency</strong> <strong>obstetric</strong> <strong>care</strong>: a handbook 139Worksheet 5a. Amount of EmOC servicesUse forms 3 and 4 to fill in the information below.Name of areaNo. of basicEmOC facilitiesin areaNo. of comprehensiveEmOCfacilities in areaPopulation ofareaHas the minimum level ofEmOC been met?If yes, please tick in column.Column totals** If more than one sheet is used, add sheet totals to obtain the overall column total.
Worksheet 5a (continued)Name of areaTotal no. ofexpected birthsTotal no. ofwomen givingbirth in allEmOC facilitiesTotal no. ofwomen givingbirth in allsurveyedfacilitiesTotal no. of womenwith complications inall EmOC facilitiesTotal no. of womenwith complications inall surveyed facilitiesTotal no. ofcaesareansections in allEmOC facilitiesTotal no. ofcaesareansections inall surveyedfacilitiesColumn totals**If more than one sheet is used, add sheet totals to obtain the overall column total.<strong>Monitoring</strong> <strong>emergency</strong> <strong>obstetric</strong> <strong>care</strong>: a handbook 141
142 This page has been left blank
144 This page has been left blank
<strong>Monitoring</strong> <strong>emergency</strong> <strong>obstetric</strong> <strong>care</strong>: a handbook 145Appendix B: Information on registers and data collectionSignal functions:To determine whether a facility offers each of the signal functions, data collectors should:• observe the availability of requisite drugs, supplies, and equipment;• interview health workers in the maternity ward and other departments; and• review facility registers (see below).It is important to consider all the following when determining whether a particular signal function was provided:• Is staff at the facility trained to perform the service?• Do the requisite supplies and equipment exist? Are they functioning?• Were there any cases for which a particular signal function was indicated?• Are the cadres of staff working at the facility authorized to perform the service?Other variables:To collect the data necessary to calculate the EmOC indicators, data from registers in many different rooms or departments atthe facility must be reviewed and abstracted. The table below provides an overview of where to look for different variables.
Registers and other sources to be used to collect data for the EmOC indicatorsInformationRegisters inmaternity ward(including thosefound in: labour,delivery, pre- andpostpartum andneonatal rooms)Registers in operatingtheatre (includingthose for major andminor surgery)Registers inthe female orgynaecologicalwards (includingpost-abortion <strong>care</strong>registers)Registers in theoutpatient departmentRegisters forinpatients andadmissionsOverall administration(including recordsand registers in themorgue, recordsoffice, head healthworkers’ office)No. of women giving birthXNo. of women with <strong>obstetric</strong>complicationsX X X X X XNo. of caesarean sections X XNo. of maternal deaths dueto direct <strong>obstetric</strong> causesNo. of maternal deaths dueto indirect <strong>obstetric</strong> causesNo. of fresh stillbirths andintrapartum deaths ≥ 2.5 kgNo. of very early neonataldeaths (1st 24 h) ≥ 2.5 kgX X X X XX X X X XX X XXX<strong>Monitoring</strong> <strong>emergency</strong> <strong>obstetric</strong> <strong>care</strong>: a handbook 147
148 This page has been left blank
<strong>Monitoring</strong> <strong>emergency</strong> <strong>obstetric</strong> <strong>care</strong>: a handbook 149As can be seen from the table above, the registers in maternity departments should, in theory, contain a lot of the data necessaryto calculate the EmOC indicators; however, it is likely that they will not have all of the data needed. <strong>Monitoring</strong> should help facilitymanagers to perceive the need for maintaining good quality, complete records and will help them to improve record-keepingsystems.Some of the most important columns that should be included in maternity registers are:• admission time and date;• mode of delivery (normal vaginal, assisted vaginal, caesarean section);• <strong>obstetric</strong> complications (e.g. antepartum haemorrhage, postpartum haemorrhage, obstructed labour, prolonged labour,pre-eclampsia, eclampsia, ruptured uterus, postpartum sepsis, complications of abortion, ectopic pregnancies) (Casesof complications of abortion and ectopic pregnancies will usually be found in other departments in the facility, such asthe female or gynaecology ward, operating theatres or outpatient registers.);• treatment or intervention provided to woman, including time of intervention (e.g. magnesium sulfate administered,oxytocin provided, manual removal of the placenta);• treatment or intervention provided to newborn, including time of intervention (e.g. resuscitated);• outcome of mother (e.g. discharged, with time and date, referred to X facility, death); and• outcome of infant (e.g. discharged, referred to X facility, fresh stillbirth, macerated stillbirth, very early neonatal death).Note: Cases of complications of abortion and ectopic pregnancies are often found in other departments of the hospital than thematernity, such as the female or gynaecology ward, operating theatres or outpatient or <strong>emergency</strong> departments.
150 This page has been left blank
Appendix C. Random number table1 2 3 4 5 6 7 8 9 10 11 12 13 141 10480 15011 01536 02011 81647 91646 69179 14194 62590 36207 20969 99570 91291 907002 22368 46573 25595 85393 30995 89198 27982 53402 93965 34095 52666 19174 39615 995053 24130 48360 22527 97265 76393 64809 15179 24830 49340 32081 30680 19655 63348 586294 42167 93093 06243 61680 07856 16376 39440 53537 71341 57004 849 74917 97758 163795 37570 33975 81837 16656 06121 91782 60468 81305 49684 60672 14110 06927 01263 546136 77921 06907 11008 42751 27756 53498 18602 70659 90655 15053 21916 81825 44394 428807 99562 72905 56420 69994 98872 31016 71194 18738 44013 48840 63213 21069 10634 129528 96301 91977 05463 07972 18876 20922 94595 56869 69014 60045 18425 84903 42508 323079 89579 14342 63661 10281 17453 18103 57740 84378 25331 12566 58678 44947 5585 5694110 85475 36857 53342 53988 53060 59533 38867 62300 08158 17983 16439 11458 18593 6495211 28918 69578 88231 33276 70997 79936 56865 05859 90106 31595 01547 85590 91610 7818812 63553 40961 48235 03427 49626 69445 18663 72695 52180 20847 12234 90511 33703 9032213 09429 93969 52636 92737 88974 33488 36320 17617 30015 08272 84115 27156 30613 7495214 10365 61129 87529 85689 48237 52267 67689 93394 01511 26358 85104 20285 29975 8986815 07119 97336 71048 08178 77233 13916 47564 81056 97735 85977 29372 74461 28551 9070716 51085 12765 51821 51259 77452 16308 60756 92144 49442 53900 70960 63990 75601 4071917 02368 21382 52404 60268 89368 19885 55322 44819 01188 65255 64835 44919 05944 5515718 01011 54092 33362 94904 31273 04146 18594 29852 71585 85030 51132 01915 92747 6495119 52162 53916 46369 58586 23216 14513 83149 98736 23495 64350 94738 17752 35156 3574920 07056 97628 33787 09998 42698 6691 76988 13602 51851 46104 88916 19509 25625 5810421 48663 91245 85828 14346 09172 30168 90229 04734 59193 22178 30421 61666 99904 3281222 54164 58492 22421 74103 47070 25306 76468 26384 58151 06646 21524 15227 96909 4459223 32639 32363 05597 24200 13363 38005 94342 28728 35806 06912 17012 64161 18296 2285124 29334 27001 87637 87308 58731 00256 45834 15398 46557 41135 10367 07684 36188 1851025 02488 33062 28834 07351 19731 92420 60952 61280 50001 67658 32586 86679 50720 94953Abridged from Beyer WH, ed. Handbook of tables for probability and statistics, 2nd ed. Boca Raton, Florida, The Chemical Rubber Co., 1968. Used with the permission of CRC Press, Inc.<strong>Monitoring</strong> <strong>emergency</strong> <strong>obstetric</strong> <strong>care</strong>: a handbook 151
152This page has been left blank
This handbook is an update of an earlier publication on monitoring the availability and use of<strong>obstetric</strong> services, issued by UNICEF, WHO and UNFPA in 1997. The indicators defined withinthe publication have been used by ministries of health, international agencies and programmemanagers in over 50 countries around the world. This revision incorporates changes based onmonitoring and assessment conducted worldwide and the emerging evidence on the topic overthe years, and has been agreed by an international panel of experts. It includes two new indicatorsand an additional signal function, with updated evidence and new resources.This handbook aims to describe the indicators and to give guidance on conducting studies topeople working in the field. It includes a list of life-saving services, or ‘signal functions’, thatdefine a health facility with regard to its capacity to treat <strong>obstetric</strong> emergencies. The emphasis ison actual rather than theoretical functioning. The <strong>emergency</strong> <strong>obstetric</strong> <strong>care</strong> indicators describedin this handbook can be used to measure progress in a programmatic continuum: from theavailability of and access to <strong>emergency</strong> <strong>obstetric</strong> <strong>care</strong> to the use and quality of those services.ISBN 978 92 4 154773 4