OXFORD EMPLOYMENT LAND STUDY APPENDICES March 2006
OXFORD EMPLOYMENT LAND STUDY APPENDICES March 2006
OXFORD EMPLOYMENT LAND STUDY APPENDICES March 2006

You also want an ePaper? Increase the reach of your titles
YUMPU automatically turns print PDFs into web optimized ePapers that Google loves.
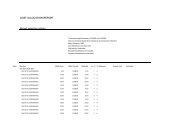
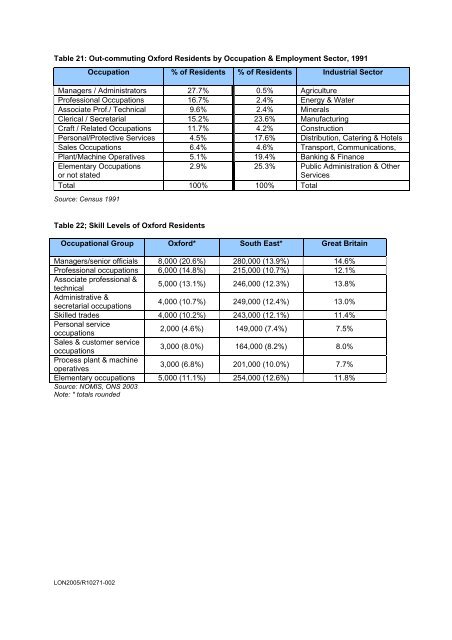
Table 21: Out-commuting Oxford Residents by Occupation & Employment Sector, 1991<br />
Occupation<br />
LON2005/R10271-002<br />
% of Residents % of Residents Industrial Sector<br />
Managers / Administrators 27.7% 0.5% Agriculture<br />
Professional Occupations 16.7% 2.4% Energy & Water<br />
Associate Prof./ Technical 9.6% 2.4% Minerals<br />
Clerical / Secretarial 15.2% 23.6% Manufacturing<br />
Craft / Related Occupations 11.7% 4.2% Construction<br />
Personal/Protective Services 4.5% 17.6% Distribution, Catering & Hotels<br />
Sales Occupations 6.4% 4.6% Transport, Communications,<br />
Plant/Machine Operatives 5.1% 19.4% Banking & Finance<br />
Elementary Occupations<br />
2.9% 25.3% Public Administration & Other<br />
or not stated<br />
Services<br />
Total 100% 100% Total<br />
Source: Census 1991<br />
Table 22; Skill Levels of Oxford Residents<br />
Occupational Group Oxford* South East* Great Britain<br />
Managers/senior officials 8,000 (20.6%) 280,000 (13.9%) 14.6%<br />
Professional occupations 6,000 (14.8%) 215,000 (10.7%) 12.1%<br />
Associate professional &<br />
technical<br />
5,000 (13.1%) 246,000 (12.3%) 13.8%<br />
Administrative &<br />
secretarial occupations<br />
4,000 (10.7%) 249,000 (12.4%) 13.0%<br />
Skilled trades 4,000 (10.2%) 243,000 (12.1%) 11.4%<br />
Personal service<br />
occupations<br />
2,000 (4.6%) 149,000 (7.4%) 7.5%<br />
Sales & customer service<br />
occupations<br />
3,000 (8.0%) 164,000 (8.2%) 8.0%<br />
Process plant & machine<br />
3,000 (6.8%) 201,000 (10.0%) 7.7%<br />
operatives<br />
Elementary occupations 5,000 (11.1%) 254,000 (12.6%) 11.8%<br />
Source: NOMIS, ONS 2003<br />
Note: * totals rounded