OXFORD EMPLOYMENT LAND STUDY APPENDICES March 2006
OXFORD EMPLOYMENT LAND STUDY APPENDICES March 2006
OXFORD EMPLOYMENT LAND STUDY APPENDICES March 2006

Create successful ePaper yourself
Turn your PDF publications into a flip-book with our unique Google optimized e-Paper software.
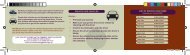
Table 13: Economic Activity & Income Support<br />
Area Economic Activity Receiving<br />
rate (%) Income Support (%)<br />
Feb 2002 May 2003<br />
Oxford 78.8 7.0<br />
Oxfordshire 83.9 5.0<br />
South East 82.8 6.0<br />
England 78.4 10.0<br />
Source: Regional Trends 38, 2004<br />
Table 14: Qualifications of Residents<br />
District % of Residents with<br />
no Qualifications *<br />
Oxford 18.6% 36.9%<br />
Oxfordshire 21.2% 32.3%<br />
South East 23.9% 21.8%<br />
England & Wales 29.1% 19.8%<br />
Source: Census 2001 * Persons aged 17 – 64<br />
Table 15: Sought Occupation of Claimant Unemployed Workers<br />
Sought Occupation<br />
% of Residents with<br />
Degree or Higher<br />
Qualification *<br />
Oxford South East GB<br />
Managers / Administrators 70 (4.1%) 4,880 (6.9%) 4.3%<br />
Professional Occupations 125 (7.1%) 3,045 (4.3%) 3.3%<br />
Associate Prof./ Technical 185 (10.5%) 5,310 (7.5%) 6.5%<br />
Clerical / Secretarial 260 (14.9%) 11,310 (15.9%) 15.5%<br />
Craft / Related Occupations 160 (9.2%) 9,100 (12.8%) 13.4%<br />
Personal/Protective Services 150 (8.7%) 5,245 (7.4%) 7.9%<br />
Sales Occupations 140 (7.9%) 5,880 (8.3%) 8.7%<br />
Plant/Machine Operatives 150 (8.4%) 6,385 (9.0%) 10.8%<br />
Elementary Occupations<br />
or none previous/unknown<br />
510 (29.1%) 19,920 (28.0%) 29.7%<br />
Total 1,755 (100%) 71,080 (100%) 100%<br />
Source: Office of National Statistics, NOMIS, October 2000<br />
Table 16: Average Gross Weekly Earnings of Full Time Employees<br />
Area Average Weekly<br />
Earnings<br />
As a % of<br />
GB Average<br />
Great Britain 475.8 100<br />
South East 537.4 113<br />
Oxfordshire 493.5 104<br />
Oxford 473.1 99<br />
Source: NOMIS (2003)<br />
LON2005/R10271-002