OXFORD EMPLOYMENT LAND STUDY APPENDICES March 2006
OXFORD EMPLOYMENT LAND STUDY APPENDICES March 2006 OXFORD EMPLOYMENT LAND STUDY APPENDICES March 2006
ECONOMIC STATISTICS Table 1: Enterprises by size group, all industries 0-9 10-49 50-99 100-249 250 + Total No. employees employees employees employees employees Firms Oxford District 84.7% 11.2% 1.2% 1.9% 1.1% 2,850 South East 89.0% 9.0% 0.9% 0.6% 0.5% 252,450 GB 88.1% 9.7% 1.0% 0.7% 0.5% 1,607,675 Source: ONS, 2004 Table 2: Change in Employment 1993–2003 District 1993 2003 % Change Oxford 87,610 96,493 + 10.1 Oxfordshire 237,642 308,690 + 29.9 South East 2,861,367 3,632,856 + 27.0 GB 21,105,321 25,716,246 + 21.8 Source: Annual Employment Survey 1993; Annual Business Inquiry 2003 Table 3: Change in Employment in Oxfordshire Districts 1995–2003 District 1995 2003 % Change Oxford 90,166 96,490 + 7.0% Cherwell 51,106 63,700 +24.6% South Oxfordshire 44,348 53,200 +20.0% Vale of White Horse 47,092 60,400 +28.2% West Oxfordshire 29,164 34,900 +19.7% Oxfordshire 261,875 308,690 +17.9% Source: Annual Business Inquiry 1995 & 2003 Table 4: Employment by Industrial Sector (%) Sector LON2005/R10271-002 Oxford (%) South East (%) Great Britain (%) 1993 2003 2003 1993 2003 Agriculture - - 1.1 1.6 0.9 Energy & Water - - 0.7 1.3 0.7 Manufacturing 12.1 9.3 9.8 18.1 12.6 Construction 1.7 1.7 4.1 4.0 4.4 Distribution, Catering & 15.5 18.8 26.3 22.3 24.7 Hotels Transport, Communications, Banking & Finance Public Administration/ Other Services 19.6 21.5 28.7 22.4 25.8 51.0 48.2 29.3 30.4 31.0 All Sectors 100 100 100 100.0 100 Source: Annual Employment Survey 1993; Annual Business Inquiry 2003
Table 5: Change in Employment Structure in Oxford Sector LON2005/R10271-002 Oxford Great Britain 1993 2003 % 1993 – 2003 (000s) (000s) change (% change) Agriculture - - - - 31.1% Energy & Water - - - - 39.0% Manufacturing 10.5 8.9 - 15.2% - 15.2% Construction 1.4 1.6 + 14.3% + 35.4% Distribution, Catering & 13.5 18.1 + 34.1% + 35.1% Hotels Transport, Communications, Banking & Finance Public Administration/Other Services 17.2 21.1 + 18.5% + 40.0% 44.6 46.4 + 4.0% + 24.5% Total 87.6 96.5 + 10.2% + 21.8% Source: Annual Employment Survey 1993; Annual Business Inquiry 2003 Table 6: Firms by Employment Size, 2005 (% of Total Firms) District Employment size band 0-4 5-9 10-19 20-49 50-99 100-249 250-499 500-999 1000+ Oxford 2705 895 490 370 120 90 20 15 5 (57.5%) (19%) (10.4%) (7.9%) (2.6%) (1.9%) (0.4%) (0.2%) (0.1%) Oxfordshire 18,615 (69%) 830 (14.5%) 505 (1.9%) 340 (1.3%) 95 (0.4%) 65 (0.2%) 15 (0.05%) 20 (0.07%) 10 (0.03%) GB 66.6% 15.4% 8.6% 5.9% 2.0% 1.1% 0.3% 0.1% 0.04% Source: UK Business Activity, 2005, ONS Table 7: Change in Number of VAT Registered Firms Area 1994 2004 1994-2004 (%) Oxford 2,545 3,205 + 25.9 Oxfordshire 19,280 23,435 + 21.6 South East 244,015 285,775 + 17.1 United Kingdom 1,629,120 1,810,460 + 11.1 Source: DTI / Small Business Service: Business Start-ups and Closures: VAT registrations and de-registrations, 1994 / 2004 Table 8: VAT Registrations per 10,000 Population (16+), 2003 VAT Registrations per 10,000 population Oxford 25.7 Oxfordshire 48.3 South East 46.7 United Kingdom 39.7 Source: DTI / Small Business Service: Business Start-ups and Closures: VAT registrations and de-registrations, 1994 / 2004
- Page 1 and 2: OXFORD EMPLOYMENT LAND STUDY APPEND
- Page 3 and 4: Offices also in: Cardiff Manchester
- Page 5 and 6: REFERENCE DOCUMENTS 1. Employment L
- Page 7 and 8: ORGANISATIONS CONSULTED Property Ma
- Page 9 and 10: LON2005/R10271-002 APPENDIX 2 ECONO
- Page 11 and 12: ii Major employers and economic dri
- Page 13 and 14: - including for start ups and incub
- Page 15 and 16: LON2005/R10271-002 APPENDIX 3 MAIN
- Page 17: LON2005/R10271-002 APPENDIX 4 ECONO
- Page 21 and 22: Table 13: Economic Activity & Incom
- Page 23 and 24: Table 21: Out-commuting Oxford Resi
- Page 25 and 26: WAREHOUSES & PREMISES Use Address F
- Page 27 and 28: OFFICES & PREMISES Use Address Floo
- Page 29 and 30: OFFICES 1ST FLR GOLDEN CROSS COURT
- Page 31 and 32: OFFICES TRINITY HOUSE 1000, JOHN SM
- Page 33 and 34: OFFICES THE OLD RECTORY, PARADISE S
- Page 35 and 36: OFFICES PT 1ST FLR UNIT 1 SAXON BEC
- Page 37 and 38: FACTORY & PREMISES Use Address Floo
- Page 39 and 40: WORKSHOP AND PREMISES R/O 114, LOND
- Page 41 and 42: BUSINESS UNITS & PREMISES Use Addre
- Page 43 and 44: OTHER Use Address Floor Area (sq.m)
- Page 45 and 46: LON2005/R10271-002 APPENDIX 6 CHARA
- Page 47 and 48: Site name / address 9 Fenchurch Cou
- Page 49 and 50: APPENDIX 7 SURVEY OF EMPLOYERS IN O
- Page 51 and 52: 12. A number of firms had staff com
- Page 53 and 54: OXFORD EMPLOYMENT LAND STUDY: SITE
- Page 55 and 56: o remove undesirable use o good for
- Page 57 and 58: Site: Reference Area (ha) QUARRY MO
- Page 59 and 60: Site: Reference Area (ha) BLANCHFOR
- Page 61 and 62: Site: Reference Area (ha) TRAVIS PE
- Page 63 and 64: Site: Reference Area (ha) PRINTING
- Page 65 and 66: Site: Reference Area (ha) BLACKWELL
- Page 67 and 68: Site: Reference Area (ha) MAGDALEN
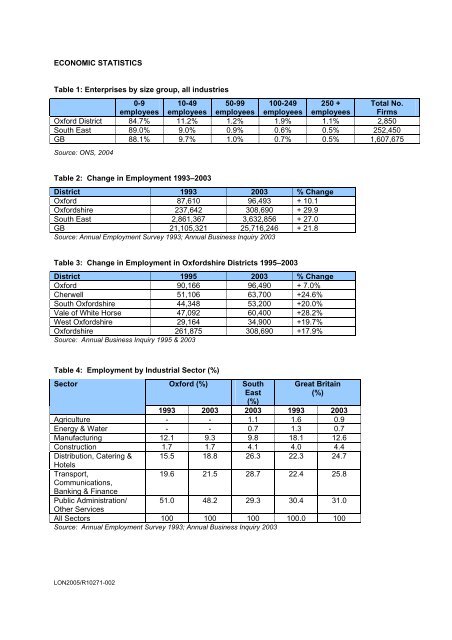
ECONOMIC STATISTICS<br />
Table 1: Enterprises by size group, all industries<br />
0-9 10-49 50-99 100-249 250 + Total No.<br />
employees employees employees employees employees Firms<br />
Oxford District 84.7% 11.2% 1.2% 1.9% 1.1% 2,850<br />
South East 89.0% 9.0% 0.9% 0.6% 0.5% 252,450<br />
GB 88.1% 9.7% 1.0% 0.7% 0.5% 1,607,675<br />
Source: ONS, 2004<br />
Table 2: Change in Employment 1993–2003<br />
District 1993 2003 % Change<br />
Oxford 87,610 96,493 + 10.1<br />
Oxfordshire 237,642 308,690 + 29.9<br />
South East 2,861,367 3,632,856 + 27.0<br />
GB 21,105,321 25,716,246 + 21.8<br />
Source: Annual Employment Survey 1993; Annual Business Inquiry 2003<br />
Table 3: Change in Employment in Oxfordshire Districts 1995–2003<br />
District 1995 2003 % Change<br />
Oxford 90,166 96,490 + 7.0%<br />
Cherwell 51,106 63,700 +24.6%<br />
South Oxfordshire 44,348 53,200 +20.0%<br />
Vale of White Horse 47,092 60,400 +28.2%<br />
West Oxfordshire 29,164 34,900 +19.7%<br />
Oxfordshire 261,875 308,690 +17.9%<br />
Source: Annual Business Inquiry 1995 & 2003<br />
Table 4: Employment by Industrial Sector (%)<br />
Sector<br />
LON2005/R10271-002<br />
Oxford (%) South<br />
East<br />
(%)<br />
Great Britain<br />
(%)<br />
1993 2003 2003 1993 2003<br />
Agriculture - - 1.1 1.6 0.9<br />
Energy & Water - - 0.7 1.3 0.7<br />
Manufacturing 12.1 9.3 9.8 18.1 12.6<br />
Construction 1.7 1.7 4.1 4.0 4.4<br />
Distribution, Catering & 15.5 18.8 26.3 22.3 24.7<br />
Hotels<br />
Transport,<br />
Communications,<br />
Banking & Finance<br />
Public Administration/<br />
Other Services<br />
19.6 21.5 28.7 22.4 25.8<br />
51.0 48.2 29.3 30.4 31.0<br />
All Sectors 100 100 100 100.0 100<br />
Source: Annual Employment Survey 1993; Annual Business Inquiry 2003


