The Future of qPCR Webinar Q&A - NanoDrop
The Future of qPCR Webinar Q&A - NanoDrop
The Future of qPCR Webinar Q&A - NanoDrop
- No tags were found...

You also want an ePaper? Increase the reach of your titles
YUMPU automatically turns print PDFs into web optimized ePapers that Google loves.
<strong>The</strong> tremendous interest and viewership <strong>of</strong> the webinar “<strong>The</strong> <strong>Future</strong> <strong>of</strong> PCR: Best Practices, Standardization and the MIQE Guidelines”resulted in many questions that were asked by the viewers. <strong>The</strong>se ranged from very specific experiment-level questions, to those that wereabout the broader <strong>qPCR</strong> topic. <strong>The</strong>se questions were reduced to the most frequently asked with the broadest applicability and werecategorized into several topic areas, as detailed below.Responses compiled and edited by the panelists: Dr. Stephen Bustin, Dr. Gregory L. Shipley and Manju Sethi<strong>Webinar</strong> hosted by Science/AAAS and sponsored by <strong>The</strong>rmo Scientific <strong>NanoDrop</strong> and Solaris ProductsView archived webinar at www.sciencemag.org/webinar<strong>The</strong> material included for each topic is not intended to be a complete discussion <strong>of</strong> the subject, rather to address and provide guidance to specific questions.ContaminationWhat contaminants are typically associated with <strong>qPCR</strong> experiments?How can they be detected?How can contaminants be eliminated?C qWhat is an acceptable or reliable C q ?Data analysisWhat are some common data-analysis s<strong>of</strong>tware options?Are there any databases for real-time data (like GEO ARRAY Expressfor microarray)?What is the recommended procedure if the SD is too high to get a P value?EfficiencyWhat was the significance <strong>of</strong> the 93% efficiency, referenced in the talk?What does it mean if the efficiency is over 100%?LODHow is LOD calculated?How can one assess if variation is significant or not?MIQE GuidelinesWhere can the MIQE Guidelines be found?What do the guidelines include?To what are they applicable?What should be included when publishing?How does one use the guidelines?Normalization GenesHow does one select reference genes for complex samples, e.g., soil?What if the expression levels <strong>of</strong> normalization genes are variable?How many reference genes are recommended?Should reference genes be included on every plate?Primers/Probes/ControlsWhat are the main considerations for primer design?Where can one find the best primer sequences being used?Can a primer/dimer be ignored?How should primers be stored?What is the advantage <strong>of</strong> a quencher?What is preferred — binding to a “-“ or “+” strand?What is preferred — sitting on forward or reverse primer?What procedure is recommended when there is non-specific binding in the control?<strong>qPCR</strong> ApplicationsCan <strong>qPCR</strong> be used for food product testing?Can <strong>qPCR</strong> be used for plant materials?Can <strong>qPCR</strong> be used for clinical microbiology?Quantification and PurityWhat does one quantify with a <strong>NanoDrop</strong>?What is the importance <strong>of</strong> the 260/230 ratio and what are the criteria?Will Phenol / TE affect an experiment?How can one improve RNA quality?Standard Curves and Delta Delta C q What is best to use — plasmid DNA or Oligo ssDNA for standard curves?Should the standard curve be included in the published data?Is there a suggested number <strong>of</strong> points?Should a standard curve be run on every plate?When should one use Delta Delta C q ?SYBR Green ® /TaqMan ®Can both SYBR Green and TaqMan be used in one tube?Is an NTC control needed for each sample?Are there any problems with multiplexing, if amplicons have differentmelting points?What is the importance <strong>of</strong> the length <strong>of</strong> amplified fragments?Can results from different instruments be combined/averaged?
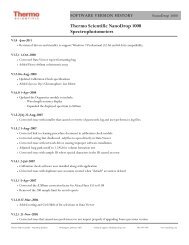
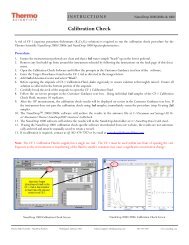
<strong>Webinar</strong>: <strong>The</strong> <strong>Future</strong> <strong>of</strong> <strong>qPCR</strong>: Best Practices, Standardization and the MIQE guidelinesContaminantsContaminants in a sample being prepared for <strong>qPCR</strong> could be residualgenomic DNA, contaminants not removed by the extraction procedure, orchemical contaminants introduced by the extraction procedure itself.(1) Genomic DNA contaminationSome studies have shown that presence <strong>of</strong> genomic DNA can shiftC q values significantly. This is particularly so for genes with lowexpression levels.<strong>The</strong>re are two options to address this problem:(a) Removal <strong>of</strong> the DNA contamination from RNA preparations usingcommercially available kits that contain RNase-free DNase.(b) When possible use primers spanning an exon-exon junction. <strong>The</strong>result, genomic DNA, even when present, is not amplified.(2) As a result <strong>of</strong> extraction procedures (conventional extractions orkit-based), there are a number <strong>of</strong> chemical contaminants that may bepresent in the sample. Examples <strong>of</strong> these are Phenol, Guanidine (fromextraction), or TE, EDTA (from buffer). <strong>The</strong> effect <strong>of</strong> these contaminantson downstream applications may vary. It is always good practice toremove contaminants, so that you are working with a completely knownsample for processing through the downstream applications. This practiceminimizes parameters that may introduce variability in the final data.10mm Absorbance10mm Absorbance1.4 -1.3 -1.2 -1.1 -1.0 -0.9 -0.8 -0.7 -0.6 -0.5 -0.4 -0.3 -0.2 -0.1 -0.0 -BAA = Sample with no contaminantB = Sample with Phenollower A 260/ A 230higher A 260shifted A 260peak220 230 240 250 260 270 280 290 300 310 320 330 3401.4 -1.3 -1.2 -1.1 -1.0 -0.9 -0.8 -0.7 -0.6 -0.5 -0.4 -0.3 -0.2 -0.1 -0.0 -BAWavelength nmA = Sample with no contaminantB = Sample with Guanadinemuch lower A 260/ A 230220 230 240 250 260 270 280 290 300 310 320 330 340Wavelength nmEffect <strong>of</strong> common contaminants (Phenol and Guanadine) on DNAabsorbance spectra.To remove Phenol residue from the sample, the recommendation is toincrease the wash steps. For residues left by kits, the kit manufacturer<strong>of</strong>ten supplies separate cleaning agents that will address the removal<strong>of</strong> these contaminants.<strong>The</strong> presence or absence <strong>of</strong> many common chemical impurities such asthose listed here can be verified by the A 260 / A 230 ratio and spectral datafrom the <strong>The</strong>rmo Scientific <strong>NanoDrop</strong> 2000 series spectrophotometer.(See the section on Quantification and Purity Assessment).C qThose new to <strong>qPCR</strong> may ask what is considered an “acceptable” or“reliable” C q . <strong>The</strong>re is no universal answer to this question, if thetechnique is performed properly.All <strong>qPCR</strong> experiments start with the assay. <strong>The</strong> assay must be validatedbefore unknown samples are run. During this validation both the slope andLimit <strong>of</strong> Detection (LOD) are determined. <strong>The</strong> LOD typically is assumed tobe the highest C q value observed for a truly positive sample, as verified bymelt-curve analysis or electrophoresis.<strong>The</strong> Limit <strong>of</strong> Detection is used to determine what the acceptable C q valuesfor that assay are. It may be different for every assay.<strong>The</strong>re are actually two terms to be considered for <strong>qPCR</strong>, the LOD or limit<strong>of</strong> detection and LOQ or limit <strong>of</strong> quantification (Linnet, et al. 2004, ClinicalChemistry 50:732-740). <strong>The</strong>re are times when one can detect a good signalwith an assay at low template concentrations, but that signal will not bewithin the linear range <strong>of</strong> the assay. Thus, the LOD will have a higher C qvalue than the LOQ. It is the LOQ that must be used as the lower limit forthat assay. This can be determined by making a 7-log 10 dilution curve <strong>of</strong>PCR product. First, make a 1/10,000 dilution <strong>of</strong> a 40 cycle reaction. Use acarrier such as nuclease-free tRNA at 30 – 100 ng/µl, as even dsDNA willstick to plastic at low concentrations. <strong>The</strong> highest dilution <strong>of</strong> template thatis still linear is the LOQ. One can detect a good signal at lower templateconcentrations. However, if the signal does not fit on the linear regressionline, that data point is no longer useful for data quantification. <strong>The</strong> resultwill be a higher C q for the LOD than for the LOQ. Use the C q value <strong>of</strong> theLOQ for a lower limit for that assay.Fluorescence70 -60 -50 -40 -30 -20 -C qThreshold Cycle — Fluorescence5 10 15 20 25 30 35 40 45 50 55Cycle #Threshold cycle (C q ) is the point where the instrument first detectsfluorescence above background noise (arrow).
<strong>Webinar</strong> hosted by Science/AAAS and sponsored by <strong>The</strong>rmo Scientific <strong>NanoDrop</strong> and Solaris Productswww.sciencemag.org/webinarData AnalysisData analysis refers to the evaluation <strong>of</strong> the data with respect to qualityand reliability, to ensure that the results can be duplicated and publishedwith confidence. To accomplish this, there are several commerciallyavailable s<strong>of</strong>tware packages. Since there is evidence that <strong>qPCR</strong> dataanalysismethods differ substantially in their performance 1 , the selection<strong>of</strong> the appropriate data collection and processing strategy is important. Itshould be based on the individual experimental objectives and parameters.Below is a partial list <strong>of</strong> common data analysis s<strong>of</strong>tware programs:• qBaseplus• GenEx• REST-2009• DataAssist<strong>The</strong>re are also some integrated s<strong>of</strong>tware LIMS solutions focusedon the life science lab (e.g., Genologics) that help to manage data.A database specifically for real-time <strong>qPCR</strong> data is <strong>qPCR</strong>-DAMS:http://www.gene-quantification.de/jin-bioinf-qpcr-dams-2006.pdfAt this time, we do not have sufficient information to assess its valueor quality.EfficiencyIndividual samples generate different and individual fluorescence historiesin kinetic RT-PCR. <strong>The</strong> shapes <strong>of</strong> amplification curves differ in the steepness<strong>of</strong> any fluorescence increase and in the absolute fluorescence levels atplateau, depending on background fluorescence levels. <strong>The</strong> PCR efficiencyhas a major impact on the fluorescence history and the accuracy <strong>of</strong> thecalculated expression result. It is critically influenced by PCR reactioncomponents. Efficiency evaluation is an essential marker in genequantification procedure. Constant amplification efficiency in allcompared samples is one important criterion for reliable comparisonbetween samples. This becomes critically important when analyzing therelationship between an unknown sequence, versus a standard sequence,which is performed in all relative quantification models.In experimental designs employing standardization with housekeepinggenes, the demand for invariable amplification efficiency between targetand standard is <strong>of</strong>ten ignored, despite the fact that corrections have beensuggested. A correction for efficiency, as performed in efficiency-correctedmathematical models, is strongly recommended. It results in a morereliable estimation <strong>of</strong> the ‘real expression ratio,’ compared to no efficiencycorrection. Small efficiency differences between target and referencegenes generate a false expression ratio, resulting in the researcher overorunder-estimating the actual initial mRNA amount. <strong>The</strong> s<strong>of</strong>tware listed abovecan correct for efficiency differences between different assays for analysis.<strong>The</strong> assessment <strong>of</strong> the exact amplification efficiencies <strong>of</strong> target andreference genes must be carried out before any calculation <strong>of</strong> thenormalized gene expression is executed. 2Efficiency is calculated as follows:E = 10[-1/slope] – 1For those using the Delta Delta C q (dd C q ) method, when two assays havediffering slopes, the C q values for each result in different numbers <strong>of</strong>template for each assay. Thus, when you compare dd C q from one assay toanother, the values will not be the same as if you had used a standardcurve to determine a copy number for each assay. This is problematicwhen the assay(s) used for data normalization do not have the same PCRefficiencies as the experimental assays. When you use the standard curvemethod, the curve is generated by the same assay as the unknowns. Thus,the copy numbers resulting from the curve take the slope into account.This method has greater accuracy than using mass, which does not takeinto account the length <strong>of</strong> the PCR amplicon. <strong>The</strong>refore, the copy numbersfrom assays with different PCR efficiencies are directly comparable,because log-transformed copy numbers account for the different slopes.Using a synthetic standard (DNA oligo) has its advantages because it isrelatively easy to have made and mimics the cDNA exactly. One could alsouse an in vitro transcribed RNA as template. However, quantification <strong>of</strong>these RNA standards requires more than just making a A 260 measurementas not all <strong>of</strong> the product will be usable in the <strong>qPCR</strong> assay. A linearizedplasmid construct or PCR product may also be used if it is ensured that thedsDNA vs. ssDNA issue is taken into account for quantification.However, standard curves are not perfect. <strong>The</strong>y will vary slightly from runto run due to pipetting differences in making the dilutions and in addingthe standards to the reactions. A compromise would be to use a singlestandard concentration with a known copy number on each plate and usethis C q value for data analysis.Limit <strong>of</strong> Detection (LOD)LOD, actually the LOQ (see C q discussion) is determined by taking multiple10-fold dilutions <strong>of</strong> PCR product and determining when the assay stops beinglinear. That is, the lowest point will fall <strong>of</strong>f the line by not working at all. Or,it will not be efficient enough to be co-linear with the lower dilutions. Adilution that gives a signal but is no longer co-linear with the other dilutionsis the LOD. However, it’s preferable to use the LOQ as the C q value cut-<strong>of</strong>ffor the assay. It is suggested that a carrier is used to make the dilutions,such as nuclease-free tRNA (yeast or E. coli). This will keep the lowestdilutions from sticking to the plastics. Assay quality is measured by PCRefficiency, and it is a user decision on how low this can be. If the LOQ <strong>of</strong>the assay is sufficient for the samples, the PCR efficiency can be poor,(less than 93% or a slope <strong>of</strong> –3.5). Poor PCR efficiencies tend to givehigher LOQ values. Although the assay works well enough for this sampleset, it may not work well for the subsequent set. <strong>The</strong> primers are the keyto a good assay. Changing a primer up or down in the template sequenceby just one base may make a significant difference in the PCR efficiency.For example, at the Quantitative Genomics Core Lab at the University <strong>of</strong>Texas Science Health, Houston, the general rule for design <strong>of</strong> <strong>qPCR</strong> assays isgreater than 93% PCR efficiency and linear down to 10 copies <strong>of</strong> template.To achieve this goal, 4 primers are ordered for each assay, 2 forwardand 2 reverse, as primers are very inexpensive. <strong>The</strong>y are tried in all 4combinations, to find the best pair. S<strong>of</strong>tware is good but not perfect.Determining what is ‘best’ is difficult, as there is no basis for comparison.
<strong>Webinar</strong>: <strong>The</strong> <strong>Future</strong> <strong>of</strong> <strong>qPCR</strong>: Best Practices, Standardization and the MIQE guidelinesMIQE Guidelines<strong>The</strong> MIQE Guidelines: Minimum Information for Publication <strong>of</strong>Quantitative Real-Time PCR Experiments is published in the Journal<strong>of</strong> Clinical Chemistry 611-622 (2009).It provides guidance for a standardized way to conduct and reportexperimental details <strong>of</strong> a <strong>qPCR</strong> experiment to “help ensure the integrity<strong>of</strong> the scientific literature, promote consistency between laboratories,and increase experimental transparency.”Importantly, it includes a practical checklist to accompany the initialsubmission <strong>of</strong> a paper to the publisher.MIQE Guidelines checklistIrrespective <strong>of</strong> whether the intended purpose <strong>of</strong> the <strong>qPCR</strong> experiment ispublishing, the MIQE Guidelines provide a disciplined approach to conducting<strong>qPCR</strong>. It provides added confidence in the resulting data, and the ability toreproduce the results reliably.While there are no strict rules for what to include in the publication, thefollowing provides some suggestions in addition to those included inthe MIQE Guidelines checklist:1 – Species2 – Accession number3 – Synonyms (old names for the same transcript)4 – Primer/probe sequences with strand designations (strand to which theprimer binds, + or - ), reporter (e.g., FAM) and quencher (e.g., BHQ1) IDs5 – PCR amplicon length6 – PCR efficiency (in %)7 – Exon boundary information (e.g., which exon(s) are detected, where theassay lies or if the transcript isn’t spliced)8 – Splice variants (e.g., if they exist, does the assay see them all, only2 out <strong>of</strong> 3, only 1, etc.)9 – Folding issues via M-fold (e.g., are stems an issue where theprimers/probe bind in the PCR amplicon)Normalization Genes/ControlsData normalization in real-time RT-PCR is a further major step in genequantification analysis (Bustin 2002, Pfaffl 2001). <strong>The</strong> reliability <strong>of</strong> anyrelative RT-PCR experiment can be improved by including an invariantendogenous control (reference gene) in the assay. This will correct forsample-to-sample variations in RT-PCR efficiency and errors in samplequantification. A biologically meaningful reporting <strong>of</strong> target mRNA copynumbers requires accurate and relevant normalization to some standard andis strongly recommended in kinetic RT-PCR. <strong>The</strong> quality <strong>of</strong> normalizedquantitative expression data cannot be better than the quality <strong>of</strong>the normalizer. Any variation in the normalizer will obscure real changesand produce artifactual changes (Bustin 2000). Real-time RT-PCR-specificerrors in the quantification <strong>of</strong> mRNA transcripts are easily compoundedwith any variation in the amount <strong>of</strong> starting material between thesamples. For example, it can be caused by sample-to-sample variation,variation in RNA integrity, RT efficiency differences and cDNA sampleloading variation (Stahlberg 2003 2004a 2004b). This is especially relevantwhen the samples have been obtained from different individuals, differenttissues and different time courses. It will result in the misinterpretation <strong>of</strong>the derived expression pr<strong>of</strong>ile <strong>of</strong> the target genes. <strong>The</strong>refore, normalization<strong>of</strong> target gene expression levels must be performed to compensate theintra- and inter-kinetic RT-PCR variations, such as sample-to-sample andrun-to-run variations (Pfaffl & Hageleit 2001).Data normalization can be carried out against an endogenous, unregulatedreference gene transcript or against total cellular DNA or RNA content(molecules/g total DNA/RNA and concentrations/g total DNA/RNA).Normalization according to the total cellular RNA content is increasinglyused, but little is known about the total RNA content <strong>of</strong> cells or about themRNA concentrations. <strong>The</strong> content per-cell or per-gram tissue may varyin different tissues in vivo, in cell culture (in vitro), between individualsand under different experimental conditions. Nevertheless, it has beenshown that normalization to total cellular RNA is the most reliable method(Bustin 2000 Bustin 2002). It requires an accurate quantification <strong>of</strong> theisolated total RNA or mRNA fraction by optical density at 260 nm, AgilentBioanalyzer 2100, or Ribogreen RNA Quantification Kit. Alternatively, therRNA content has been proposed as an optimal and stable basis fornormalization, despite reservations concerning its expression levels,transcription by a different RNA polymerase and possible imbalances inrRNA and mRNA fractions between different samples (RNA and RT page).To normalize the absolute quantification according to a single referencegene, a second set <strong>of</strong> kinetic PCR reactions has to be performed for theinvariant endogenous control on all experimental samples. <strong>The</strong> relativeabundance values are calculated for internal control as well as for thetarget gene. For each target gene sample, the relative abundance valueobtained is divided by the value derived from the control sequence inthe corresponding target gene. <strong>The</strong>n, the normalized values for differentsamples can be compared directly (Pfaffl 2001, relative expression page). 3In many instances, transcripts that are found in multiple cell types areselected as the reference genes, since they can be applied to any <strong>qPCR</strong>experiment. In practice however, any transcript can be used for datanormalization. Finding which one to use for a particular assay is an
<strong>Webinar</strong> hosted by Science/AAAS and sponsored by <strong>The</strong>rmo Scientific <strong>NanoDrop</strong> and Solaris Productswww.sciencemag.org/webinarNormalization Genes/Controls continuedempirical process that cannot be avoided. <strong>The</strong>re are commercial arraysavailable for finding suitable transcripts for data normalization. One canalso try a cadre <strong>of</strong> accessible transcripts.<strong>The</strong> number <strong>of</strong> reference genes to use depends on the variability seenwith just one, then two, then three and so on. Programs such as GeNorm,qBasePlus or GenEx have functions that allow one to make thisassessment. Furthermore, it has been shown that using multipletranscripts for data normalization can result in a better analysis(Vandesompele, et al. 2002, Genome Biol 3:RESEARCH0034).In the case <strong>of</strong> complex matrices (e.g., soil, blood), such as a loss <strong>of</strong> cellularcontext, or when there is a rapid change in normal transcript levels (e.g.,apoptosis or ActD induced transcript half life measures), it is best to usetotal nucleic acid measures for normalization. In principle, the cut<strong>of</strong>f isdetermined by the LOQ <strong>of</strong> each individual assay. <strong>The</strong> C q values that determinethe LOQ can be different for every assay. <strong>The</strong>refore, it is not a safe assumptionto say that the same cut<strong>of</strong>fs may be used for target and normalization genes.Primers/Probes/ControlsPRIMEROptimal primer length is typically 15 – 25 bases, and the GC content canvary between 40 – 70%. It is recommended that the two primers shouldhave closely matched melting temperatures, and the differenceshould be ≤ 5˚C. Generally, primers with melting temperatures in therange <strong>of</strong> 55 – 65˚C will produce the best results. To minimize mis-priming,primers should be designed with no more than 2 G/C bases in the lastfive bases, at the 3’ end <strong>of</strong> the primer. Formation <strong>of</strong> primer-dimers can belimited by avoiding primers with secondary structures or complementarysequences between the 3’ ends <strong>of</strong> forward and reverse primers and for RT-<strong>qPCR</strong>.Ideally, primers should be designed to span the exon-exon boundary.Degenerate primers can be used. However, extra care must be taken tocheck the results, as it is difficult to predict the performance <strong>of</strong> degenerateprimers solely based on the sequence.<strong>The</strong> formation <strong>of</strong> primer-dimers can reduce the amplification efficiency <strong>of</strong> thespecific target. In this case, it may be best to design more suitable primers.Use <strong>of</strong> TE buffer (10 mM Tris•Cl, 1 mM EDTA, pH 8.0) is recommended.For standard primers, making a concentrated stock solution (e.g., 100 µM)and storing in small aliquots at -20˚C is recommended. Standard primersare stable under these conditions for at least one year. Freeze-thaw cyclesshould be avoided since they may lead to degradation. Primers shouldnot be dissolved in water, since they are less stable in water than in TE.Additionally, some primers may not dissolve well in water.PROBEQuenchers are useful in multiplexing assays. <strong>The</strong>re is usually a highersignal-to-noise ratio with non-fluorescent quenchers (like BHQ), comparedto reporters used as quenchers (e.g., TAMRA). Probes should be designedto match to the fluorophore. If you use fluorophores as quenchers you also“lose” one detection channel for it.<strong>The</strong>re is little difference between binding to the “-“ or “+” strand, if theprimer is designed properly.Similarly, it does not matter significantly if the probe sits on the forwardor reverse primer, so long as one finds an optimal place.CONTROLNon-specific binding <strong>of</strong> controls is <strong>of</strong>ten related to unspecific primers, toolow <strong>of</strong> an annealing temperature or contamination. If one uses the universal60˚ – 95˚C cycling protocol, it may be best to redesign the primers orprobe, or to optimize the annealing temperature to alleviate this problem.<strong>The</strong> issue <strong>of</strong> a signal from no template controls (NTC) could be fromprimer-dimers or from contamination with SYBR Green chemistry. If thecontrol is a positive control (known amount <strong>of</strong> target DNA), and there isunspecific binding, it may be attributable to primers that are non-specificand allow annealing to other targets.At the Quantitative Genomics Core Lab at the University <strong>of</strong> Texas ScienceHealth, Houston, the following practices are followed. Primers/probes aredissolved in nuclease-free H 2 O with no problems. 100 µM stocks are madeas stated above and stored at –80˚C. For working stocks, 20 µM primer/probe dilutions are made and stored at –20˚C. In fact, primers and probeshave been seen to be good after 10 years <strong>of</strong> storage under these conditions.However, as mentioned above, repeated freeze/thaw cycles will have anaffect on primer/probe stability.<strong>The</strong> assays at this facility are designed for the primers to have an optimalbinding Tm <strong>of</strong> 58˚ – 59˚C and to keep the Tm difference among primers at2˚C. A 5˚C Tm may be too large <strong>of</strong> a difference, if the annealing temperature<strong>of</strong> the reaction may have to be altered for assay optimization. All <strong>of</strong> theassays at this facility use a 60˚C annealing/extension temperature.As for primer probe structure, runs <strong>of</strong> Gs over 3 in a row should be avoided,as this sequence will tend to put a bend in the oligo that can affecthybridization. Select probes based on the annealing strand that willminimize the number <strong>of</strong> Gs in the probe sequence. It may be beneficial tokeep the probe close to the primer that anneals to the same strand as theprobe. Using good s<strong>of</strong>tware to make your assay design is crucial.Validated PCR primer sequences may be submitted to the followingdatabase: <strong>The</strong> link is: http://medgen.ugent.be/rtprimerdb/
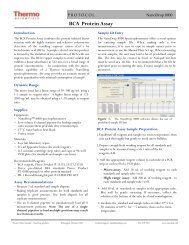
<strong>Webinar</strong>: <strong>The</strong> <strong>Future</strong> <strong>of</strong> <strong>qPCR</strong>: Best Practices, Standardization and the MIQE guidelines<strong>qPCR</strong> and its ApplicationsPCR “is one <strong>of</strong> a handful <strong>of</strong> techniques (perhaps the technique) that havetruly revolutionized molecular biology. Its specificity, efficiency, and fidelityhave turned it into a key technology that has made molecular assaysaccessible to every research and diagnostic laboratory. It underpinsmost <strong>of</strong> the spectacular advances that are now commonplace in everybiological discipline, ranging from microbial detection and microbiologicalquality assurance, through the detection <strong>of</strong> genetically-manipulatedorganisms in crops and foods, to molecular and veterinary medicine.Together with its <strong>of</strong>fshoot, the reverse transcriptase (RT) PCR, it isunrivalled as a quantitative assay for the rapid, inexpensive and simpledetection <strong>of</strong> nucleic acids.” 2While conventional PCR is a qualitative assay (answering yes/noquestions), quantitative, real-time PCR (<strong>qPCR</strong>) is a powerful technique thatenables both qualitative as well as quantitative measurements <strong>of</strong> specificgenes in a nucleic acid sample. Since various experimental parameterscan have a significant impact on the quality <strong>of</strong> results (in some caseserroneous but believable), it is particularly important to employ standardizedbest practices. Those include the use <strong>of</strong> rigorous controls, validation andnon-subjective data interpretation.A partial list <strong>of</strong> key applications is shown below:Molecular Diagnosticse.g., Quantification <strong>of</strong> viral loads in clinical samplesSolid tumor diagnosticsIdentification <strong>of</strong> specific genes that dictate therapeutic outcomeLife Science Research (including Plant/Animal)e.g., Gene ExpressionSNP analysesDetection <strong>of</strong> genetic alterationsCloningBiotechnologye.g., Quantification/Detection <strong>of</strong> genetic modification in foods (GMOs)Foode.g., Quantification/Detection <strong>of</strong> bacterial pathogensQuantification and Purity Assessment <strong>of</strong> Samples“<strong>The</strong> traditional method for measuring DNA concentration is thedetermination <strong>of</strong> the absorbance <strong>of</strong> UV light at 260 nm (A260) in aspectrophotometer …” 1Typically quantification is done after DNA/RNA extraction. If reversetranscription is performed using the same RT kits and with the samesample type, it is not necessary to quantify the cDNA post RT.<strong>The</strong> <strong>The</strong>rmo Scientific <strong>NanoDrop</strong> 2000 series is an easy-to-use,microvolume, UV-Vis spectrophotometer that allows samples to bemeasured quickly (less than 5 seconds) and conveniently, without the needfor cuvettes. It utilizes a patented sample-retention technology to measuresamples as small as 0.5 µl – 1.0 µl, without the need for dilutions. An IQ/OQkit is also available, which includes procedures and forms useful for thevalidation <strong>of</strong> the instrument for labs that require such practices.<strong>The</strong> <strong>NanoDrop</strong> 2000/2000c provides the following information for a sample:• DNA/RNA concentration (quantification)• Purity assessment using A 260 / A 280 and A 260 / A 230 ratios• Full (absorbance) spectral dataHistorically, A 260 /A 280 has been the primary measure <strong>of</strong> purity. Users arenow gathering more information by examining the entire absorbancespectra, including A 260 /A 230 .10mm Absorbance38 -36 -260nm34 -32 -30 -28 -26 -24 -22 -20 -18 -280nm16 -230nm14 -12 -10 -8 -6 -4 -2 -0 -220 230 240 250 260 270 280 290 300 310 320 330 340Typical nucleic acid spectrumWavelength nmAbsorbance spectrum for DNA/RNAUV-Vis absorbance measurements do not distinguish between RNA andDNA (both absorb at 260 nm). It assumes that the sample being measuredis pure. (See section on Contaminants for more information on removinggenomic DNA from RNA samples).Quantification<strong>The</strong> dynamic range <strong>of</strong> the <strong>NanoDrop</strong> 2000 series is 2 ng/µl – 15,000 ng/µl(dsDNA) or 2 ng/µl – 12,000 ng/µl (RNA) — without the need for dilutions.In addition to the microvolume sample retention system, the <strong>NanoDrop</strong>2000c model also provides a built-in cuvette capability, which extends thedetection limit down to 0.4 ng/µl (dsDNA).PurityRecommended A 260 / A 280 ratios are:For pure DNA: ~ 1.8For pure RNA: ~ 2.0Recommended A 260 / A 230 ratios are:For pure DNA: ~ 1.8 – 2.2For pure RNA: ~ 1.8 – 2.2340nmPure DNAA 260/A 280~ 1.8A 260/A 230~ 1.8 – 2.2Pure RNAA 260/A 280~ 2.0A 260/A 230~ 1.8 – 2.2In some cases, the above ratios for an impure sample may be in theacceptable range, so it is important to examine spectral data in conjunctionwith these ratios. <strong>The</strong> sample spectrum can provide additional informationregarding potential chemical contaminants introduced by extractionprocedures or kits. (See the section on Contamination for more informationon removing chemical contaminants).
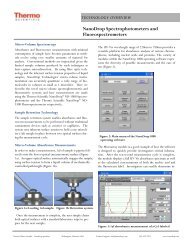
<strong>Webinar</strong> hosted by Science/AAAS and sponsored by <strong>The</strong>rmo Scientific <strong>NanoDrop</strong> and Solaris Productswww.sciencemag.org/webinarStandard Curves/Delta Delta C q<strong>The</strong> two most commonly used methods to analyze data from real-time,quantitative PCR experiments are absolute quantification andrelative quantification.Standard CurvesAbsolute quantification determines the input copy number and is usuallyaccomplished by comparing the sample PCR signal to a standard curve.To construct the standard curve, any template that can be specificallyamplified by the <strong>qPCR</strong> assay components may be used, e.g., ssDNAoligo standards that are the same length as the PCR amplicon. If dsDNAstandard is used, there is a two-fold reduction in copy number that willresult from the comparison. This is because cDNA is ssDNA, and the firstcycle for ssDNA is making the dsDNA with no amplification. Whereas withdsDNA, the amplification starts at cycle 1.Fluorescence13.895 -12.895 -11.895 -10.895 -9.895 -8.895 -7.895 -6.895 -5.895 -4.895 -3.895 -2.895 -1.895 -0.895 -Amplification Curves2 4 6 8 10 12 14 16 18 20 22 24 26 28 30 32 34 36 38 40CyclesStandard CurveIn order to mimic total RNA in the dilutions <strong>of</strong> the standards, one canuse molecular-biology grade tRNA from yeast or E.coli at 30-100 ng/µl. Acarrier is used to dilute the standard material, which prevents low copynumber molecules from sticking to the plastics.Crossing Point30 -25 -20 -15 -<strong>The</strong>re is no mandated number <strong>of</strong> dilution points required for a standardcurve. Ideally, one would need to dilute down to 1 copy to define the LOQ.Since this is not practical, typically, 5 -10 copies will allow for determininga realistic LOQ. It is critical not to use a C q value higher than the LOQ foran experiment. Extrapolation is not recommended under any circumstances.Typically, 7 logs <strong>of</strong> dilution are required to define the LOQ. If a standardcurve is run with the unknown samples, a 5-log standard curve in duplicateis sufficient. With PCR product, this cannot be determined easily withoutdilution. <strong>The</strong> recommendation would be to make a 1/10,000 dilution andto start from there with 7 logs, each in duplicate. This only has to bedone once for each assay. However, in order to have maximum confidenceregarding PCR reagents and cycling conditions, one may elect to have thestandard curve run on every plate (with samples for that assay).2 3 4 5 6 7Log ConcentrationDelta Delta C qRelative quantification relates the PCR signal <strong>of</strong> the target transcript in atreatment group to that <strong>of</strong> another sample, such as an untreated control.<strong>The</strong> comparative C q method (also known the Delta Delta C q method, the2 –[delta][delta] C q method or dd C q ) is commonly used to compare the C q values<strong>of</strong> the samples <strong>of</strong> interest with that <strong>of</strong> the untreated control. All (sampleand control) C q values are normalized to an appropriate endogenoushousekeeping gene. For the [delta][delta]C q calculation to be valid, theamplification efficiencies <strong>of</strong> the target and the endogenous reference mustbe approximately equal. This can be established by looking at how [delta]C qvaries with template dilution. If the plot <strong>of</strong> cDNA dilution versus delta C q isclose to zero, it implies that the efficiencies <strong>of</strong> the target and housekeepinggenes are very similar. Technically, the slopes have to be nearly identicalfor a dd C q analysis. (Refer to the section on Efficiency).If a housekeeping gene cannot be found whose amplification efficiency issimilar to the target, then the standard curve method may be preferred.<strong>The</strong> MIQE Guidelines do not recommend any method. MIQE Guidelinesprovide guidance in best performance practices for all aspects <strong>of</strong> atranscript or gene quantification experiment. <strong>The</strong> quantification approachselected should be based on the requirements <strong>of</strong> the experiment.
<strong>Webinar</strong>: <strong>The</strong> <strong>Future</strong> <strong>of</strong> <strong>qPCR</strong>: Best Practices, Standardization and the MIQE guidelinesSYBR Green/TaqManOverview <strong>of</strong> TaqMan ® - and SYBR ® -Green Based Detection 4Chemistry OverviewSpecificityApplicationsAdvantagesDisadvantagesTaqMan-Based DetectionUses a fluorogenic probe to enable thedetection <strong>of</strong> a specific PCR product as itaccumulates during PCR cycles.Detects specific amplification products only.One-step RT-PCR for RNA quantitationTwo-step RT-PCR for RNA quantitationDNA/cDNA quantitation- Allelic Discrimination- Plus/Minus assays using an internalpositive control (IPC)Specific hybridization between probe andtarget is required to generate fluorescentsignal, significantly reducing backgroundand false positives.You can label probes with different,distinguishable reporter dyes, which allowsyou to amplify two distinct sequences inone reaction tube.Post-PCR processing is eliminated, whichreduces assay labor and material costs.A different probe has to be synthesizedfor each unique target sequence.SYBR-Green Based DetectionUses SYBR Green I dye, a highly specific, double-strandedDNA binding dye, to detect PCR product as it accumulatesduring PCR cycles.Detects all amplified, double-stranded DNA, includingnon-specific reaction products.One-step RT-PCR for RNA quantitationTwo-step RT-PCR for RNA quantitationDNA/cDNA quantitationEnables monitoring <strong>of</strong> the amplification <strong>of</strong> anydouble-stranded DNA sequence.No probes are required, which reduces assay setupand running costs.Multiple dyes can bind to a single amplified molecule,increasing sensitivity for detecting amplification products.Because SYBR Green I dye binds to any double-strandedDNA — including nonspecific double-stranded DNAsequences — it may generate false positive signals.SYBR vs. Probe <strong>qPCR</strong> DetectionSYBR-based detection• High-throughput screening approach• Cannot multiplex• Binds to any dsDNA formed• Melt-curve analysis• Validation <strong>of</strong> primersProbe-based detection• More focused approach• Binds selectively to target• Can perform multiplexing• Few probes allow melt-curve analysisFluorescence -d(F2)/dT6 -5 -4 -3 -2 -1 -PrimerDimers0 -45 50 55 60 65 70 75Temperature (Cº)SYBRAnnealing PhaseExtension Phase (I)Extension Phase (II)End <strong>of</strong> PCR CycleProbe
<strong>Webinar</strong> hosted by Science/AAAS and sponsored by <strong>The</strong>rmo Scientific <strong>NanoDrop</strong> and Solaris Productswww.sciencemag.org/webinarSYBR Green/TaqMan continuedBoth TaqMan and SYBR Green may be used in one tube. Naturally,this needs some optimization for primer, probe and dye concentrations.Also, the dyes on the probe cannot use the same channel as the SYBR.<strong>The</strong>refore, the instrument used must be calibrated, to ensure propercolor separation.A “No Template Control” (NTC) should be run for each assay to rule outcross contamination <strong>of</strong> reagents and surfaces. Because PCR is so sensitive,the proper primer pair can result in amplification from even very smallamounts <strong>of</strong> contaminant. Potential contamination includes that which maybe inside the pipette or contained in any stock supplies <strong>of</strong> water, primers,etc. <strong>The</strong> NTC includes all <strong>of</strong> the RT-PCR reagents except the cDNA template.Typically, the cDNA is simply substituted with nuclease-free water. Noproduct should be synthesized in the NTC. If a product is amplified, itindicates that one or more <strong>of</strong> the RT-PCR reagents is contaminated withthe target sequence.When multiplexing using SYBR chemistry (or other dsDNA binding dye),one cannot distinguish the fluorescence generated by the reaction fromdifferent amplicons. <strong>The</strong> only differentiator would be the melting curve,and that does not provide quantitative results. This is because onecan only see the “end-point” amount <strong>of</strong> PCR product. In addition, if theamplicon lengths vary considerably the melting temperatures will vary aswell. Typically, shorter amplicons are amplified more efficiently than longerones. Additionally, if the primer pairs have very different Tm values,annealing temperatures may not be optimal for all <strong>of</strong> the primers. Thismay lead to problems. For <strong>qPCR</strong>, the optimal length <strong>of</strong> the amplicon isbetween 50 – 150 bases. Amplification <strong>of</strong> products over 300 bases is notrecommended. Designing primers that generate a very long amplicon maylead to poor amplification efficiency. In cases in which longer ampliconsare necessary, optimization <strong>of</strong> the thermal-cycling protocol and reactioncomponents may be necessary.It is possible to “compare” results from different <strong>qPCR</strong> instruments,depending on what results one wants to compare. For example, in absolutequantification, one should not just compare the C q values <strong>of</strong> samples givenby different instruments. Standard curves need to be run on each instrumentand will assess if the C q values differ. This data then can be used to normalizefor the difference. Essentially, all runs need some type <strong>of</strong> control that isreproducible and can be used to compare different values.1Statistical significance <strong>of</strong> quantitative PCR. BMC Bioinformatics2007; 8:31 Karlen Y. et al.2A-Z <strong>of</strong> Quantitative PCR edited by Stephen A. Bustin3normalisation.gene-quantification.info4http://www.appliedbiosystems.com/absite/us/en/home/applications-technologies/real-time-pcr/taqman-and-sybr-greenchemistries.htmlhttp://www.gene-quantification.info/For More InformationVisit us at www.thermoscientific.com/qpcrwebinarView the webinar at www.sciencemag.org/webinar
<strong>The</strong> <strong>Future</strong> <strong>of</strong> <strong>qPCR</strong> <strong>Webinar</strong> Q&ABest Practices, Standardization and the MIQE GuidelinesFor More InformationVisit us at www.thermoscientific.com/qpcrwebinarView the webinar at www.sciencemag.org/webinarMP008 Rev. 1/2011© 2011 <strong>The</strong>rmo Fisher Scientific Inc. All rights reserved. <strong>NanoDrop</strong> is a registered trademark <strong>of</strong> <strong>The</strong>rmo Fisher Scientific Inc.,and its subsidiaries. SYBR is a registered trademark <strong>of</strong> Molecular Probes, Inc. TaqMan is a registered trademark <strong>of</strong> RocheMolecular Systems, Inc. All other trademarks are the sole property <strong>of</strong> their respective owners. Copyrights in and to thecellular images are owned by a third party and licensed for limited use only to <strong>The</strong>rmo Fisher Scientific by iStockphoto.