Production of biogas from kitchen waste, Laxman Lama, Sunil ...
Production of biogas from kitchen waste, Laxman Lama, Sunil ...
Production of biogas from kitchen waste, Laxman Lama, Sunil ...
- No tags were found...

You also want an ePaper? Increase the reach of your titles
YUMPU automatically turns print PDFs into web optimized ePapers that Google loves.
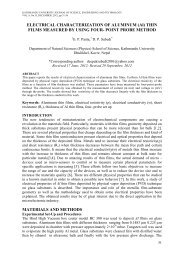
L. <strong>Lama</strong>, SP Lohani, R <strong>Lama</strong>, and JR Adhikari: <strong>Production</strong> <strong>of</strong> <strong>biogas</strong> <strong>from</strong> <strong>kitchen</strong> <strong>waste</strong><strong>Production</strong> <strong>of</strong> <strong>biogas</strong> <strong>from</strong> <strong>kitchen</strong> <strong>waste</strong><strong>Laxman</strong> <strong>Lama</strong> 1 *, <strong>Sunil</strong> Prasad Lohani 2 , Ram <strong>Lama</strong> 2 , and Jhalak Raj Adhikari 21 Department <strong>of</strong> Environmental Science and Engineering and 2 Department <strong>of</strong> Mechanical Engineering, KathmanduUniversity, NepalAbstract- The study was conducted at Kathmandu Universityand this study focuses on production <strong>of</strong> <strong>biogas</strong> as an alternativeenergy by using biodegradable <strong>kitchen</strong> <strong>waste</strong>s <strong>of</strong> KathmanduUniversity Premises. The research was conducted on modifiedARTI model compact <strong>biogas</strong> plant <strong>of</strong> 1 m 3 digester and 0.75 m 3gasholder in focusing the management <strong>of</strong> daily producedbiodegradable <strong>waste</strong>s <strong>from</strong> households. The main objective <strong>of</strong> theproject is <strong>biogas</strong> generation and analysis the feasibility, workingefficiency, health and environmental benefits <strong>of</strong> modified ARTIcompact <strong>biogas</strong> plant in urban areas. The maximum methane gaswas recorded as 65% and average maximum carbon dioxide wasrecorded as 58%. The daily temperature inside the digester wasfound in the range <strong>of</strong> (25-34 0 C) and pH value <strong>of</strong> the slurry wasfound in between (6.7-5.48). The average gas production wasfound to be 173 L/day. The maximum burning period <strong>of</strong> the gaswas approximately 62 min/day and average burning period was 26min/day. In the beginning, the proportion <strong>of</strong> methane is exceededby carbon dioxide and then after gradually methane exceededcarbon dioxide and reached 56 on average. The amount <strong>of</strong> gasproduced rate during July is low because <strong>of</strong> rainy season andincreases respectively. Since the daily feeding <strong>of</strong> 5 kg dry <strong>kitchen</strong><strong>waste</strong> produce 173 L <strong>of</strong> gas per day, per kg <strong>of</strong> <strong>kitchen</strong> <strong>waste</strong> canproduce 35 L <strong>of</strong> gas daily. The system will provide an appropriateand most efficient solution to the problem <strong>of</strong> <strong>kitchen</strong> <strong>waste</strong>enabling the recovery <strong>of</strong> energy <strong>from</strong> <strong>waste</strong>. 1Index Terms- Biodegradable kichen <strong>waste</strong>, <strong>biogas</strong>, ARTImodel compact <strong>biogas</strong> plant, energy <strong>from</strong> <strong>waste</strong>I. INTRODUCTIONOn a worldwide scale, rapid urbanization and populationgrowth respectively leads to increased solid <strong>waste</strong>generation in urban areas and have magnified the necessityfor adequate solid <strong>waste</strong> management throughout thecountry. Inadequate management like uncontrolled dumpingbears several adverse environmental and public healthproblem besides destroying the city’s beauty and hinderingcultural and religious activities. It not only leads to anuglification <strong>of</strong> the living area, but also to a high risk <strong>of</strong>polluting surface and ground water through leachate andfurthermore promotes the breeding <strong>of</strong> flies, mosquitoes, ratsand other disease vectors. In order to tackle these problemsthe disposal <strong>of</strong> organic material needs to be avoided. Aimingat sustainable development ent the organic <strong>waste</strong> as a source <strong>of</strong>nutrients and energy has to be reused however, thecomposition <strong>of</strong> the solid <strong>waste</strong> varies with cities andcountries depending on the standard <strong>of</strong> living, lifestyles,social and religious traditions, eating habits and so forth. Inorder to minimize the risk to the environment and humanhealth, economically feasible solutions are sought for thetreatment <strong>of</strong> solid <strong>waste</strong> particularly in urban areas. A planto turn solid organic <strong>waste</strong> (<strong>kitchen</strong> <strong>waste</strong>) into energythrough different ent technology has been possible; however,maximum energy recovery, and less discharge is possiblethrough anaerobic digestion that seems viable economic* Corresponding author, Lakshman_la9@hotmail.comoption for the country like Nepal. So, replacing theconventional energy resources <strong>from</strong> the <strong>biogas</strong> (modifiedARTI) technology would reduce the effect on globalwarming as well as climate change [1].Modified ARTI is a compact <strong>biogas</strong> plant which uses<strong>kitchen</strong> <strong>waste</strong> as feeding material. The slurry <strong>of</strong> feedingmaterials goes to the anaerobic decomposition to supply<strong>biogas</strong> for cooking, replacing Liquid Petroleum Gas (LPG)or Kerosene. It is a floating drum <strong>biogas</strong> plant. It consists <strong>of</strong>1000 L capacity digester <strong>of</strong> simple water storage tank and750 L capacity <strong>of</strong> gasholder which is placed upside down inthe digester. When gas starts to generate, the gasholder risesto a certain limit. It then falls down to the lower limit afterburning all gases present in the gasholder. Thus, municipalbiodegradable solid <strong>waste</strong> is in fact not a <strong>waste</strong> it’s a form <strong>of</strong>energy, which is one <strong>of</strong> the basic entities for all economicactivities.[1] Biogas does not have any geographicallimitations nor does it require advanced technology forproducing energy, also it is very simple to use and apply.Due to use <strong>of</strong> too much conventional energy resources dayby day, it is producing more pollution to the environment.To avoid the dependency on conventional energy resources,reduce negative impact on environment and make dailyenergy consumption more cost effective, management <strong>of</strong>such urban (household) <strong>waste</strong>s using modified ARTI modelseems to be best way in urban areas.II. MATERIALS AND METHODSDesign and Fabrication <strong>of</strong> ChopperFig. 1: Drawing <strong>of</strong> chopperRentech Symposium Compendium, Volume 2, December 201214
L. <strong>Lama</strong>, SP Lohani, R <strong>Lama</strong>, and JR Adhikari: <strong>Production</strong> <strong>of</strong> <strong>biogas</strong> <strong>from</strong> <strong>kitchen</strong> <strong>waste</strong>Chopper is used to chop the green cuttings, bio-degradable<strong>kitchen</strong> <strong>waste</strong> including fish <strong>waste</strong>, vegetable and cookedfood to make slurry for the production <strong>of</strong> <strong>biogas</strong>. It can alsobe used for the disposal <strong>of</strong> domestic garbage and convertingit to compost in relatively short time.The components <strong>of</strong> the chopper comprised <strong>of</strong> gear,pulleys, bearings, shafts and belt drives etc. The usedpulleys have diameters <strong>of</strong> 15 inch and 2.5 inch respectivelysince they are easily available in the market and costeffective.We also used the V belt having the total length=π/2(d 1 +d 2 ) +2*x+ (d 1 -d 2 ) 2 /4*x= 85 inchWhere, x=distance between the centers <strong>of</strong> twopulleys=28 inch, d 1 and d 2 are the diameters <strong>of</strong> the larger andsmaller pulleys.The velocity ratio <strong>of</strong> the belt drive is obtained <strong>from</strong> thefollowing equation:a) Velocity ratio = Diameter <strong>of</strong> the driver/ Diameter <strong>of</strong>the driven = 15/2.5=6This indicates that the driven pulley rotates six timesthan the driver pulley, which means if we rotate the driverpulley once then driven pulley will rotates six times helpingus to use less effort leading to higher efficiency <strong>of</strong> thechopper. Similarly, gear ratio is the relationship between thenumbers <strong>of</strong> teeth on two gears that are meshing together orare connected.b) Gear Ratio = (pitch diameter <strong>of</strong> Gear A)/(pitchdiameter <strong>of</strong> Gear B)= 6 inch/2.5 inch= 2.4This gear ratio signifies that the Gear B will have to turnalmost 2.5 times higher than Gear A so that less manualeffort helps to chop the <strong>waste</strong> in higher rate than normal. Itsaves the time as well as manual energy supply for choppingpurpose.Overall Speed <strong>of</strong> the Blade:Since the gear ratio and velocity ratio <strong>of</strong> the gear andpulley are respectively 2.4 and 6, the overall speed <strong>of</strong> theblade is (2.4+6) = 8.4. This combined ratio signifies that theblades <strong>of</strong> the chopper rotates eight times than the spinning itby human hand.The modified ARTI model compact <strong>biogas</strong> plant has twowater storage tank <strong>of</strong> size 1000L (digester) and 750L(gasholder). The digester was placed on the metal base withinsulator. The inlet pipe is fixed to the bottom <strong>of</strong> thedigester, which has elbow <strong>of</strong> 45͑and it is extended to thecentre <strong>of</strong> the digester and also supported by the metal standto ensure the proper flow <strong>of</strong> the slurry into the digester.Similarly, the outlet pipe is fixed nearly to the top <strong>of</strong> thedigester but opposite to the inlet pipe. On the other hand, thegasholder has metal ring surrounding it, this ring isconnected with the two vertical GI pipes to remove the tiltproblem <strong>of</strong> gasholder as in the case <strong>of</strong> ARTI model. Here,Gasholder <strong>of</strong> 750L, which holds the produced gas wasplaced upside down in the digester tank. [2]Fig. 2: Overall <strong>biogas</strong> plantFig. 3: Sectional view <strong>of</strong> overall plantIII. MMETHODSFig. 4: Overall processInoculum and Start-up:Rentech Symposium Compendium, Volume 2, December 201215
L. <strong>Lama</strong>, SP Lohani, R <strong>Lama</strong>, and JR Adhikari: <strong>Production</strong> <strong>of</strong> <strong>biogas</strong> <strong>from</strong> <strong>kitchen</strong> <strong>waste</strong>Initially 200-300 kg <strong>of</strong> cow dung were gradually mixedwith water and made slurry <strong>of</strong> about 500-600 L withremoval <strong>of</strong> straw material (Figure 5) [3]. The homogenousmass was then poured into the digester. Following theinstallation and inoculation, the digester was left withoutfeeding for 30 days to develop the culture inside thedigester. After that started to put the <strong>kitchen</strong> <strong>waste</strong> into thedigester.Fig. 5: Preparation <strong>of</strong> cow dung and putting it into the digester tostart- up the processPre-Treatment and Dilution <strong>of</strong> Feedstock:The objective <strong>of</strong> pre-treatment is to reduce the size <strong>of</strong>substrate particles in order to meet the basic requirement <strong>of</strong>fitting into the 4”- inlet-pipe. In addition, increasing thesurface <strong>of</strong> the feedstock allows better digestion for thebacteria responsible for the hydrolysis. The pieces <strong>of</strong> bothsubstrates were treated previous to the feeding to attain aparticle size <strong>of</strong> less than 1cm. In our study, the pre-treatment<strong>of</strong> food <strong>waste</strong> was only needed for the meat, fish and fruitpieces. They were cut up with a <strong>kitchen</strong> knife. Then putthem into the chopper to make smaller size.Preparation <strong>of</strong> Feedstock and Feeding Procedure:Organic household <strong>waste</strong> primarily consists <strong>of</strong> <strong>kitchen</strong><strong>waste</strong>, which can be divided into food leftovers and peelingsor pieces <strong>of</strong> vegetables and fruits. The food leftoversconsisted <strong>of</strong> rice, lentil, curry, vegetable (beans), potatochips, and pieces <strong>of</strong> meat with sauce and fish residue.Orange and banana peelings were also merged into the foodremains. Tooth picks and meat bones were frequently amongthe food <strong>waste</strong> and had to be removed. Fruit and vegetable<strong>waste</strong> was also obtained during the <strong>waste</strong> collection period.Its composition was spoiled fruits (papaya, orange, banana,and pineapple), spoiled vegetables (tomato, eggplant, carrot,potato, cucumber, onion, and broccoli) and vegetablepeelings (cabbage, bean). All <strong>waste</strong>s were stored in closedbuckets and used within a maximum <strong>of</strong> 4 days. Daily inaverage 5Kg <strong>of</strong> dry <strong>waste</strong> was collected and directly pouredinto the chopper and around 50% <strong>of</strong> water is also added tomake slurry. Then chop all the <strong>kitchen</strong> <strong>waste</strong> by the use <strong>of</strong>chopper to make sure that all size <strong>of</strong> <strong>waste</strong> are less than1cm.The liquid slurry <strong>from</strong> the chopper is also directly input tothe digester.Gas Measurements:The daily produced volume <strong>of</strong> gas was measured by twomethods.1. Height difference method2. Burn methodHeight difference method: This method includes themarking <strong>of</strong> the minimum and maximum point on thegasholder and then measuring tape was used to measure theexact height <strong>of</strong> produced gas in the digester. The gear valvewas open to release the gas and then closed to mark theminimum (initial) height. The gas holder rises up to thecertain limit because <strong>of</strong> daily slurry input and that height isrecorded as final height <strong>of</strong> the produced gas. The differencebetween the final and initial height gives the exact heightdifference <strong>of</strong> the produce gas. [4]Burn method: In this method, the gas stove was used toburn the produce gas and daily burning time after theaddition <strong>of</strong> <strong>kitchen</strong> <strong>waste</strong> was also recorded to know the rate<strong>of</strong> produce gas. [4]Gas Composition:The Dräger X-am 7000 (Gas Analyzer) was used tomeasure the volume percentage <strong>of</strong> methane (CH 4 ) andcarbon dioxide (CO 2 ) in the <strong>biogas</strong>. The gas compositionwas measured on a daily basis in the afternoon (beforefeeding) while releasing the gas.Gas (L)250200150100500IV. RESULTS AND DISCUSSIONS1 5 9 13 17 21 25 29 33 37 41 45 49 53 57 61DaysFig. 6: Gas production versus daysThe line graph shows how the production <strong>of</strong> gas changedday by day on daily feeding <strong>of</strong> average 5 kg <strong>of</strong> dry <strong>kitchen</strong><strong>waste</strong>, obtained after the 10 days to 16 days <strong>from</strong> thefeeding <strong>of</strong> <strong>kitchen</strong> <strong>waste</strong>, measured by height differencemethods. The first day <strong>of</strong> the feeding <strong>of</strong> <strong>kitchen</strong> <strong>waste</strong>represents 31 days in the above graph.Rentech Symposium Compendium, Volume 2, December 2012 16
L. <strong>Lama</strong>, SP Lohani, R <strong>Lama</strong>, and JR Adhikari: <strong>Production</strong> <strong>of</strong> <strong>biogas</strong> <strong>from</strong> <strong>kitchen</strong> <strong>waste</strong>At the beginning, volume <strong>of</strong> the gas production was seenlow due to improper digester culture, lower digestertemperature, lack <strong>of</strong> PH maintain and due to rainy season.Thereafter, gases were consistently above 110 L <strong>from</strong> 15days daily, rising sharply to a peak <strong>of</strong> 210L in 25 days. Forthe next however, there was a sudden decreasein gasproduction and reached to 190 L for 26 and 27 days, afterthat gas production rate remained steadily to a value <strong>of</strong>186L.In conclusion, the amount <strong>of</strong> <strong>biogas</strong> increased graduallyalong with increasing amount <strong>of</strong> feeding materials anddigestion period. The maximum <strong>of</strong> about 173000 ml/daywas recorded .The gas generation per kg fresh feedingmaterials depends upon the type and digestibility <strong>of</strong> feedingmaterials as well as digester temperature etc. and fullydeveloped inside culture.% by volumeCH4 and CO2 producion806040CH420CO201 2 3 4 5 6 7 8 9 10 11 12Fig. 8: Methane e versus carbon dioxideOverall, the graph shows that the percentage <strong>of</strong> methaneexceeded the percentage <strong>of</strong> carbon dioxide as the timepasses and in fully favorable environment for the bacteria,indicating Methane content also depends upon the digestertemperature and well developed culture.Fig. 7: PH versus daysThe graph shows the variation <strong>of</strong> PH value <strong>of</strong> thedigester slurry with days. Here, 31 days in the above linegraph shows the first day for the feeding <strong>of</strong> <strong>kitchen</strong> <strong>waste</strong>,conducted in between July-August, 2012. It is clear to knowthat the daily feeding is about 5 kg dry <strong>kitchen</strong> <strong>waste</strong>s inaverage.First <strong>of</strong> all, it is clearly seen <strong>from</strong> the graph that at thebeginning, the pH is on higher side (indicating almost 6.7),as reaction inside the digester continues it stars decreasingand it becomes more acidic. The PH <strong>of</strong> slurry decreaseshighly means reaction is fast, means hydrolysis andacitogenesis reaction is fast as organism utilizes the <strong>waste</strong>more speedily than dung. Also the pH reduces as the processgoing on as the bacteria produces fatty acids, is slowreaction compare to other so it is rate limiting step inreaction. Then water added to dilute and thus pH increasesand remains almost constant means dropped to about 5.48)as shown in the Fig 10. It is interesting however, that therange <strong>of</strong> the PH value was found in between 5.48 to 6.7.In conclusion, PH value entirely depends on the feedingmaterials, the time duration as well as digester temperature.The graph represents the percentage <strong>of</strong> methane and carbondioxideproduced for twelve days July 22 to August 6, 2012.The most significant feature is that Carbon dioxiderepresents 58% by volume <strong>of</strong> gas, whereas, methane seemsto be 43%, at the first day <strong>of</strong> measurement. Thereaftercomposition <strong>of</strong> CO 2 gradually ly decreases and dropped to avalue <strong>of</strong> 40% by volume for the last day <strong>of</strong> experiment. Onthe other hand, the percentage <strong>of</strong> methane sharply increasesand picked to the value <strong>of</strong> 62% by volume in last day.Rentech Symposium Compendium, Volume 2, December 2012Fig. 9: Burn time versus daysThe diagram represents the Burn time (minutes)observed in days on daily feeding <strong>of</strong> 5 kg dry <strong>kitchen</strong> <strong>waste</strong>.Here, 35 days in the graph shows fifth day <strong>of</strong> the feeding <strong>of</strong><strong>kitchen</strong> <strong>waste</strong> and so on.In the first day <strong>of</strong> the burn time measurement, theobserved burn time was 62 min. It was the maximum time <strong>of</strong>burning, because, the produced gases are only the outcomes<strong>of</strong> the homogeneous mass <strong>of</strong> cow dung and <strong>kitchen</strong> <strong>waste</strong> <strong>of</strong>4/5 days. Then the burn time gradually decreases becausethe produced gases are the outcomes <strong>of</strong> <strong>kitchen</strong> <strong>waste</strong> onlyand because <strong>of</strong> lower temperature since the research periodis rainy season and then slightly increases because <strong>of</strong>increase in digestion period.3002001000Temp Vs Gas <strong>Production</strong>1 4 7 1013161922252831Temp(0C)Gas production(L)Fig. 10: Variation <strong>of</strong> temperature and gas productionThe graph shows the variation <strong>of</strong> gas production withvarying the digester temperature.Initially, the temperature inside the digester is low .Themeasurement was taken 17 days after the feeding <strong>of</strong> the<strong>kitchen</strong> <strong>waste</strong>, after that production <strong>of</strong> gradually increasesand picked to 210 L in 29 days. Finally, due to welldevelopedculture and maintained inside temperature gasproduction remained almost constant.17
L. <strong>Lama</strong>, SP Lohani, R <strong>Lama</strong>, and JR Adhikari: <strong>Production</strong> <strong>of</strong> <strong>biogas</strong> <strong>from</strong> <strong>kitchen</strong> <strong>waste</strong>TABLE IDATA SHEET FOR OVERALL MEASUREMENTDate T ( 0 C) P H P (Pa) Slurry in(kg)Slurry Out (kg) Gas (L) CH 4(%)CO 2(%)Burn time (min)July 20July 21July 22July 23July 24July 25July 26July 27July 28July 29July 30July 31Aug-1Aug-2Aug-3Aug-4Aug-5Aug-6Aug-7Aug-8Aug-9Aug-10Aug-11Aug-12Aug-13Aug-14Aug-15Aug-16Aug-17Aug-18Aug-19Aug-20Aug-21Aug-22Aug-23252425272625272827252629292829262830302929292828272830303131326.76.56.426.46.46.265.785.675.675.75.775.85.85.85.85.85.665.635.7565.95.95.95.85.625.525.525.5227327327327327327327327327327327327327327327327327327327327327327327327327327327327327327327327327327327310101010101011111111121212121212126666666111112121313136.2665.85.86.33.43.2332.932.85.65.75.65.75.866.26.356.436.5115.59124.37122.91131.69139153.64160.95168.27175.58197.53208.51199.73203.38201.9219942455155565859616365646458565551464443424240404662323234343637373832333334141414It is interesting to note, however, that the variation <strong>of</strong>temperature is because <strong>of</strong> rainy season and the range <strong>of</strong>inside temperature was in between 24 to 33 degree Celsius.V. CONCLUSIONThe Concept <strong>of</strong> Kitchen Waste Utilization using amodified ARTI Compact Plant for Biogas <strong>Production</strong> <strong>of</strong>ferseffective Waste Management and Resource Developmentsolutions with positive measures for the economy, improvedair quality and sustained energy security. So, anaerobicdigestion <strong>of</strong> Kitchen <strong>waste</strong> using modified ARTI compact<strong>biogas</strong> plant is a proven technology for processing sourceseparatedorganic <strong>waste</strong>s and has experienced significantgrowth recently.In overall, the modified ARTI Compact <strong>biogas</strong> system(CBS) seems more feasible and economical <strong>biogas</strong> plant forhouseholds in urban areas, as organic solid <strong>waste</strong> generatedin rural region are preferably used as animal feed. This planthelps to the management <strong>of</strong> an organic <strong>waste</strong> generation inurban areas as well as saves the consumption <strong>of</strong> LPG gasand money in the long term (by replacing conventionalcooking fuel).In is interesting to note, however, that in our study it wasfound that, the average daily gas production per Kg <strong>of</strong> dry<strong>kitchen</strong> <strong>waste</strong> is 35 L. So, by storing the 2-3 days’ gas it willbe equivalent to consumption <strong>of</strong> 1 days LPG gas.REFERENCES[1] Nijaguna B.T., Biogas Technology, New age international (P) Ltd,Publishers, (2006).[2] H.M. Lungkhimba, A.M. Karki, J. N. Shrestha, “Biogas production<strong>from</strong> anaerobic digestion <strong>of</strong> biodegradable household <strong>waste</strong>s,”Tribhuvan University, Nepal.[3] Karve .A.D., “Compact <strong>biogas</strong> plant, a low cost digester for <strong>biogas</strong><strong>from</strong> <strong>waste</strong> starch,” (2007). http://www.arti-india.org.[4] ARTI, “ARTI Biogas Plant: A compact digester for producing <strong>biogas</strong><strong>from</strong> food <strong>waste</strong>, how to build the ARTI compact <strong>biogas</strong> digester,”2008.Rentech Symposium Compendium, Volume 2, December 2012 18