3.7 hazardous materials and hazardous waste - Missile Defense ...
3.7 hazardous materials and hazardous waste - Missile Defense ...
3.7 hazardous materials and hazardous waste - Missile Defense ...

Create successful ePaper yourself
Turn your PDF publications into a flip-book with our unique Google optimized e-Paper software.
Chapter 3—Affected Environment<strong>3.7</strong> HAZARDOUS MATERIALS ANDHAZARDOUS WASTE MANAGEMENTThe relevant aspects of <strong>hazardous</strong> <strong>materials</strong>/<strong>waste</strong> management includethe applicable regulatory procedures for <strong>hazardous</strong> <strong>materials</strong> usage <strong>and</strong><strong>hazardous</strong> <strong>waste</strong> generation, <strong>and</strong> management programs for existing<strong>hazardous</strong> <strong>waste</strong>-contaminated sites within areas potentially affected bythe NMD program.The <strong>hazardous</strong> <strong>materials</strong> <strong>and</strong> <strong>hazardous</strong> <strong>waste</strong> management section willprovide an overview of <strong>hazardous</strong> <strong>materials</strong> management, includingstorage tanks, <strong>hazardous</strong> <strong>waste</strong> management, pollution preventioninitiatives, Installation Restoration Program (IRP) sites, asbestos,polychlorinated biphenyls (PCBs), lead-based paint, radon, <strong>and</strong> pesticides.Hazardous <strong>materials</strong> <strong>and</strong> <strong>hazardous</strong> <strong>waste</strong> management activities aregoverned by specific environmental regulations. For the purposes of thefollowing analysis, the terms <strong>hazardous</strong> <strong>materials</strong> or <strong>hazardous</strong> <strong>waste</strong> willmean those substances defined by both Federal <strong>and</strong> state regulations. Ingeneral, this includes substances that, because of their quantity,concentration, or physical, chemical, or infectious characteristics, maypresent substantial danger to public health or welfare or the environmentwhen released into the environment. Hazardous <strong>waste</strong> is further definedin 40 CFR 261.3 as any solid <strong>waste</strong> that possesses any of the hazardcharacteristics of toxicity, ignitibility, corrosivity, or reactivity.Solid <strong>waste</strong> is defined as any discarded material (in effect, ab<strong>and</strong>oned,recycled, inherently <strong>waste</strong>-like, or no longer suitable for its intendedpurpose) that is not specifically excluded in 40 CFR 261.4. Thisdefinition can include <strong>materials</strong> that are both solid <strong>and</strong> liquid (butcontained). Transportation of <strong>hazardous</strong> <strong>materials</strong> is regulated by theU.S. Department of Transportation regulations within 49 CFR.<strong>3.7</strong>.1 ALASKA INSTALLATIONS<strong>3.7</strong>.1.1 Clear AFS—Hazardous Materials <strong>and</strong> Hazardous WasteManagementThe ROI for <strong>hazardous</strong> <strong>materials</strong> <strong>and</strong> <strong>hazardous</strong> <strong>waste</strong> management atClear AFS includes the Clear AFS infrastructure <strong>and</strong> existing facilities,with some NMD facilities located in the base construction camp.Hazardous Materials ManagementHazardous <strong>materials</strong> are regularly used <strong>and</strong> stored throughout Clear AFS.The most commonly utilized <strong>hazardous</strong> <strong>materials</strong> include paints, paintthinners <strong>and</strong> removers, adhesives, solvents, sodium dichromate,hydrostatic fluids, batteries, pesticides, petroleum, oil, <strong>and</strong> lubricants.Hazardous <strong>materials</strong> are controlled <strong>and</strong> managed through a pharmacy3-188 NMD Deployment Final EIS
Chapter 3—Affected Environmentprogram (see Pollution Prevention section). Hazard Communication(HAZCOM) training is provided to all personnel whose jobs involveh<strong>and</strong>ling or managing <strong>hazardous</strong> <strong>materials</strong>. Material Safety Data Sheetsfor <strong>hazardous</strong> <strong>materials</strong> are maintained on file in the workplace wherethey are used or stored <strong>and</strong> in a central repository maintained on theHazardous Material Information System.There are 29 aboveground storage tanks, ranging in size from 189 to113,562 liters (50 to 30,000 gallons), at Clear AFS. They serve asstorage tanks for petroleum for building heat <strong>and</strong> vehicle fueling. (13CWS/CC, 1999—Comments received by EDAW, Inc., regarding the NMDDeployment Preliminary Draft EIS) All underground storage tanks havebeen removed from Clear AFS (EDAW, Inc., 1998—Trip Report of visit toAlaska, July 20–31).Clear AFS has developed a Spill Prevention <strong>and</strong> Response Plan whichcombines both a Spill Prevention Control <strong>and</strong> Countermeasures Plan thatdescribes the procedure, methods, <strong>and</strong> equipment used to prevent spills,<strong>and</strong> an Oil <strong>and</strong> Hazardous Substances Pollution Contingency Plan thatdetails procedures for releases, accidents, <strong>and</strong> spills involving thesesubstances. The base also complies with the Emergency Planning <strong>and</strong>Community Right-to-Know Act (EPCRA) reporting requirements bysubmitting annual emergency response <strong>and</strong> extremely <strong>hazardous</strong>substances updates to local emergency management officials.Hazardous Waste ManagementClear AFS is a large quantity generator of <strong>hazardous</strong> <strong>waste</strong> <strong>and</strong> is allowedto accumulate <strong>waste</strong> for up to 90 days. (13 CWS/CC, 1999—Commentsreceived by EDAW, Inc., regarding the NMD Deployment PreliminaryDraft EIS) Hazardous <strong>waste</strong> streams generated by operations at ClearAFS include <strong>waste</strong> paint, <strong>waste</strong> paint with methyl ethyl ketone, <strong>waste</strong>paint with lead <strong>and</strong> mercury, solvents, methyl ethyl ketone, batteries,<strong>waste</strong> oil with lead, <strong>waste</strong> oil with sulfide, <strong>waste</strong> oil with cadmium,<strong>waste</strong> oil with chromium, <strong>and</strong> spill residuals. In 1997, Clear AFSgenerated 4,977 kilograms (10,973 pounds) of <strong>hazardous</strong> <strong>waste</strong>(Department of the Air Force, 1998—Hazardous Waste Report for 1997).Clear AFS operates one central accumulation point for storage of<strong>hazardous</strong> <strong>waste</strong> located in the composite area at Building 250 (U.S.Department of the Air Force, 1997—EA for Radar Upgrade, Clear AS).Waste from the six satellite accumulation points is forwarded to thecentral accumulation point. These satellite accumulation points arelocated at the Technical Site (Buildings 101 <strong>and</strong> 102), the Power Plant(Building 111), the Motor Pool (Building 196), the Civil Engineer Shop(Building 62), <strong>and</strong> the Auto Hobby Shop (Building 51). (Clear AS,1998—Hazardous Waste Management Plan)NMD Deployment Final EIS 3-189
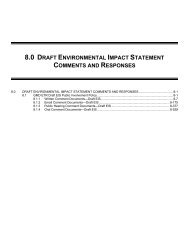
Chapter 3—Affected EnvironmentClear AFS has developed a Hazardous Waste Management Plan thatincludes designation of responsible personnel, <strong>hazardous</strong> <strong>waste</strong>identification <strong>and</strong> management practices, training requirements,<strong>hazardous</strong> <strong>waste</strong> storage, accumulation point managers, <strong>and</strong> turn-inprocedures.Pollution PreventionClear AFS has developed a Pollution Prevention Management Plan, whichaids in the elimination or reduction of <strong>hazardous</strong> substances, pollutants,<strong>and</strong> contaminants.Clear AFS also administers a <strong>hazardous</strong> <strong>materials</strong> pharmacy programknown as HAZMART to manage <strong>hazardous</strong> <strong>materials</strong>. This system tracks<strong>hazardous</strong> <strong>materials</strong> from the point at which they are brought onto thefacility until they are brought back to the pharmacy either as an emptycontainer or as excess material. This pollution prevention initiative isdesigned to control <strong>and</strong> reduce the amount of <strong>hazardous</strong> <strong>materials</strong> at theinstallation.Recycling capabilities in Alaska are very limited. However, at Clear AFSused oil, asphalt, rags, <strong>and</strong> assorted paper are mixed with coal <strong>and</strong>burned in the power plant as a supplemental fuel source. Since 1992, anaverage of 22,525 liters (5,950 gallons) of <strong>waste</strong> oil, 665 kilograms(1,470 pounds) of asphalt, 2,655 kilograms (5,850 pounds) of rags, <strong>and</strong>2,790 kilograms (6,150 pounds) of paper per year have been burned inthe power plant. (U.S. Department of the Air Force, 1997—EA for RadarUpgrade Clear AS)Installation Restoration ProgramIRP investigations at Clear AFS since 1991 have identified 23 sites ofpotential contamination. Of these sites, 22 are considered closed sites,pending state written approval. Eleven of the identified sites are locatedon or near the proposed NMD sites (figure <strong>3.7</strong>-1). Table <strong>3.7</strong>-1 lists thetypes of contamination identified at these sites. Clear AFS is not on theNational Priorities List site <strong>and</strong> does not have a Federal FacilityAgreement.During initial site investigations for construction at the phased array radarfacility location in August 1996, several ab<strong>and</strong>oned drums, old batteries,<strong>and</strong> other debris were found. The area has been identified as an area ofconcern, <strong>and</strong> further evaluation is in progress. (U.S. Department of theAir Force, 1997—EA Radar Upgrade Clear AS)3-190 NMD Deployment Final EIS
Index MapAnderson RoadClear AFSAlaskaNenana RiverLake SansingPhased-ArrayRadar168CoolingPondTech Site1821 51917CampSite4CompositeArea910Clear AirportRadio RelayStation20Clear Air Force StationAlaska RailroadParks HighwayEXPLANATIONRoadsL<strong>and</strong> AreaWater AreaIRP SitesInstallation BoundaryRailroadsInstallation RestorationProgram (IRP) Sites,Clear Air Force StationNORTHScale0 2,500 5,000 Feet0 762 1,524 MetersAlaskaFigure <strong>3.7</strong>-1Hw_clas_001_newNMD Deployment Final EIS3-191
Chapter 3—Affected EnvironmentTable <strong>3.7</strong>-1: IRP Sites at Clear AFS Near Potential NMD SitesSite No. Site Description/Location Activities/Findings4 Ab<strong>and</strong>oned l<strong>and</strong>fill Wooden <strong>and</strong> metal debris5 Coal stockpile for power plant Soil <strong>and</strong> groundwater contamination8 Underground storage tank location Fuel spill9 Previous underground storage tanklocationGasoline contamination10 Radioactive material storage Radioactive electronic tube burial16 Power plant PCB transformers17 Power plant oil/water overflow Surface soil contamination18 Power plant thaw shed infiltrationpond19 Vehicle maintenance drainage crib(Building 196)Surface soil contaminationDiesel <strong>and</strong> gasoline contamination20 Building 85 (demolished) Construction camp diesel generatorleaks21 Auto Service Grease Pad (Building 1) Oil, fuel, <strong>and</strong> solvent spillsSource: U.S. Air Force, 1995 Environmental Restoration Program; Perry, 1999—PersonalCommunication; Perry, 1999—Facsimile communication.AsbestosClear AFS has developed an Asbestos Management Plan <strong>and</strong> an AsbestosOperations Plan. The Asbestos Management Plan includes designatedpersonnel responsible for asbestos management such as the AsbestosProgram Officer <strong>and</strong> the Asbestos Operations Officer; descriptions ofasbestos management activities including data collection <strong>and</strong>identification; <strong>and</strong> discussions of recordkeeping procedures such as theasbestos database management. The Asbestos Operations Plan isdesigned to implement the procedures discussed in the AsbestosManagement Plan, <strong>and</strong> to establish procedures for asbestos abatement.The operations plan includes budgeting concerns, planning procedures,notification requirements, health <strong>and</strong> safety equipment requirements, <strong>and</strong>an overview of a small-scale removal.An asbestos survey was conducted on all facilities on Clear AFS in 1986.All facilities contain asbestos except the main dormitory, which wasremodeled (EDAW, Inc., 1998—Trip Report of visit to Alaska, July 20–31). Prior to any building modifications, all asbestos in the affected areais removed in accordance with Federal Regulations. Asbestos-containingmaterial <strong>waste</strong>s are disposed of in the Clear AFS l<strong>and</strong>fill, which ispermitted to accept asbestos.3-192 NMD Deployment Final EIS
Chapter 3—Affected EnvironmentAsbestos management activities at Clear AFS are h<strong>and</strong>led by theinstallation’s Operation <strong>and</strong> Maintenance contractor. The contractor’scivil engineering manager <strong>and</strong> environmental coordinator are designatedas the Asbestos Program Officer <strong>and</strong> Asbestos Operations Officer,respectively. Up to 0.3 square meter (3 square feet) of asbestoscontainingmaterial can be h<strong>and</strong>led by the installations’ contractor.Asbestos repair or removal of more than 0.3 square meter (3 square feet)of asbestos-containing material will be h<strong>and</strong>led by other contractorsspecializing in asbestos abatement.Polychlorinated BiphenylsThe PCB program at Clear AFS is managed by a contractor under thedirection of the Environmental Coordinator’s office, with support fromCivil Engineering, Technical Site, <strong>and</strong> logistics personnel. A sitewide PCBinventory was conducted in 1990, <strong>and</strong> all known PCB <strong>and</strong> PCBcontaminatedequipment has either been removed or purged <strong>and</strong> refilledwith non-PCB fluid. Radio frequency interference filters, small capacitors,<strong>and</strong> fluorescent light ballasts are the remaining potentially PCBcontaminatedequipment on the installation. Removal of the suspectedPCB-contaminated radio frequency interference filters is planned. Asballasts <strong>and</strong> small capacitors are replaced, they are stored in Building 252for later disposal in accordance with applicable regulations. (U.S.Department of the Air Force, 1997—EA Radar Upgrade Clear AS)Lead-based PaintMost of the buildings on Clear AFS contain lead-based paint except fordormitories 203 <strong>and</strong> 204, which have been remodeled. Dormitory 202 isscheduled for renovation <strong>and</strong> will be free from lead-based paint in thenear future (EDAW, Inc., 1998—Trip Report of visit to Alaska, July 20–31). Prior to any building modification, all lead-based paint in theaffected area is removed in accordance with Federal regulations. ClearAFS has a comprehensive lead-based paint management plan (Novak,1999—Comments received by EDAW, Inc. regarding the NMDDeployment Preliminary Draft EIS).RadonWith guidance from the Bioenvironmental Engineer at Eielson AFB, ClearAFS has developed <strong>and</strong> administrated a radon assessment <strong>and</strong> mitigationprogram. Radon inspection surveys were performed for Clear AFS in1995. Radon levels were found to be well below the current U.S. EPAguidelines of 4 picocuries per liter (Clear AS, 1995—Site RadonInspection Report).NMD Deployment Final EIS 3-193
Chapter 3—Affected EnvironmentPesticidesThe use of pesticides at Clear AFS is only on an as-needed, seasonalbasis. Applications are kept to a minimum, <strong>and</strong> are restricted todeveloped areas of the installation. When utilized, pesticides are preapprovedby the Federal Pesticides Working Group <strong>and</strong> applied by statecertifiedpersonnel. Aerial spraying is not conducted, nor are pesticidesapplied to any waters of the state (U.S. Department of the Air Force,1998—Grounds Management <strong>and</strong> Urban Forest Management Plan).<strong>3.7</strong>.1.2 Eareckson AS—Hazardous Materials <strong>and</strong> Hazardous WasteManagementThe ROI for <strong>hazardous</strong> <strong>materials</strong> <strong>and</strong> <strong>hazardous</strong> <strong>waste</strong> managementincludes Eareckson AS for general operations. The XBR <strong>and</strong> support mayrequire the use of base infrastructure <strong>and</strong> existing facilities.Hazardous Materials ManagementEareckson AS routinely receives <strong>and</strong> stores small quantities of <strong>hazardous</strong><strong>materials</strong>, including a variety of flammable <strong>and</strong> combustible liquids suchas aviation fuels. Additional <strong>hazardous</strong> <strong>materials</strong> utilized by the baseinclude acids, corrosives, compressed gases, hydraulic fluids, solvents,paints, paint thinners, <strong>and</strong> lubricants. Supplies, including petroleumproducts, arrive either by barge during the summer months or by aircraftyear round. JP-8 <strong>and</strong> gasoline arrive by barge <strong>and</strong> are stored in bulkstorage tanks since they are used in large quantities. Most otherpetroleum products <strong>and</strong> chemicals are used in much smaller quantities<strong>and</strong> typically arrive in 208-liter (55-gallon) drums or smaller containers(U.S. Department of the Air Force, 1997—Final Installation-Wide BaselineSurvey). Hazardous <strong>materials</strong> are controlled <strong>and</strong> managed through a<strong>hazardous</strong> <strong>materials</strong> program.Storage tanks <strong>and</strong> associated piping systems at Eareckson AS are usedto store <strong>and</strong> distribute various petroleum products or <strong>waste</strong>s, <strong>and</strong> othermiscellaneous products. There are 47 aboveground storage tanks <strong>and</strong> 17underground storage tanks currently utilized at Eareckson AS. (Hostman,1999—Comments received by EDAW, Inc., regarding NMD DeploymentPreliminary Draft EIS). All aboveground storage tanks at Eareckson ASare currently being evaluated to determine whether they are needed tosupport operations under the existing Base Operation Support Contract.Unneeded tanks <strong>and</strong> their associated pipelines that are found to be inexcess will be cleaned, closed, <strong>and</strong> removed.Eareckson AS administers a Storm Water Pollution Prevention Plan(SWPPP) Management Program that was amended in July 1995 after thebase restructuring. The plan includes site specific good housekeepingpractices, facility surveys, satellite accumulation area inspections, vehicle3-194 NMD Deployment Final EIS
Chapter 3—Affected Environmentinspections conducted daily by the operator, employee training, preventivemaintenance, <strong>and</strong> spill prevention <strong>and</strong> response. Eareckson AS alsomaintains an Oil <strong>and</strong> Hazardous Substance Discharge Prevention <strong>and</strong>Contingency Plan that addresses spill prevention <strong>and</strong> preparedness. Thebase also complies with EPCRA reporting requirements by submittingannual emergency response <strong>and</strong> extremely <strong>hazardous</strong> substances updatesto the local emergency management officials.Hazardous Waste ManagementEareckson AS has implemented a Hazardous Waste Management Plan thatsets forth the policies <strong>and</strong> procedures to be followed when h<strong>and</strong>ling<strong>hazardous</strong> <strong>waste</strong>s. Hazardous <strong>waste</strong>s generated at Eareckson AS includesolvents, petroleum, oil <strong>and</strong> lubricants, fuel <strong>waste</strong>s, batteries, asbestos,PCBs, <strong>and</strong> <strong>waste</strong>s generated from site remediation (Piquniq ManagementCorporation, 1997—Hazardous Waste Management Plan). Eareckson ASis defined as a small quantity generator by the U.S. EPA <strong>and</strong> generatesless than 100 kilograms (220 pounds) of <strong>hazardous</strong> <strong>waste</strong> per month.Hazardous <strong>waste</strong>s <strong>and</strong> <strong>waste</strong> petroleum products are accumulated atapproximately 17 locations throughout the installation (U.S Departmentof the Air Force, 1997—Final Installation-Wide Baseline Survey).Eareckson AS is not permitted to dispose of <strong>hazardous</strong> <strong>waste</strong>s. All<strong>hazardous</strong> <strong>waste</strong>s with no energy recovery potential are sent to the<strong>Defense</strong> Reutilization <strong>and</strong> Marketing Office at Elmendorf AFB (PiquniqManagement Corporation, 1997—Hazardous Waste Management Plan).Pollution PreventionThe majority of <strong>waste</strong> streams at Eareckson AS are recycled or utilizedfor energy recovery. Used fuel, oil, oil filters, absorbent pads, <strong>and</strong> otherpetroleum contaminated <strong>waste</strong> solids are burned for energy recovery.Antifreeze is collected <strong>and</strong> recycled for reuse on the facility. Batteriesare maintained for recycling through the <strong>Defense</strong> Reutilization <strong>and</strong>Marketing Office, <strong>and</strong> products such as transformer silicon oil arereturned to the manufacturer for recycling. (Piquniq ManagementCorporation, 1997—Hazardous Waste Management Plan).Installation Restoration ProgramThe Air Force began the IRP process at Eareckson AS in 1984. Fifty IRPsites at Eareckson AS have been identified. Major PreliminaryAssessment activities were conducted at the installation during 1984,1988, 1992, 1993, <strong>and</strong> 1994. Additional information was gathered fromsite inspections, remedial investigations, <strong>and</strong> feasibility studies conductedat the 50 sites. Figure <strong>3.7</strong>–2 shows the 50 sites. Restoration activitieswere conducted at many of the Eareckson AS sites prior to thePreliminary Assessment conducted from 1992 to 1994. (U.SNMD Deployment Final EIS 3-195
Index MapEarecksonASAlaskaFT02Shemya PassSS07ST46ST44SS05ST09Bering SeaST39SS04OT19RUNWAY "C" - Ab<strong>and</strong>onedRUNWAY "B" - Ab<strong>and</strong>onedSS1210,000' RUNWAY - ActiveST37SS14ST45FoxBeachLF27LF28Pacific OceanEXPLANATIONRoadsNORTHhw_eas_0013-196L<strong>and</strong> AreaWater AreaIRP SitesNo Further ActionDecision SitesScale0 1,738 3,475 Feet0 530 1,059 MetersNMD Deployment Final EISInstallationRestoration Program(IRP) Sites, EarecksonAir StationAlaskaFigure <strong>3.7</strong>-2
Chapter 3—Affected EnvironmentDepartment of the Air Force, 1997—Final Installation-Wide BaselineSurvey)There are ordnance concerns for Eareckson AS at three locationsadministered by the IRP. The OT29 Ammunition Disposal at 50 CaliberBeach was the dumping ground for mass quantities of munitions after theend of World War II. The OT19 Hospital Lake <strong>and</strong> OT49 Upper Lakehave also been identified as having known or suspected quantities ofmunitions. The OT19 Hospital Lake is also a potential, but unconfirmed,medical/bio<strong>hazardous</strong> <strong>waste</strong> site. (U.S. Department of the Air Force,1997—Final Installation-Wide Baseline Survey)Table <strong>3.7</strong>-2 lists the most significant IRP sites near the potential XBR site<strong>and</strong> potential support facilities. Figure <strong>3.7</strong>-2 also shows these sites.Table <strong>3.7</strong>-2: IRP Sites at Eareckson AS Near Potential NMD SitesSite No. Site Description/Location Activities/FindingsSS04 Old Hospital Site Identified World Was II-era metals <strong>and</strong>PCBsSS05 Old COBRA DANE Identified transformer oil, <strong>waste</strong> oil,<strong>and</strong> diesel fuelSS07 West End Oil/Water Separator Identified <strong>waste</strong> oil <strong>and</strong> POLsSS12 Old White Alice Site Identified POL <strong>and</strong> PCBsST09 Power Plant Spills Identified POL, <strong>waste</strong> oil, <strong>and</strong> PCBsST46 Ab<strong>and</strong>oned Tank Farm No previous investigation; suspecteddiesel fuelOT19 Hospital Lake Identified ordnance, ammunition,metals, nitrates, <strong>and</strong> nitrites;suspected medical/bio<strong>hazardous</strong><strong>waste</strong>FT02Aircraft Mock-up/Ab<strong>and</strong>onedDrums/Fire Training AreaIdentified <strong>waste</strong> oil, diesel, JP-4, <strong>and</strong>208-liter (55-gallon) drumsLF27 Base Sanitary L<strong>and</strong>fill Identified miscellaneous debris <strong>and</strong>rubbishLF28 Scrap Metal L<strong>and</strong>fill Identified metal debrisSS23 Past Drum Storage Area Identified POLs, petroleum <strong>waste</strong>s,<strong>and</strong> solventsST39 USTs 110-1 through 110-4 Suspected diesel fuelST44 UST 3051-1 Suspected <strong>waste</strong> oilSource: U.S. Department of the Air Force, 1997—Final Installation-Wide Baseline SurveyNotes: PCB = polychlorinated biphenyls; POL = petroleum, oil, lubricant; UST = undergroundstorage tankNMD Deployment Final EIS 3-197
Chapter 3—Affected EnvironmentAsbestosA comprehensive asbestos survey for Eareckson AS was completed in1992. Based on the results of the basewide asbestos survey, asbestoscontainingmaterial is assumed or confirmed to be present in 48 facilities.In compliance with st<strong>and</strong>ard Air Force regulations, any friable asbestoscontainingmaterial must be removed if it is likely to release airbornefibers <strong>and</strong> can not be reliably maintained, repaired, or isolated. Allasbestos-containing material identified as non-friable does not present ahealth hazard at this time as long as the material is not disturbed. Thebase asbestos manager is contacted at all times before any demolition orrenovation occurs in order to take proper action <strong>and</strong> prevent materialfrom becoming airborne. No immediate health hazard exists in thosefacilities in which the asbestos has been determined to be non-friable.However, the condition of asbestos in several buildings is unknown <strong>and</strong>needs to be investigated further (U.S. Department of the Air Force,1997—Final Installation-Wide Baseline Survey).Polychlorinated BiphenylsAll electrical equipment containing PCBs at Eareckson AS has beenreplaced, <strong>and</strong> PCB-containing transformers have been fully cleansed ofthe PCB-containing fluids. Eareckson AS is considered PCB free (EDAW,Inc., 1998—Trip Report of visit to Shemya, Alaska, April 24–May 1).Lead-based PaintNo facilities at Eareckson AS have been tested for lead-based paint. Itshould be assumed that most facilities constructed before theimplementation of the DOD ban on the use of lead-based paint in 1978are likely to contain one or more coats of such paint, <strong>and</strong> are a probableconcern. Sixty-nine existing facilities at the site were constructed before1978. (U.S. Department of the Air Force, 1997—Final Installation-WideBaseline Survey).RadonRadon testing was conducted at Eareckson AS in May 1988. Of the 12samples taken, 10 were below the U.S. EPA guidelines of 4 picocuriesper liter, <strong>and</strong> 2 were below detection levels (U.S. Department of the AirForce, 1997—Final Installation-Wide Baseline Survey). Hence, radon isnot a concern at Eareckson AS.PesticidesThe use of pesticides in <strong>and</strong> around Eareckson AS has not been limited tospecific sites. The low levels of pesticides detected in sampling mediathroughout the installation are consistent with the controlled application3-198 NMD Deployment Final EIS
Chapter 3—Affected Environmentof pesticide for insect control (U.S. Department of the Air Force, 1997—Final Installation-Wide Baseline Survey).<strong>3.7</strong>.1.3 Eielson AFB—Hazardous Materials <strong>and</strong> Hazardous WasteManagementThe ROI for <strong>hazardous</strong> <strong>materials</strong> <strong>and</strong> <strong>waste</strong> management includes EielsonAFB for general operations <strong>and</strong> those areas where potential NMDconstruction activities would occur within the base boundary.Hazardous Materials ManagementEielson AFB receives, stores, <strong>and</strong> utilizes large quantities of <strong>hazardous</strong><strong>materials</strong>, including a variety of flammable <strong>and</strong> combustible liquids suchas jet fuel. Hazardous <strong>materials</strong> used include antifreeze, lead-acidbatteries, nickel-cadmium batteries, plating solution, epoxy primer,cleaning solvents, <strong>and</strong> photo processing chemicals. Petroleum productsused <strong>and</strong> stored on the base include aviation gasoline, motor gasoline,diesel, JP-4, <strong>and</strong> JP-8 (Eielson AFB, 1997—Hazardous Material <strong>and</strong>Waste Management Plan). Hazardous <strong>materials</strong> are issued <strong>and</strong> managedthrough Eielson AFB Hazardous Material Pharmacy (see PollutionPrevention section).Eielson AFB has the capacity to store approximately 114 million liters (30million gallons) of fuel/petroleum. Typically, the majority of the storedfuel is JP-8. JP-8 is received through a pipeline from the Mapco Refineryin North Pole, Alaska. The other stored petroleum products are broughtto Eielson AFB by truck, rail, or aircraft. Approximately 126 aboveground<strong>and</strong> 50 underground storage tanks are located at Eielson AFB (Pacific AirForces, 1998—Draft General Plan Eielson AFB). All tanks have beeninspected for compliance with secondary containment <strong>and</strong> overfillprotection requirements. All required tanks have been or are designatedto be upgraded (U.S. Air Force, 1997—Oil <strong>and</strong> Hazardous SubstanceDischarge Prevention <strong>and</strong> Contingency Plan, Eielson AFB, Alaska).An Oil <strong>and</strong> Hazardous Substance Discharge Prevention <strong>and</strong> ContingencyPlan was completed for Eielson AFB in November 1997. The planincludes a response action plan, prevention plan, supplementalinformation, <strong>and</strong> a contingency plan for oil <strong>and</strong> <strong>hazardous</strong> substancedischarge prevention. The plan provides instruction for spill prevention<strong>and</strong> proper direction for containment, notification, safety, <strong>and</strong> cleanup ifa spill does occur. The base also complies with EPCRA reportingrequirements by submitting annual emergency response <strong>and</strong> extremely<strong>hazardous</strong> substances updates to the local emergency managementofficials.NMD Deployment Final EIS 3-199
Chapter 3—Affected EnvironmentHazardous Waste ManagementEielson AFB maintains a current <strong>hazardous</strong> material <strong>and</strong> <strong>hazardous</strong> <strong>waste</strong>management plan. The plan details the procedures necessary formaintaining compliance with Air Force, Federal, <strong>and</strong> state regulationswhen h<strong>and</strong>ling <strong>hazardous</strong> <strong>waste</strong>. Hazardous <strong>waste</strong>s are initially collectedat approximately 45 satellite accumulation points, <strong>and</strong> then transferred toone 90-day accumulation point (Siftare, 1999—Comments received byEDAW, Inc., regarding the NMD Deployment Coordinating Draft EIS). All<strong>waste</strong>s from the accumulation points are sent to the Hazardous WasteFacility for recycling or disposal off-base. The staff at that facilityensures all <strong>hazardous</strong> <strong>waste</strong> is processed off-base within 90 days.Common <strong>hazardous</strong> <strong>waste</strong>s generated at Eielson AFB are absorbent withoils, absorbent with fuels, absorbent with antifreeze, used antifreeze,battery rinsate, carbon remover, fuel filters, paint remover, oil/waterseparator sludge, paint booth air filters, phenol, photo chemicals, paint,potassium hydroxide, sodium hydroxide, <strong>and</strong> sulfuric acid. Eielson AFB isa large quantity generator under the Resource Conservation <strong>and</strong> RecoveryAct (RCRA). In 1997, Eielson AFB generated 61,990 kilograms(136,665 pounds) of <strong>hazardous</strong> <strong>waste</strong> (Eielson AFB, 1997—HazardousWaste Disposal Report).Pollution PreventionEielson AFB has implemented several <strong>waste</strong> reduction practices to limitthe amount of <strong>hazardous</strong> <strong>waste</strong> produced on-base. These practicesinclude product substitution, recycling, <strong>waste</strong> oil burning, <strong>and</strong> aHazardous Material Pharmacy. The pharmacy is a pollution preventioninitiative used throughout the Air Force, designed to reduce the amountof <strong>hazardous</strong> <strong>materials</strong> stored at various facilities. Eielson AFB also hasan active recycling program for non-<strong>hazardous</strong> <strong>waste</strong> that includes paper,cardboard, plastics, glass, <strong>and</strong> aluminum. (Pacific Air Forces, 1998—Draft General Plan Eielson AFB)Installation Restoration ProgramIn November 1989, Eielson AFB was listed on the National Priorities Listof Federal Superfund sites by the U.S. EPA. The IRP implementation forEielson AFB began in 1982. The initial records search identified 43potential disposal or spill areas at Eielson AFB <strong>and</strong> recommended thatconfirmation studies be conducted on the basis of high migrationpotential (see figure <strong>3.7</strong>-3).On May 21, 1991, the U.S Air Force, the U.S. EPA, <strong>and</strong> the AlaskaDepartment of Environmental Conservation signed the Federal FacilityAgreement for Eielson AFB. The Federal Facility Agreement listed 64potential source areas. The agreement established a procedure <strong>and</strong>3-200 NMD Deployment Final EIS
Index MapEielsonAFBTransmitter Rd.AlaskaManchu TrailSS31ST16Quarry Rd.2Tanana RiverEXPLANATIONRoadsWater AreaIRP SitesRailroadsNORTHhw_eafb_001Installation BoundaryBuildingScale0 .6 1.2 Miles0 1.3 2.6 KilometersNMD Deployment Final EISInstallationRestoration Program(IRP) Sites, EielsonAir Force BaseAlaskaFigure <strong>3.7</strong>-33-201
Chapter 3—Affected Environmentschedule for developing, implementing, <strong>and</strong> monitoring appropriateresponse actions at the base in accordance with the ComprehensiveEnvironmental Response, Compensation, <strong>and</strong> Liability Act (CERCLA), theNational Contingency Plan, Superfund guidance <strong>and</strong> policy, RCRAguidance <strong>and</strong> policy, <strong>and</strong> applicable Alaska State law. Under terms ofthe Federal Facility Agreement, the environmental impacts associatedwith the past <strong>and</strong> present on-base activities would be investigated, <strong>and</strong>remedial action taken to protect public health <strong>and</strong> welfare, <strong>and</strong> theenvironment. Only two sites are located near potential NMD requiredfacilities at Eielson AFB: SS31, a former PCB storage facility, <strong>and</strong> ST16,location of a fuel line spill. Both of these sites are currently in a nofurther action status. (U.S. Department of the Air Force, 1998—Draft1997 Sitewide Monitoring Program Report)AsbestosAn Asbestos Management <strong>and</strong> Operations Plan has been completed, inaccordance with Air Force policy. The plan is reviewed annually <strong>and</strong>revised as necessary. The plan was developed in accordance with AirForce regulations to reduce exposure to occupants <strong>and</strong> workers on-base<strong>and</strong> to ensure compliance with all Federal, state, <strong>and</strong> local lawsconcerning asbestos management (Eielson AFB, 1997—AsbestosManagement <strong>and</strong> Operations Plan).An asbestos survey was conducted on facilities at Eielson AFB, with mostbuildings being found to contain asbestos. Asbestos-containing material isgenerated during remediation or demolition activities. Facilities that are tobe renovated or demolished are surveyed for asbestos-containing materialprior to construction activities, <strong>and</strong> remediated when necessary.Polychlorinated BiphenylsAll electrical equipment at Eielson AFB containing PCBs has beenreplaced, <strong>and</strong> PCB-containing transformers have been fully cleansed ofthe PCB-containing fluid. (Department of the Air Force, 1997—Memor<strong>and</strong>um for PCB-Free Status)Lead-based PaintA draft Eielson AFB Lead-based Paint in Facilities Management Plan hasbeen completed, in accordance with Air Force policy. The plan isreviewed annually <strong>and</strong> revised as necessary. The plan objective will helpeliminate or reduce risks for lead-based paint exposure on Eielson AFB.Several lead-based paint surveys have been performed at Eielson AFB.Although there has not been an extensive base-wide survey performed, itis expected that all pre-1980 buildings contain lead-based paint. EielsonAFB samples paint before any building remodeling or demolition <strong>and</strong>3-202 NMD Deployment Final EIS
Chapter 3—Affected Environmentremoves any identified lead-based paint in accordance with applicableregulations.RadonA year-long Radon Assessment <strong>and</strong> Mitigation Program AssessmentSurvey has been conducted for Eielson AFB. The survey was performedfrom October 1990 through December 1991 in all base housing units,transient living facilities, clinic, <strong>and</strong> child care center. None of the 1,247radon samples exceeded the 4 picocuries per liter limit, with 2.4picocuries per liter being the highest level measured (Eielson AFB, 1992—Memor<strong>and</strong>um, Results of Radon Assessment <strong>and</strong> Mitigation Program)Radon is not a concern at Eielson AFB.PesticidesThere are no non-point source pollution problems associated withpesticides <strong>and</strong> fertilizers on Eielson managed l<strong>and</strong>s. The management ofpesticides at Eielson AFB is the responsibility of the Pest ManagementSection of the Civil Engineer Squadron. All pesticides are approved bythe Federal Working Group before application. All fertilizers are appliedunder the direction of personnel of the Maintenance Engineering Sectionof the Civil Engineer Squadron. Pesticides <strong>and</strong> fertilizer are not appliedinto any watercourses, <strong>and</strong> aerial spraying in not used as a method ofapplication. (Pacific Air Forces, 1998—Draft General Plan Eielson AFB)<strong>3.7</strong>.1.4 Fort Greely—Hazardous Materials <strong>and</strong> Hazardous WasteManagementThe ROI for <strong>hazardous</strong> <strong>materials</strong> <strong>and</strong> <strong>hazardous</strong> <strong>waste</strong> managementincludes the Fort Greely infrastructure <strong>and</strong> existing facilities within themain base cantonment. Additional facilities could be constructed withinthe base cantonment area.Hazardous Materials ManagementFort Greely has several facilities that use or store <strong>hazardous</strong> <strong>materials</strong>. AHazardous Waste <strong>and</strong> Hazardous Materials St<strong>and</strong>ard Operating ProcedureManual was created for Fort Greely in September of 1995, whichcomplies with all applicable state <strong>and</strong> Federal regulations. The Planestablished st<strong>and</strong>ard operating procedures for the correct management,storage, <strong>and</strong> generation of <strong>hazardous</strong> <strong>materials</strong> <strong>and</strong> <strong>hazardous</strong> <strong>waste</strong>.Hazardous material inventories are reviewed <strong>and</strong> updated twice a year ifnecessary (Department of the Army, 1995—St<strong>and</strong>ard OperatingProcedure Hazardous Material <strong>and</strong> Hazardous Waste Management).Hazardous <strong>materials</strong> stored within the cantonment area include fuels <strong>and</strong>pesticides. Hazardous <strong>materials</strong> are also used in a variety of processesperformed at the installation, including vehicle, boat, <strong>and</strong> aviation repair;NMD Deployment Final EIS 3-203
Chapter 3—Affected Environmentpower <strong>and</strong> heat generation; <strong>waste</strong>water treatment; photo processing; <strong>and</strong>building maintenance (U.S. Department of the Army, 1997—PreliminaryDraft EA for the Disposal <strong>and</strong> Reuse of Surplus Property at Fort Greely,Alaska).Fort Greely has 53 aboveground storage tanks with capacities rangingfrom 946 to 2,384,809 liters (250 to 630,000 gallons), 4 of which are inthe cantonment area. The tanks <strong>and</strong> their supports are periodicallyinspected using visual inspection, hydrostatic inspection, or a system ofnondestructive shell thickness testing. There are 23 underground storagetanks at Fort Greely, 9 in the cantonment area, with capacities rangingfrom 1,136 to 189,270 liters (300 to 50,000 gallons). (U.S. ArmyAlaska, 1998—Oil Discharge Prevention <strong>and</strong> Contingency Plan)Underground storage tanks located within the cantonment area that meetstate regulations will be removed unless identified to support specificreuse activities. Underground storage tanks that do not meet currentregulations will be deactivated <strong>and</strong> removed before disposal by deed.The aboveground storage tanks within the cantonment area will beemptied, purged of fumes, <strong>and</strong> secured at the area’s closure.Fort Greely administers an Oil Discharge Prevention <strong>and</strong> ContingencyPlan, which leads personnel through the step-by-step proceduresnecessary to safely detect, contain, <strong>and</strong> clean up all oil spill dischargeson post. Also, an SWPPP for Fort Greely was completed in May 1996.The plan includes site-specific good housekeeping practices, facilitysurveys, satellite accumulation area inspections, employee training,record keeping <strong>and</strong> internal reporting, comprehensive site complianceevaluation, <strong>and</strong> sediment <strong>and</strong> erosion control. The base also complieswith EPCRA reporting requirements by submitting annual emergencyresponse <strong>and</strong> extremely <strong>hazardous</strong> substances updates to the localemergency management officials.Hazardous Waste ManagementFort Greely is registered by the U.S. EPA as a large quantity generator.Hazardous <strong>waste</strong>s generated at the installation are associated withequipment maintenance. Other <strong>waste</strong>s generated by the facility includesilver nitrates, boiler treatment compound, medical <strong>waste</strong>, paint,pesticides, aerosol canisters, batteries, used acetone <strong>and</strong> paint thinner,<strong>and</strong> sewage sludge. The <strong>waste</strong>s are accumulated in 208-liter (55-gallon)drums at satellite accumulation points before disposal. Currently, atemporary unnumbered building near T100 serves as the centralized<strong>hazardous</strong> <strong>waste</strong> collection site (Spiers, 1999—Electroniccommunication). Hazardous <strong>waste</strong>s management is performed inaccordance with the installation’s Hazardous Waste <strong>and</strong> HazardousMaterials St<strong>and</strong>ard Operating Procedures Manual (U.S. Department of theArmy, 1997—Preliminary Draft EA for the Disposal <strong>and</strong> Reuse of SurplusProperty at Fort Greely). In 1998, Fort Greely generated 59,7873-204 NMD Deployment Final EIS
Chapter 3—Affected Environmentkilograms (131,808 pounds) of <strong>hazardous</strong> <strong>waste</strong> (U.S. Army, 1998—The1998 Hazardous Waste Report, Fort Greely).Pollution PreventionFort Greely has developed <strong>and</strong> implemented a Pollution Prevention Plan.This plan aids in the elimination or reduction of <strong>hazardous</strong> substances,pollutants, <strong>and</strong> contaminants. Recycling activities at Fort Greely includefuels, batteries, <strong>and</strong> brass shell casings.Installation Restoration ProgramNo sites on Fort Greely have been listed on the CERCLA NationalPriorities List. In addition, there are no Comprehensive EnvironmentalResponse, Compensation, <strong>and</strong> Liability Information System (CERCLIS)sites <strong>and</strong> no leaking underground storage tank sites on the installation.(U.S. Army Corps of Engineers, 1997—Environmental Baseline SurveyReport, Fort Greely Alaska)Three buildings within the cantonment area are on the State PrioritiesList. These include Building 612, where <strong>waste</strong> drains to the sanitarysewer; Building 601, where transformers, solvents, <strong>and</strong> herbicides havebeen stored in the Resource <strong>and</strong> Utilities yard north of the building; <strong>and</strong>Building 605, which includes a maintenance shop, paint bay, <strong>and</strong> batterystorage facility. (U.S. Army Corps of Engineers, 1997—EnvironmentalBaseline Survey Report, Fort Greely Alaska) All three of these buildingsare potential support facilities for NMD.There are 24 solid <strong>waste</strong> management units within the installation area.There are two non-solid <strong>waste</strong> management units, the site south ofBuilding 626, where <strong>waste</strong> solvents have been dumped, <strong>and</strong> the nuclear<strong>waste</strong> pipeline <strong>and</strong> dilution well. There are 12 potentially contaminatedareas within the cantonment area. In addition, there are seven sourcesof potential contamination on properties adjoining the cantonment area.(U.S. Army Corps of Engineers, 1997—Environmental Baseline SurveyReport, Fort Greely Alaska)Environmental cleanup at Fort Greely has been addressed under both theIRP <strong>and</strong> the BRAC Environmental Cleanup Program. Numerous sites havebeen investigated <strong>and</strong> remediated under these programs. Investigationsare now complete at all known sites. Cleanup of the nuclear <strong>waste</strong> linefrom the past activities of the SM-1A nuclear reactor is nearingcompletion, <strong>and</strong> other cleanup actions at Building 110 <strong>and</strong> the oldfirefighter training pits are underway. Building 101, on retained property,<strong>and</strong> several other sites, on surplus property, are scheduled for cleanup,pending funding. (Spiers, 1999—Electronic Communication, Nov 22)NMD Deployment Final EIS 3-205
Chapter 3—Affected EnvironmentAsbestosA limited asbestos survey of family housing unit basements wasconducted at Fort Greely in 1998. Most of the buildings surveyed werefound to contain asbestos in pipe fittings <strong>and</strong> pipe insulation (U.S. Army,1998—Fort Greely Family Housing Asbestos Survey). The main post FireStation, Building 504, was also tested in 1988 <strong>and</strong> found to containasbestos in the pipe insulation. Buildings within the installation havebeen evaluated for the potential presence of asbestos-containing<strong>materials</strong> based on the results of this surveys <strong>and</strong> date of construction.Buildings constructed before 1985, which have not been surveyed, havebeen identified as at risk for the presence of asbestos-containing material.Most of the family housing <strong>and</strong> Fire Station 504 are proposed NMDsupport facilities.Polychlorinated BiphenylsA PCB survey was conducted at Fort Greely in 1993, during which alltransformers were sampled. The 1993 survey identified 16 transformersthat contained PCB concentrations between 50 <strong>and</strong> 499 ppm. All PCBcontainingtransformers were removed from the installation in 1994 (U.S.Army Corps of Engineers, 1997—Environmental Baseline Survey Report,Fort Greely Alaska).Lead-based PaintA lead-based paint survey was performed for the family housing, medicalcenter, <strong>and</strong> transient quarters at Fort Greely in 1997. All buildingssurveyed were found to contain lead-based paint. (U.S. Army Corps ofEngineers, 1997—Lead-Based Paint Survey, Fort Greely) Buildings notsurveyed but constructed before 1978 are believed to be at risk for thepresence of lead-based paint.RadonRadon surveys were conducted in various buildings within thecantonment area from 1990 through 1993. Buildings within thecantonment area have been evaluated for the presence of radon based onthe results of those surveys. Some buildings were found to have radonconcentrations equal to or greater than the current U.S. EPA guidelines of4 picocuries per liter. Family housing units with radon levels greater thanor equal to 4 picocuries per liter have been mitigated. All buildings notsurveyed were designated as potentially containing radon, <strong>and</strong> buildingsfound to contain radon concentrations below 4 picocuries per liter werenot given a radon designation. (U.S. Department of the Army, 1997—Preliminary Draft EA for Disposal <strong>and</strong> Reuse of Surplus Property at FortGreely)3-206 NMD Deployment Final EIS
Chapter 3—Affected EnvironmentPesticidesFort Greely has completed <strong>and</strong> implemented an Integrated PestManagement Plan. The goal of this plan is to minimize the adverseenvironmental impact of pesticide use while achieving an acceptable levelof control <strong>and</strong> cost-effectiveness. The use of pesticides has fallensignificantly in recent years; however, the Army's goal is to reducepesticide use by 50 percent by the year 2000. All chemicals used onFort Greely are U.S. EPA approved <strong>and</strong> are applied by personnel who areDOD management certified. (U.S. Army Alaska, 1997—Draft IntegratedNatural Resources Management Plan)Vegetation control is required at Fort Greely on the airfield, roadshoulders of main roads, outside storage areas, <strong>and</strong> other places whereweeds grow in concrete <strong>and</strong> asphalt cracks.Mosquitoes, biting gnats, <strong>and</strong> flies are important pests during warmmonths. The Alaska Preventative Medicine Branch, <strong>and</strong> the PestController are responsible for mosquito surveillance <strong>and</strong> determination ofthe need for control. Control includes elimination of mosquito breedingareas <strong>and</strong> use of pesticides when needed. Ultra Low Volume insecticidetreatment with Pyrenone is the recommended treatment. Flies arenormally treated using sanitation practices. (U.S. Army Alaska, 1997—Draft Integrated Natural Resources Management Plan)<strong>3.7</strong>.1.5 Yukon Training Area (Fort Wainwright)—Hazardous Materials<strong>and</strong> Hazardous Waste ManagementThe ROI for <strong>hazardous</strong> <strong>materials</strong> <strong>and</strong> <strong>hazardous</strong> <strong>waste</strong> management is theYukon Training Area Winter Camp area. This site has no present existingstructures for support of the NMD activities. Therefore, there are noissues with asbestos, PCBs, or lead-based paint associated with theproposed site. The Yukon Training Area may require the use of FortWainwright <strong>and</strong> Eielson AFB infrastructure <strong>and</strong> existing facilities.Support facilities could be constructed on both the Yukon Training Area<strong>and</strong> Eielson AFB.Hazardous Materials ManagementThe Yukon Training Area uses little or no <strong>hazardous</strong> <strong>materials</strong> in itspresent status. The <strong>hazardous</strong> <strong>materials</strong> utilized consist of motor fuel,oil, lubricants, <strong>and</strong> similar <strong>materials</strong> associated with trucks <strong>and</strong> equipmentused for training. Any <strong>hazardous</strong> <strong>materials</strong> that are used are suppliedthrough the Fort Wainwright <strong>hazardous</strong> <strong>materials</strong> management program.Hazardous Waste ManagementOnly small amounts of <strong>hazardous</strong> <strong>waste</strong> are generated at the YukonTraining Area, due to the few activities <strong>and</strong> lack of any maintenance orNMD Deployment Final EIS 3-207
Chapter 3—Affected Environmentother facilities that typically generate <strong>hazardous</strong> <strong>waste</strong>. Any <strong>hazardous</strong><strong>waste</strong> that is generated would be h<strong>and</strong>led <strong>and</strong> disposed of according tothe Fort Wainwright Hazardous Waste Management Plan. In 1997, FortWainwright generated a total of 177,396 kilograms (391,093 pounds) of<strong>hazardous</strong> <strong>waste</strong> (Johnson, D., 1998—Electronic communication,December 14).Installation Restoration ProgramNo investigations have been performed for the Yukon Training Area;however, because of the limited amount of military activities at theproposed NMD sites, no contamination is expected (Alaska July TripReport). There is a low potential for unexploded ordnance in the area,due to the long history of military training. Most of the ordnanceconsists of small arms ammunition <strong>and</strong> 40-millimeter practice grenades.RadonAccording to the Generalized Geologic Radon Potential of the UnitedStates Map by the USGS, the majority of Interior Alaska is classified asan area of moderate <strong>and</strong>/or variable radon concentration levels. Extremenorthern areas <strong>and</strong> southern areas of the state are classified as lowgeological radon potential areas. Radon concentrations in the vicinity ofthe Yukon Training Area could range from 2 to 4 picocuries per liter.(U.S. Geological Survey, 1995—Radon Potential of the United States)The site within the Yukon Training Area being considered for NMDactivities is relatively close to Eielson AFB. Therefore, the radon levels atthe proposed NMD site are expected to be similar to those experiencedon Eielson AFB. As mentioned in section <strong>3.7</strong>.1.3, radon levels at EielsonAFB are well below the U.S. EPA guideline of 4 picocuries per liter.Radon is not expected to be a concern in the Yukon Training Area.PesticidesNo pesticides are used in the proposed NMD areas.<strong>3.7</strong>.2 NORTH DAKOTA INSTALLATIONS<strong>3.7</strong>.2.1 Cavalier AFS—Hazardous Materials <strong>and</strong> Hazardous WasteManagementThe relevant aspects of <strong>hazardous</strong> <strong>materials</strong>/<strong>waste</strong> management includethe applicable regulatory procedures for <strong>hazardous</strong> <strong>materials</strong> usage <strong>and</strong><strong>hazardous</strong> <strong>waste</strong> generation, <strong>and</strong> management programs for existing<strong>hazardous</strong> <strong>waste</strong>-contaminated sites within areas potentially affected bythe NMD program. The ROI for <strong>hazardous</strong> <strong>materials</strong> <strong>and</strong> <strong>hazardous</strong> <strong>waste</strong>management includes Cavalier AFS for general operations <strong>and</strong> those3-208 NMD Deployment Final EIS
Chapter 3—Affected Environmentareas where potential NMD construction activities would occur within thebase boundary.Hazardous Materials ManagementCavalier AFS receives, stores, <strong>and</strong> utilizes small quantities of <strong>hazardous</strong><strong>materials</strong>. The most commonly utilized <strong>hazardous</strong> <strong>materials</strong> include dieselfuel, gasoline, lubricating oil, thinners, kerosene, solvents, <strong>and</strong> sulfuricacid. Cavalier AFS is currently in the process of starting its own<strong>hazardous</strong> material HAZMART management system. In the meantime,<strong>hazardous</strong> <strong>materials</strong> are issued <strong>and</strong> managed through Gr<strong>and</strong> Forks AFBHazardous Materials HAZMART (see section <strong>3.7</strong>.2.2). Hazardous<strong>materials</strong> used <strong>and</strong> storage on Cavalier AFS are concentrated in thePerimeter Acquisition Radar building, the Power Plant, <strong>and</strong> the IndustrialBuildings area. Expended <strong>hazardous</strong> <strong>materials</strong> are transported to the<strong>Defense</strong> Reutilization <strong>and</strong> Marketing Office at Minot AFB for disposal orre-use. All areas that contain <strong>hazardous</strong> <strong>materials</strong> have appropriateMaterial Safety Data Sheets.Petroleum, oils, <strong>and</strong> lubricants at Cavalier AFS are stored in bothaboveground storage tanks <strong>and</strong> underground storage tanks. A total offour underground storage tanks are located at Cavalier AFS. Two of theunderground storage tanks have permanent leak detection. All fourunderground storage tanks are equipped with a spill <strong>and</strong> overfillprotection system <strong>and</strong> a cathodic protection system. (Department of theAir Force, 1995—Underground Storage Tank Status Report)A total of 19 aboveground storage tanks are located at Cavalier AFS.The aboveground storage tanks are inspected regularly by maintenancepersonnel for possible breach in containment (Cavalier AS, 1996—Environmental Protection Plan Part 6).The base Spill Prevention <strong>and</strong> Response Plan provides guidance for thestorage <strong>and</strong> h<strong>and</strong>ling of <strong>hazardous</strong> substances at Cavalier AFS. The planalso provides contingency plans identifying key personnel,responsibilities, <strong>and</strong> facility-specific procedures to follow in the event of a<strong>hazardous</strong> substance spill. The base also complies with EPCRA reportingrequirements by submitting annual emergency response <strong>and</strong> extremely<strong>hazardous</strong> substances updates to local emergency management officials.Hazardous Waste ManagementA Hazardous Waste Management Plan for Cavalier AFS was completed inJuly 1998. The Hazardous Waste Management Plan requires that all<strong>hazardous</strong> <strong>waste</strong> must be stored, h<strong>and</strong>led, <strong>and</strong> disposed of in accordancewith applicable regulations. The plan requires an establishment of<strong>hazardous</strong> <strong>waste</strong> accumulation points, maintenance of written manifestsof <strong>hazardous</strong> <strong>waste</strong>, <strong>and</strong> proper disposal of <strong>hazardous</strong> <strong>waste</strong> throughNMD Deployment Final EIS 3-209
Chapter 3—Affected Environmentproper military <strong>and</strong> contractor personnel. Hazardous <strong>waste</strong> streamsgenerated by facility operations at Cavalier AFS include Safety Kleensolvents, paint <strong>waste</strong>, mineral spirits, chlorine, sulfuric acid, mercury, <strong>and</strong>batteries. In 1997 Cavalier AFS generated 1,522 kilograms (3,357pounds) of <strong>hazardous</strong> <strong>waste</strong> (Department of the Air Force, 1998—1997Biennial Hazardous Waste Report).Cavalier AFS is registered with the U.S. EPA as a conditionally exemptsmall quantity generator (Kotchman, 1999—Comments received byEDAW, Inc. regarding the NMD Deployment Coordinating Draft EIS, Jan27). Hazardous <strong>waste</strong> is stored at a 180-day central accumulation point<strong>and</strong> four satellite accumulation points in several types of storagecontainers ranging from 3.8-liter (1-gallon) cans to 208-liter (55-gallon)drums. Cavalier AFS is not a transport, storage, or disposal facility, <strong>and</strong>no <strong>hazardous</strong> <strong>waste</strong> treatment of disposal is performed at Cavalier AFS.The <strong>Defense</strong> Reutilization <strong>and</strong> Marketing Office or their contractor willtransport <strong>hazardous</strong> <strong>waste</strong>s from Cavalier AFS to a permitted <strong>hazardous</strong><strong>waste</strong> facility at the <strong>Defense</strong> Reutilization <strong>and</strong> Marketing Office at MinotAFB (Cavalier AS, 1996—Environmental Protection Plan Part 5).Pollution PreventionA Pollution Prevention Plan was included as part of the Hazardous WasteManagement Plan <strong>and</strong> was completed December 31, 1996 for CavalierAFS. The plan includes reduction or elimination of <strong>hazardous</strong> substances,pollutants, or contaminants. Pollution that cannot be recycled will betreated in an environmentally safe manner (Cavalier AS, 1996—Environmental Protection Plan Part 5).The refuse contractor for Cavalier AFS maintains recycling bins in thePerimeter Acquisition Radar building parking lot for glass, paper, cardboard,metal, <strong>and</strong> plastics. Under a local initiative, Cavalier AFS also segregates<strong>and</strong> recycles computer, bond, <strong>and</strong> newspapers. (U.S. Air Force SpaceComm<strong>and</strong>—Comprehensive Planning Framework, Cavalier AS)Installation Restoration ProgramFive IRP sites have been identified at Cavalier AFS (figure <strong>3.7</strong>-4). Four ofthese sites have been officially closed by the North Dakota Department ofHealth. Site FT-01, an old burn pit, may have contained diesel fuel,<strong>waste</strong> oils (potentially containing PCBs), <strong>and</strong> solvents. Current plans forthe site are long-term monitoring. Cavalier AFS performs semi-annualgroundwater sampling at site FT-01 as required by the North DakotaDepartment of Health. (U.S. Air Force Space Comm<strong>and</strong>, undated—Comprehensive Planning Framework, Cavalier AS)3-210 NMD Deployment Final EIS
CR 89Patrol RoadRoadFT-02AccessFifth AvenueFourth AvenueAdmin.Sixth StreetSS-03SS-05Service RoadSS-04FT-01Index MapCavalier AFSNorth DakotaEXPLANATIONInstallation BoundaryClosed SiteIRP SitesCR = County RoadND = North Dakota RoadInstallation RestorationProgram (IRP) Sites,Cavalier Air ForceStationNORTHhw_cas_001Scale 1:11,0000 459 917 Feet0 140 280 MetersNMD Deployment Final EISNorth DakotaFigure <strong>3.7</strong>-43-211
Chapter 3—Affected EnvironmentAsbestosAn Asbestos Management Operating Plan for Cavalier AFS wasimplemented in July 1998. Gr<strong>and</strong> Forks AFB provides an AsbestosManagement Team with trained <strong>and</strong> certified asbestos personnel toCavalier AFS. The asbestos plan requires that contractors providecertified personnel if needed. The Asbestos Management Operating Planincludes copies of work orders, notification records, bulk <strong>and</strong> air samplingresults, asbestos registry, training <strong>and</strong> certification records, <strong>and</strong> disposaldocuments.At Cavalier AFS, asbestos-containing material is generated duringremediation operations conducted for building renovations or demolition.Facilities that are to be renovated or demolished are surveyed forasbestos-containing material prior to construction activities, <strong>and</strong>remediated when necessary. The removal of asbestos-containingmaterial from facilities generates a <strong>waste</strong> that can be l<strong>and</strong>filled at severallocal permitted municipal <strong>waste</strong> disposal facilities.Facilities on Cavalier AFS were surveyed in June 1989 for asbestoscontainingmaterial. Most of the Perimeter Acquisition Radar building isbelieved to have asbestos matting between the sheet metal walls.Asbestos is also present in some utility ducts <strong>and</strong> in the insulation forpipes <strong>and</strong> heating ducts. Additionally, many of the floor tiles <strong>and</strong> masticin facilities on Cavalier AFS contain asbestos, but are in good condition.(U.S. Air Force Space Comm<strong>and</strong>, undated—Comprehensive PlanningFramework, Cavalier AS)Polychlorinated BiphenylsCavalier AFS uses a variety of electronic <strong>and</strong> communications equipmentthat contain PCBs. Most of these items are located in the PerimeterAcquisition Radar facility. The station maintains a record of all PCBcontainingequipment <strong>and</strong> has tested suspect equipment for PCB levels.(U.S. Air Force Space Comm<strong>and</strong>, undated—Comprehensive PlanningFramework, Cavalier AS) An ongoing project to replace the PCB<strong>materials</strong> in electrical transformers <strong>and</strong> major equipment has beencompleted (Fors, 1999—Electronic communication).Lead-based PaintA lead-based paint survey began at Cavalier AFS in 1996 <strong>and</strong> wascompleted in 1998 (Kotchman, 1999—Comments received by EDAW,Inc. regarding the NMD Deployment Preliminary Draft EIS, April 30). The1996 testing was concentrated in public <strong>and</strong> community areas accessibleto children, for whom exposure to lead poses the greatest threat. Leadbasedpaint was noted in the Fitness Center, Bachelors Enlisted Quarters,<strong>and</strong> some playground equipment (U.S. Air Force Space Comm<strong>and</strong>,3-212 NMD Deployment Final EIS
Chapter 3—Affected Environmentundated—Comprehensive Planning Framework, Cavalier AS). The 1998survey work involved evaluating the non-public areas of Cavalier AFS.Because Cavalier AFS was built before 1980, there is the potential thatall buildings may contain lead-based paint. Cavalier AFS samples paintbefore any building remodeling <strong>and</strong> demolition <strong>and</strong> removes any identifiedlead-based paint in accordance with applicable regulations.RadonCavalier AFS does not currently have a Radon Assessment <strong>and</strong> MitigationProgram. Radon sampling performed in March 1996 indicated that levelswere below 4 picocuries <strong>and</strong> no further sampling was required. (U.S. AirForce Space Comm<strong>and</strong>, undated—Comprehensive Planning Framework,Cavalier AS)PesticidesPest management support for Cavalier AFS is provided by Gr<strong>and</strong> ForksAFB personnel under the 1994 Support Agreement. Herbicides areapplied by state certified contractor personnel to control broadleafweeds, grassy weeds, <strong>and</strong> several varieties of noxious weeds. (U.S. AirForce Space Comm<strong>and</strong>, undated—Comprehensive Planning Framework,Cavalier AS)<strong>3.7</strong>.2.2 Gr<strong>and</strong> Forks AFB—Hazardous Materials <strong>and</strong> HazardousWaste ManagementThe relevant aspects of <strong>hazardous</strong> <strong>materials</strong>/<strong>waste</strong> management includethe applicable regulatory procedures for <strong>hazardous</strong> <strong>materials</strong> usage <strong>and</strong><strong>hazardous</strong> <strong>waste</strong> generation, <strong>and</strong> management programs for existing<strong>hazardous</strong> <strong>waste</strong>-contaminated sites within areas potentially affected bythe NMD program. The ROI for <strong>hazardous</strong> <strong>materials</strong> <strong>and</strong> <strong>hazardous</strong> <strong>waste</strong>management includes Gr<strong>and</strong> Forks AFB for general operations <strong>and</strong> thoseareas where potential NMD construction activities could occur.Hazardous Materials ManagementGr<strong>and</strong> Forks AFB receives, stores, <strong>and</strong> utilizes large quantities of<strong>hazardous</strong> <strong>materials</strong>. The most commonly utilized <strong>hazardous</strong> <strong>materials</strong>include aviation <strong>and</strong> motor fuels, various grades of petroleum products,lubricants, hydraulic fluids, solvents, paints, thinners, <strong>and</strong> compressedgases. Most <strong>hazardous</strong> <strong>materials</strong> are delivered to the base <strong>hazardous</strong><strong>materials</strong> HAZMART (see Pollution Prevention section). Hazardous<strong>materials</strong> are distributed from this system, using base personnel astransporters. All base <strong>hazardous</strong> <strong>materials</strong> are tracked through thissystem.A total of 74 regulated <strong>and</strong> non-regulated underground storage tanks <strong>and</strong>55 aboveground storage tanks are present at Gr<strong>and</strong> Forks AFB (U.S.NMD Deployment Final EIS 3-213
Chapter 3—Affected EnvironmentDepartment of the Air Force, 1997—Gr<strong>and</strong> Forks AFB General Plan).Underground <strong>and</strong> aboveground storage tanks are checked on a routinebasis. Compliance activities are being conducted in accordance with theNorth Dakota Underground Storage Tank Program (U.S. Department ofthe Air Force, 1997—Integrated Natural Resources Management Plan,Gr<strong>and</strong> Forks AFB).All personnel who work with <strong>hazardous</strong> <strong>materials</strong> have initial <strong>and</strong> updatedtraining in Hazard Communication, which enables them to identify thehazards of the material. Material Safety Data Sheets are provided with<strong>materials</strong> or can be obtained from the Pharmacy or the BioenvironmentalEngineering Services office. Spill response is conducted by the Base FireProtection Flight, <strong>and</strong> inspection of facilities is conducted by the FireProtection Flight, Safety, <strong>and</strong> Bioenvironmental Engineering Services.Gr<strong>and</strong> Forks AFB maintains an Oil <strong>and</strong> Hazardous Substance SpillPrevention <strong>and</strong> Response Plan, which is in the process of being updated.The plan provides guidance <strong>and</strong> assigns responsibilities to prevent <strong>and</strong>respond to oil <strong>and</strong> <strong>hazardous</strong> substance discharges on-base <strong>and</strong> in themissile field (U.S. Department of the Air Force, 1999—Final EIS,Minuteman III <strong>Missile</strong> System Dismantlement). The base also complieswith EPCRA reporting requirements by submitting annual emergencyresponse <strong>and</strong> extremely <strong>hazardous</strong> substances updates to the localemergency management officials.Hazardous Waste ManagementHazardous <strong>waste</strong> streams generated by facility operations at Gr<strong>and</strong> ForksAFB include bead blast media, solvents, paint <strong>and</strong> paint-related material,shelf life expired <strong>materials</strong>, contaminated soil, <strong>and</strong> spill residue. Thelargest <strong>waste</strong> volumes generated in 1997 were off-spec paint (2,837kilograms [6,255 pounds]), Safety Kleen solvent (1,836 kilograms [4,047pounds]), paint related material (tape, paper, protective suits) (1,788kilograms [3,941 pounds]), <strong>and</strong> sodium chromate solution (1,548kilograms [3,412 pounds]). The total <strong>waste</strong> generated from the facility in1997 was 18,834.7 kilograms (41,523.4 pounds) (Department of the AirForce, 1998—1997 Hazardous Waste Report, Gr<strong>and</strong> Forks AFB). Themissile fields generate batteries, battery acid, paint <strong>and</strong> solvent <strong>waste</strong>s,<strong>and</strong> sodium chromate solution <strong>and</strong> rags (U.S. Department of the AirForce, 1999—Final EIS, Minuteman III <strong>Missile</strong> System Dismantlement).All <strong>waste</strong>s are h<strong>and</strong>led in accordance with applicable regulations.Gr<strong>and</strong> Forks AFB is a large quantity generator under RCRA. Gr<strong>and</strong> ForksAFB operates a North Dakota Department of Health permitted treatment,storage, <strong>and</strong> disposal facility. Hazardous <strong>waste</strong> is stored at the 23satellite accumulation points until 208 liters (55 gallons) of <strong>hazardous</strong><strong>waste</strong>, or 0.9 liter (1 quart) of acutely <strong>hazardous</strong> <strong>waste</strong> is generated.After this amount of <strong>waste</strong> is generated at the satellite accumulation3-214 NMD Deployment Final EIS
Chapter 3—Affected Environmentpoint, it is transferred to one of the 90-day accumulation points. At thislocation <strong>waste</strong> is prepared for shipment before transfer to the maintreatment, storage, <strong>and</strong> disposal facility. This facility has a capacity of9,993 liters (2,640 gallons) or forty-eight 208-liter (55-gallon drums);approximately 14,574 liters (3,850 gallons) is processed through thisfacility annually. From this facility, the <strong>waste</strong> is disposed of by a stateapproved contractor to an off-base U.S. EPA permitted facility. (U.S.Department of the Air Force, 1997—Gr<strong>and</strong> Forks AFB General Plan)Emergency response equipment is maintained in accessible areasthroughout Gr<strong>and</strong> Forks AFB. Spill response kits <strong>and</strong> fire extinguishersare available at all 90-day <strong>hazardous</strong> <strong>materials</strong> storage areas <strong>and</strong> at the<strong>Defense</strong> Reutilization <strong>and</strong> Marketing Office. The Gr<strong>and</strong> Forks AFB FireDepartment maintains fire response, discharge control, <strong>and</strong> containmentequipment. (U.S. Department of the Air Force, 1997—Integrated NaturalResources Management Plan)Pollution PreventionGr<strong>and</strong> Forks AFB has a Pollution Prevention Plan. The PollutionPrevention Plan includes the reduction or elimination of <strong>hazardous</strong>substances, pollutants, <strong>and</strong> contaminants. Pollution that cannot berecycled will be treated in an environmentally safe manner. Gr<strong>and</strong> ForksAFB also administers a pharmacy program that controls <strong>and</strong> reduces theuse of <strong>hazardous</strong> <strong>materials</strong> through a HAZMART system. The pharmacyis a pollution prevention initiative used throughout the Air Force, designedto reduce the amount of <strong>hazardous</strong> <strong>materials</strong> stored at various facilities.Hazardous <strong>materials</strong> are dispensed <strong>and</strong> tracked from the base HAZMART,which gathers the information necessary to optimize the use of<strong>hazardous</strong> <strong>materials</strong> <strong>and</strong> reduce <strong>waste</strong>, <strong>and</strong> provides the informationneeded for EPCRA reporting. Gr<strong>and</strong> Forks AFB also has an activerecycling program that includes paper, cardboard, aluminum, scrap metal,plastics, <strong>and</strong> glass. (U.S. Department of the Air Force, 1999—Final EIS,Minuteman III <strong>Missile</strong> System Dismantlement)Installation Restoration ProgramGr<strong>and</strong> Forks AFB administers an IRP under CERCLA guidance. There arecurrently seven IRP sites at Gr<strong>and</strong> Forks AFB. They are the Fire TrainingArea/Old Sanitary L<strong>and</strong>fill Area (FT-02); New Sanitary L<strong>and</strong>fill Area (LF-03); Building 306 (ST-04); Explosive Ordnance Detonation Area (OT-05);Refueling Ramps <strong>and</strong> Pads (ST-08); Base Tanks Area (ST-06); <strong>and</strong>Petroleum, Oil, <strong>and</strong> Lubricant Off-loading Area (ST-07) (figure <strong>3.7</strong>-5).Gr<strong>and</strong> Forks AFB is not on the National Priorities List. (Gr<strong>and</strong> Forks AFB,1995—Management Action Plan)NMD Deployment Final EIS 3-215
Index MapGr<strong>and</strong> Forks AFBRiverNorth DakotaTurtleCR 3LF-03FT-02Redwood AvenueST-06ST-087th Avenue6th AvenueOT-05306304200314SteenAvenueMainGateEielson Street701761737Alert AvenueST-07CR 3Secondary GateUS 2EXPLANATIONNORTHhw_gfafb_001Installation BoundaryIRP SitesGateCR = County RoadUS = U.S. Highway3-216Scale 1:40,0000 1,667 3,333 Feet0 508 1,016 MetersSolid Waste Management UnitNMD Deployment Final EISInstallation RestorationProgram (IRP) <strong>and</strong> SolidWaste Management UnitSites, Gr<strong>and</strong> Forks AirForce BaseNorth DakotaFigure <strong>3.7</strong>-5
Chapter 3—Affected EnvironmentIn 1993, the North Dakota Department of Health added 48 newsuspected areas of concern to the Base IRP. All areas, including theseven existing IRP sites, were grouped together <strong>and</strong> reclassified as 20solid <strong>waste</strong> management units. All solid <strong>waste</strong> management units aresubject to RCRA Corrective Action <strong>and</strong> are regulated by the base's RCRAPart B Permit. The existing IRP sites are also regulated by CERCLA<strong>and</strong>/or the North Dakota Underground Storage Tank Program. (U.S.Department of the Air Force, 1997—Gr<strong>and</strong> Forks AFB General Plan)The IRP sites near potential NMD deployment areas are the formerexplosive <strong>and</strong> ordnance detonation area OT-5 (which was closed underRCRA/CERCLA regulations <strong>and</strong> is at a low risk level) <strong>and</strong> the baseunderground storage tank ST-06, which was closed under The NorthDakota Underground Storage Tanks Program. Another site is Site ST-07,which is a benzene groundwater plume under the Petroleum, Oil, <strong>and</strong>Lubricant Off Loading Area. The plume, which is just west of theMunitions Storage Area, is apparently moving in a westerly direction.Remedial action is in progress under RCRA/CERCLA regulations. SolidWaste Management Unit sites near potential NMD deployment areasinclude those associated with oil/water separators (Buildings 304, 314,<strong>and</strong> 701) <strong>and</strong> underground <strong>waste</strong> storage tanks (Buildings 200, 306,737, <strong>and</strong> 761) that contained <strong>waste</strong> oil, hydraulic oil, solvents,contaminated fuel, <strong>and</strong> diesel fuel. Gr<strong>and</strong> Forks AFB is recommending nofurther action required at Buildings 200, 306, 314, <strong>and</strong> 737. (Gr<strong>and</strong>Forks AFB, 1995—Management Action Plan)Asbestos. The base maintains trained <strong>and</strong> certified asbestos abatementpersonnel, <strong>and</strong> requires that contractors provide certified personnel ifneeded. Up to 0.28 square meter (3 square feet) of asbestos-containingmaterial may be disturbed by non-certified contractors. (U.S. Departmentof the Air Force, 1999—Final EIS, Minuteman III <strong>Missile</strong> SystemDismantlement)At Gr<strong>and</strong> Forks AFB, asbestos-containing material is generated duringremediation operations for building renovations or demolition. Theremoval of asbestos-containing material from facilities generates a <strong>waste</strong>that is l<strong>and</strong>filled at the Gr<strong>and</strong> Forks Municipal L<strong>and</strong>fill. Facilities on Gr<strong>and</strong>Forks AFB were surveyed in 1993-94 for asbestos-containing material.Facilities that are to be renovated or demolished are surveyed forasbestos-containing material prior to construction activities, <strong>and</strong>remediated when necessary. The Environmental Engineers Flight, CivilEngineer Operations, <strong>and</strong> Bioenvironmental Engineering Services managemost aspects of asbestos remediation. The base maintains an AsbestosManagement <strong>and</strong> Operation Plan that includes asbestos work orders,notification records, bulk <strong>and</strong> air sampling results, asbestos registry,training <strong>and</strong> certification records, <strong>and</strong> disposal documents. (U.S.Department of the Air Force, 1999—Final EIS, Minuteman III <strong>Missile</strong>System Dismantlement).NMD Deployment Final EIS 3-217
Chapter 3—Affected EnvironmentPolychlorinated BiphenylsPersonnel from the Environmental Engineers Flight, <strong>Missile</strong> Maintenance,<strong>and</strong> the Exterior Electric offices manage PCBs. Documents <strong>and</strong> files aremaintained at Gr<strong>and</strong> Forks AFB, including PCB documentation for thepast 3 years. All known PCB-containing transformers, hydraulic systems,heat transfer components, <strong>and</strong> other PCB items have been removed fromGr<strong>and</strong> Forks AFB. (U.S. Department of the Air Force, 1999—Final EIS,Minuteman III <strong>Missile</strong> System Dismantlement)Lead-based PaintGr<strong>and</strong> Forks personnel manage lead-based paint identification <strong>and</strong>abatement in accordance with all Air Force guidance, <strong>and</strong> havedesignated the Environmental Engineers Flight, Base Housing Office, <strong>and</strong>Medical Group as being responsible for lead-based paint management.A visual inspection of pre-1980 buildings (those which are most likely tocontain lead-based paint) has been conducted at Gr<strong>and</strong> Forks AFB. Theinspection included all housing <strong>and</strong> community buildings, but not industrialfacilities of shops. Because most of Gr<strong>and</strong> Forks AFB was built before1980, there is the potential that most buildings may contain lead-basedpaint. Buildings that are to be demolished or remodeled are checked forlead-based paint. If lead-based paint is found, the paint is removed inaccordance with Federal Regulations. (U.S. Department of the Air Force,1999—Final EIS, Minuteman III <strong>Missile</strong> System Dismantlement)RadonA radon survey of base housing was completed in 1989 <strong>and</strong> was aimedat pinpointing potential sources of radon emissions. This study classifiedGr<strong>and</strong> Forks AFB housing as being a moderate risk facility requiringfurther sampling. Mitigation efforts occurred in 1991. Radon surveys<strong>and</strong> further mitigation efforts are continuing as part of an active program.Radon assessment surveys for evaluating radon emissions atadministrative areas on-base are programmed <strong>and</strong> will be conductedwhen funding becomes available. (U.S. Department of the Air Force,1997—Gr<strong>and</strong> Forks AFB General Plan)PesticidesThe management of pesticides at Gr<strong>and</strong> Forks AFB is accomplished bythe Pest Management staff, who maintain the grounds <strong>and</strong> buildings onthe base, <strong>and</strong> by the golf course staff, who maintain the golf course.The base pesticide facility is a state-of-the-art facility, <strong>and</strong> PestManagement personnel are certified as pesticide applicators. The basealso contracts for some pesticide applications. The Air Force has set agoal for the reduction of pesticides by the year 2000, which is beingaggressively pursued by the Pest Management Shop (U.S. Department of3-218 NMD Deployment Final EIS
Chapter 3—Affected Environmentthe Air Force, 1999—Final EIS, Minuteman III <strong>Missile</strong> SystemDismantlement).<strong>3.7</strong>.2.3 <strong>Missile</strong> Site Radar—Hazardous Materials <strong>and</strong> HazardousWaste ManagementThe relevant aspects of <strong>hazardous</strong> <strong>materials</strong>/<strong>waste</strong> management includethe applicable regulatory procedures for <strong>hazardous</strong> <strong>materials</strong> usage <strong>and</strong><strong>hazardous</strong> <strong>waste</strong> generation, <strong>and</strong> management programs for existing<strong>hazardous</strong> <strong>waste</strong>-contaminated sites within areas potentially affected bythe NMD program. The ROI for <strong>hazardous</strong> <strong>materials</strong> <strong>and</strong> <strong>hazardous</strong> <strong>waste</strong>management includes <strong>Missile</strong> Site Radar for general operations <strong>and</strong> thoseareas where potential NMD construction activities could occur.Hazardous Materials ManagementThe <strong>Missile</strong> Site Radar is an inactive site that receives routinemaintenance by a small caretaker staff. Hazardous <strong>materials</strong> used as partof the maintenance activities include paint solvents, thinners, <strong>and</strong> starterfluids. Only very small quantities of these <strong>materials</strong> are stored onsite.Between June <strong>and</strong> September 1991, the E.P.I.C. Company, undercontract to the U.S. Army Corps of Engineers, completed undergroundstorage tank closures at the <strong>Missile</strong> Site Radar. All but one petroleumunderground storage tank underwent closure according to North Dakotarequirements in place at the time of removal. One 264,980-liter (70,000-gallon) concrete underground storage tank located adjacent to the <strong>Missile</strong>Site Radar Power Plant was closed in place. (U.S. Army Corps ofEngineers, 1991—Underground Storage Tank Closure Report, SRMSC)Hazardous Waste ManagementThe <strong>Missile</strong> Site Radar is in caretaker status, <strong>and</strong> little or no <strong>hazardous</strong><strong>waste</strong> is being generated. Any <strong>hazardous</strong> <strong>waste</strong> generated as part ofmaintenance activities is disposed of offsite in accordance with applicableregulations.Pollution PreventionBecause the site is currently inactive, there are no pollution preventioninitiatives.Installation Restoration ProgramAccording to the U.S. Army Center for Health Promotion <strong>and</strong> PreventiveMedicine report (1995) for the SRMSC, the areas described in thefollowing paragraphs are, or will potentially be, IRP sites.NMD Deployment Final EIS 3-219
Chapter 3—Affected EnvironmentAt the <strong>Missile</strong> Site Radar facility, a preliminary investigation revealed thata pipe tunnel contains trace amounts of diesel fuel. The fuel has notleaked or migrated to the soil or groundwater outside the tunnel. Onlyvery low concentrations of total petroleum hydrocarbons (less than stateaction level) were detected sporadically in the borehole soil samples, <strong>and</strong>the analytical results of the groundwater samples did not indicatecontamination.Wastewater pond sediment samples from the center stabilization pondcontained concentrations of total petroleum hydrocarbons that are abovestate action levels. If the ponds are drained <strong>and</strong> backfilled, the remainingsediments in each of the ponds would need to be sampled <strong>and</strong> analyzedfor petroleum before backfilling.The former <strong>Missile</strong> Site Radar Control Building Fire Water Storage Pondhas contaminated soil <strong>and</strong> groundwater in the immediate vicinity. Theconcentrations of petroleum hydrocarbons exceed the state action levels.The groundwater samples contained two volatile organic compounds,triclorofluoromethane <strong>and</strong> trichloroethane, that are constituents ofsolvents <strong>and</strong> coolants.Seven of the eight electric vaults <strong>and</strong> signals at the <strong>Missile</strong> Site Radarmissile field contain substantial concentrations of total petroleumhydrocarbons, as well as an oily layer.In 1995, an inspection of water in nine of the Spartan missile silos wasconducted. Results of the investigation showed elevatedconcentrations of chromium <strong>and</strong> also detected beryllium, cadmium,iron, mercury, manganese, nickel, lead, antimony, <strong>and</strong> zinc (U.S. ArmySpace <strong>and</strong> <strong>Missile</strong> <strong>Defense</strong> Comm<strong>and</strong>, 1999—Exp<strong>and</strong>ed PreliminaryAssessment).AsbestosAn Asbestos Survey Report <strong>and</strong> Asbestos Management Plan for the<strong>Missile</strong> Site Radar was implemented on September 18, 1995. The<strong>Missile</strong> Site Radar facility is part of the complex <strong>and</strong> was included in thisplan. The Asbestos Management Operation Plan includes work orders,notification records, bulk <strong>and</strong> air sampling results, asbestos registry,training <strong>and</strong> certification records, <strong>and</strong> disposal documents.At the <strong>Missile</strong> Site Radar, asbestos-containing material is generatedduring remediation operations for building renovations or demolition. Theremoval of asbestos-containing material from facilities generates a <strong>waste</strong>that can be l<strong>and</strong>filled at several local permitted municipal <strong>waste</strong> disposalfacilities. Facilities on the <strong>Missile</strong> Site Radar were surveyed in September1991, October 1991, <strong>and</strong> September 1995 for asbestos-containingmaterial. A total of 58 buildings were inspected, with 428 samples3-220 NMD Deployment Final EIS
Chapter 3—Affected Environmentobtained. The majority of positive <strong>materials</strong> identified for asbestos werefloor tiles. Additional items that contained asbestos include linoleum,transite panels, ceiling panels, wall panels, roofing material, caulk,conduit putty, <strong>and</strong> gaskets. Facilities that are to be renovated ordemolished are surveyed for asbestos-containing material prior toconstruction activities, <strong>and</strong> remediated when necessary. (U.S. ArmySpace <strong>and</strong> Strategic Comm<strong>and</strong>, 1995—Asbestos Survey Report <strong>and</strong>Management Plan)Polychlorinated BiphenylsIn 1990 a PCB survey was conducted at the <strong>Missile</strong> Site Radar facility<strong>and</strong> associated Remote Site Launch Sites <strong>and</strong> resulted in theidentification of 74 transformers. Of the 74 transformers identified <strong>and</strong>tested, only 7 indicated the presence of PCBs. All known transformers<strong>and</strong> other items containing PCBs were removed from the <strong>Missile</strong> SiteRadar facility. In 1992, an inspection of the <strong>Missile</strong> Site Radar Facilityidentified PCB containing equipment that could have gone unnoticedduring the 1991 inspection. Therefore, in September 1993, suspect PCBcontaining <strong>materials</strong> was investigated. Results indicated that out of 37potential PCB containing items it was unlikely that any of the itemscontained regulated levels of PCBs. (U.S. Army Space <strong>and</strong> Strategic<strong>Defense</strong> Comm<strong>and</strong>, 1994—Engineering Report, SRMSC)Lead-based PaintThe <strong>Missile</strong> Site Radar facility was constructed before 1980. Therefore,there is the potential that most buildings <strong>and</strong> silos may contain leadbasedpaint. Buildings that are to be demolished or remodeled arechecked for lead-based paint. If lead-based paint is found, the paint isremoved in accordance with Federal regulations.RadonAccording to Radon Potential of the Upper Midwest map by the U.S.Geological Survey (1993), all of North Dakota is classified as an area ofhigh radon concentration level. A radon survey completed for the <strong>Missile</strong>Site Radar found Building 348, now demolished, <strong>and</strong> Building 360 tohave radon levels above 4 picocuries per liter. All other facilitiessurveyed were below 4 picocuries per liter (Greenwood, 1999—Comments received by EDAW, Inc., regarding the NMD DeploymentCoordinating Draft DEIS).PesticidesThe <strong>Missile</strong> Site Radar facility does not use any insecticides or pesticides.Herbicides have been used periodically to control weed growth inpavements <strong>and</strong> for spot control of noxious weeds such as leafy spurge.NMD Deployment Final EIS 3-221
Chapter 3—Affected EnvironmentHerbicides that have been used in the past include 2-4D Amine, Banvel,<strong>and</strong> Promoton. (Greenwood, 2000—Electronic communication)<strong>3.7</strong>.2.4 Remote Sprint Launch Site 1—Hazardous Materials <strong>and</strong>Hazardous Waste ManagementThe relevant aspects of <strong>hazardous</strong> <strong>materials</strong>/<strong>waste</strong> management includethe applicable regulatory procedures for <strong>hazardous</strong> <strong>materials</strong> usage <strong>and</strong><strong>hazardous</strong> <strong>waste</strong> generation, <strong>and</strong> management programs for existing<strong>hazardous</strong> <strong>waste</strong>-contaminated sites within areas potentially affected bythe NMD program. The ROI for <strong>hazardous</strong> <strong>materials</strong> <strong>and</strong> <strong>hazardous</strong> <strong>waste</strong>management includes Remote Sprint Launch Site 1 for general operations<strong>and</strong> those areas where potential NMD construction activities could occur.Hazardous Materials ManagementRemote Sprint Launch Site 1 is an inactive site that receives routinemaintenance by a small caretaker staff that operates from the <strong>Missile</strong> SiteRadar. Hazardous <strong>materials</strong> used as part of the maintenance activitiesinclude paint solvents, thinners, <strong>and</strong> starter fluids.All underground storage tanks have been removed from the RemoteSprint Launch Sites (U.S. Army Corps of Engineers, 1991—UndergroundStorage Tank Closure Report, SRMSC).Hazardous Waste ManagementRemote Sprint Launch Site 1 is in caretaker status, <strong>and</strong> little or no<strong>hazardous</strong> <strong>waste</strong> is being generated. Any <strong>hazardous</strong> <strong>waste</strong> generated aspart of maintenance activities is disposed of offsite in accordance withapplicable regulations.Pollution PreventionBecause the site is currently inactive, there are no pollution preventioninitiatives.Installation Restoration ProgramThere are no known <strong>hazardous</strong> <strong>waste</strong> contaminated sites at RemoteSprint Launch Site 1. Water removed from the Remote LaunchOperations Building in 1991 did not indicate the presence of anycontaminates. No further investigation is planned for these facilities.Water may exist in some of the Sprint Silos. Current plans are for arepresentative number of silos to be investigated. If water is present, itwould be sampled <strong>and</strong> analyzed. If any contamination is discovered,consultation with the appropriate agencies would occur to determine3-222 NMD Deployment Final EIS
Chapter 3—Affected Environmentfuture investigation <strong>and</strong> potential remediation (U.S. Army Space <strong>and</strong><strong>Missile</strong> <strong>Defense</strong> Comm<strong>and</strong>, 1999—Exp<strong>and</strong>ed Preliminary Assessment).AsbestosAn Asbestos Survey Report <strong>and</strong> Asbestos Management Plan for theSRMSC was implemented on September 18, 1995. The Remote SprintLaunch Site 1 facility is part of the complex <strong>and</strong> was included in thisplan. The Asbestos Management Operation Plan includes work orders,notification records, bulk <strong>and</strong> air sampling results, asbestos registry,training <strong>and</strong> certification records, <strong>and</strong> disposal documents.The removal of asbestos-containing material from facilities generates a<strong>waste</strong> that can be l<strong>and</strong>filled at several local permitted municipal <strong>waste</strong>disposal facilities. Facilities at the Remote Sprint Launch Site weresurveyed in September 1995 for asbestos-containing material. Themajority of positive <strong>materials</strong> identified for asbestos were black mastic<strong>and</strong> gaskets. Additional items that contained asbestos include ceilingpanels, conduit putty, <strong>and</strong> window caulking. Facilities that are to berenovated or demolished are surveyed for asbestos-containing materialprior to construction activities, <strong>and</strong> remediated when necessary. (U.S.Army Space <strong>and</strong> Strategic <strong>Defense</strong> Comm<strong>and</strong>, 1995—Asbestos SurveyReport <strong>and</strong> Management Plan)Polychlorinated BiphenylsIn 1991, a PCB survey was conducted at the <strong>Missile</strong> Site Radar <strong>and</strong>Remote Site Launch Sites <strong>and</strong> resulted in the identification of 74transformers. Of the 74 transformers identified <strong>and</strong> tested, only 7indicated the presence of PCBs. All known transformers <strong>and</strong> other itemscontaining PCBs were removed from the <strong>Missile</strong> Site Radar <strong>and</strong> RemoteSprint Launch Sites. In 1992, an inspection of the SRMSC identified PCBcontaining equipment that could have gone unnoticed during the 1991inspection. Therefore, in September of 1993 suspect PCB-containing<strong>materials</strong> were investigated. Results did not identify any potential PCBitems within the Remote Sprint Launch Sites (U.S. Army Space <strong>and</strong>Strategic <strong>Defense</strong> Comm<strong>and</strong>, 1994—Engineering Report, SRMSC).Lead-based PaintRemote Sprint Launch Site 1 was constructed before 1980. Therefore,there is the potential that most buildings <strong>and</strong> missile silos may containlead-based paint. Buildings that are to be demolished or remodeled arechecked for lead-based paint. If lead-based paint is found, the paint isremoved in accordance with Federal Regulations.NMD Deployment Final EIS 3-223
Chapter 3—Affected EnvironmentRadonAccording to Radon Potential of the Upper Midwest map by the USGS(1993), all of North Dakota is classified as an area of high radonconcentration level. Remote Sprint Launch Site 1 could possibly belocated in areas that have concentrations over the U.S. EPA threshold of4 picocuries. The U.S. EPA recommends that any buildings built in areashigher than 4 picocuries should be tested, <strong>and</strong> the appropriateprecautions taken if deemed necessary. Construction of new facilitiesmay require the addition of radon mitigation measures.PesticidesNo insecticides or rodenticides are used at Remote Sprint Launch Site 1.(Greenwood, 2000—Electronic communication)<strong>3.7</strong>.2.5 Remote Sprint Launch Site 2—Hazardous Materials <strong>and</strong>Hazardous Waste ManagementThe relevant aspects of <strong>hazardous</strong> <strong>materials</strong>/<strong>waste</strong> management includethe applicable regulatory procedures for <strong>hazardous</strong> <strong>materials</strong> usage <strong>and</strong><strong>hazardous</strong> <strong>waste</strong> generation, <strong>and</strong> management programs for existing<strong>hazardous</strong> <strong>waste</strong>-contaminated sites within areas potentially affected bythe NMD program. The ROI for <strong>hazardous</strong> <strong>materials</strong> <strong>and</strong> <strong>hazardous</strong> <strong>waste</strong>management includes Remote Sprint Launch Site 2 for general operations<strong>and</strong> those areas where potential NMD construction activities could occur.The Remote Sprint Launch Sites (1, 2, <strong>and</strong> 4) were built of similar design<strong>and</strong> construction material. The relevant aspects of <strong>hazardous</strong> <strong>materials</strong><strong>and</strong> <strong>hazardous</strong> <strong>waste</strong> management for Remote Sprint Launch Site 2 issimilar to that described for Remote Sprint Launch Site 1, except thatsome additional soil contamination investigations may be required for theevaporation ponds.<strong>3.7</strong>.2.6 Remote Sprint Launch Site 4—Hazardous Materials <strong>and</strong>Hazardous Waste ManagementThe relevant aspects of <strong>hazardous</strong> <strong>materials</strong>/<strong>waste</strong> management includethe applicable regulatory procedures for <strong>hazardous</strong> <strong>materials</strong> usage <strong>and</strong><strong>hazardous</strong> <strong>waste</strong> generation, <strong>and</strong> management programs for existing<strong>hazardous</strong> <strong>waste</strong>-contaminated sites within areas potentially affected bythe NMD program. The ROI for <strong>hazardous</strong> <strong>materials</strong> <strong>and</strong> <strong>hazardous</strong> <strong>waste</strong>management includes Remote Sprint Launch Site 4 for general operations<strong>and</strong> those areas where potential NMD construction activities could occur.The Remote Sprint Launch Sites (1, 2, <strong>and</strong> 4) were built of similar design<strong>and</strong> construction material. The relevant aspects of <strong>hazardous</strong> <strong>materials</strong><strong>and</strong> <strong>hazardous</strong> <strong>waste</strong> management for Remote Sprint Launch Site 4 issimilar to that described for Remote Sprint Launch Site 1.3-224 NMD Deployment Final EIS
Chapter 3—Affected Environment3.8 HEALTH AND SAFETY/ELECTROMAGNETICRADIATIONThe discussion of human health <strong>and</strong> safety includes both workers (e.g.,military <strong>and</strong> other government personnel, <strong>and</strong> contractor personnel) <strong>and</strong>the general public. Safety issues include injuries that may result fromone-time accidents. Health issues result from activities where peoplemay be impacted over a long-period of time rather than immediately. Theaffected environment for health <strong>and</strong> safety will include those areas thathave the potential to be affected by the increased risk of proposedprogram activities based on the NMD element being deployed at a givenlocation. This discussion will include existing hazards such as airfieldsafety zones, <strong>hazardous</strong> military operations (i.e., aircraft operations,military ground training), fire, unexploded ordnance, <strong>and</strong> explosive safetyzones. In addition, existing safety procedures will be described. Issuesrelated to the use of <strong>hazardous</strong> <strong>materials</strong> <strong>and</strong> generation of <strong>hazardous</strong><strong>waste</strong> will be addressed under the <strong>hazardous</strong> <strong>materials</strong> <strong>and</strong> <strong>hazardous</strong><strong>waste</strong> section of this EIS.Issues related to existing non-ionizing radiation will be addressed forthose locations where XBRs could be deployed. These sites includeEareckson AS, Alaska, Cavalier AFS, <strong>Missile</strong> Site Radar, <strong>and</strong> RemoteSprint Launch Sites 1, 2, <strong>and</strong> 4, North Dakota. A general description ofEMR is provided below. Specific information about the existing EMR <strong>and</strong>equipment that may be affected at these locations is described undereach site. Appendix E provides more detail on EMR.Electromagnetic Radiation EnvironmentEMR is generated during the operation of such items as microwaveovens, cellular phones, radios, televisions, <strong>and</strong> radars. By definition, EMRis waves of energy with both electric <strong>and</strong> magnetic components at rightangles to one another. The vibration or acceleration of an electric chargeproduces these components.EMR is usually classified as one of two types: ionizing radiation or nonionizingradiation. Non-ionizing radiation is produced by a wide variety ofequipment such as cellular phones, ham radios, <strong>and</strong> radars. X-rays,cosmic rays, <strong>and</strong> gamma rays produce ionizing radiation.Exposure to each of these types of radiation causes different effects inboth humans <strong>and</strong> equipment. Human exposure to high levels of nonionizingradiation primarily causes heat generation in body tissue. Humanexposure to high levels of ionizing radiation causes cell tissue damage.For equipment, high levels of EMR can also cause the inadvertentdetonation of ordnance or can simply cause static in radios or televisions.EMR normally causes problems to equipment either by electromagneticNMD Deployment Final EIS 3-225
Chapter 3—Affected Environmentinduction or degradation. Electromagnetic induction occurs when aconductor is moved through a magnetic field or whenever the magneticfield near a conductor is changing. Degradation occurs if undesiredpulses from the system emitting the radiation either reduce the sensitivityof the receiving equipment or in some way impair the process involved indetecting the desired signal (Newhouse, 1984—Radar EMC AnalysisH<strong>and</strong>book).St<strong>and</strong>ards have been approved by the DOD, American National St<strong>and</strong>ardsInstitute (ANSI), <strong>and</strong> the Institute of Electrical <strong>and</strong> Electronic Engineers(IEEE) to help identify these interference <strong>and</strong> radiation hazards. Thesest<strong>and</strong>ards also offer some mitigation techniques, such as maintaining safedistance separations <strong>and</strong> lowering the power levels of transmitters thatgenerate high levels of EMR.Defining the Electromagnetic EnvironmentOperation of a radar will certainly change the electromagneticenvironment. The electromagnetic environment is made up of bothcivilian <strong>and</strong> government communications-electronics equipment. Civilianuse of the electromagnetic spectrum is governed by the FederalCommunications Commission (FCC). Government use of the spectrum iscontrolled by the National Telecommunications <strong>and</strong> InformationAdministration. Radiation hazards consist of human exposure,electroexplosive devices, <strong>and</strong> fuel exposure to EMR.Communications–Electronics Frequency Related InterferenceCommunications–Electronics In-B<strong>and</strong> Radio Frequency Interference. Inb<strong>and</strong>frequency interference addressed in this EIS is for the X-B<strong>and</strong>(8,000 to 12,000 megahertz). The X-B<strong>and</strong> is the b<strong>and</strong> in which theproposed XBR will operate. In-b<strong>and</strong> radio frequency interference occurswhen two pieces of communications-electronics equipment are operatingwithin the same frequency b<strong>and</strong>. Therefore, equipment whosefrequencies fall within the same b<strong>and</strong>s will most likely be affected. Someexamples of in-b<strong>and</strong> communications-electronics equipment includeairborne weather radars, fire control radars, <strong>and</strong> bomb/navigation radars.Several methods such as software controls can be used to reduce radiofrequency interference caused by radars.Communications–Electronics Adjacent B<strong>and</strong> Interference. Adjacent b<strong>and</strong>radio frequency interference is similar to in-b<strong>and</strong> radio frequencyinterference. The adjacent b<strong>and</strong>s include all frequencies that are withinapproximately 5 percent of the operating frequency of the EMR source.The same st<strong>and</strong>ard methods to avoid interference that are used for inb<strong>and</strong>interference can be applied to adjacent b<strong>and</strong> interference.3-226 NMD Deployment Final EIS
Chapter 3—Affected EnvironmentCommunications–Electronics Harmonic B<strong>and</strong> Radio FrequencyInterference. Harmonic b<strong>and</strong> interference refers to interference producedin harmonically related receivers or interference caused by subharmonicallyrelated transmitters. Harmonic frequencies include thosefrequencies that are integer multiples of the operating frequencies. Subharmonicfrequencies are those frequencies that are simple fractions ofthe operating frequencies. The likelihood <strong>and</strong> severity of radio frequencyinterference in the harmonically related b<strong>and</strong>s is based upon the effectiveradiated power of the interfering source. Radio frequency interference inthe harmonically related b<strong>and</strong>s can be reduced by using software controls.Communications–Electronics Non-frequency Related InterferenceHigh Power Effects. The EMR fields associated with very high poweremitters have produced interference in electronic devices that has notbeen predictable by the classical analysis processes; i.e., processes thatpredict spurious <strong>and</strong> intermodulation responses. This interference hasbeen classified as high power effects (Franks, 1973—High Power EffectsSusceptibility Criteria). High power effects typically occur in receiversthat are located in proximity to high power transmitters <strong>and</strong> may be theresult of either antenna-coupled signals or equipment case penetration.The accepted levels for high power effects are 40 dBm per square meterfor military equipment <strong>and</strong> 30 dBm per square meter for civilian equipment(Franks, 1973—High Power Effects Susceptibility Criteria). At powerdensity levels below these thresholds, it can be reasonably assumed thathigh power effects are not likely to occur. At power density levels abovethese thresholds, it cannot be stated with certainty that high powereffects will occur, only that it is possible. High power effect is inherentlya non-linear effect <strong>and</strong> is, therefore, difficult to predict.Radio Frequency Interference to Avionics. Another form of nonfrequencyrelated interference affects aircraft <strong>and</strong> avionics. Aircraft mayfly through the main beam of a radar, <strong>and</strong> therefore would be exposed tohigh EMR levels. These levels of EMR could impact the communications<strong>and</strong> navigation equipment on the aircraft. The fly-by-wire controlsystems may also be impacted by these high levels of EMR.Both the DOD <strong>and</strong> the FAA have developed st<strong>and</strong>ards to protect aircraft<strong>and</strong> avionics from experiencing radio frequency interference. MilitarySt<strong>and</strong>ard 464, “Electromagnetic Environmental Effects Requirements forSystems” (Department of <strong>Defense</strong>, 1997—Electromagnetic EnvironmentalEffects) identifies the operational environment that military aircraft arelikely to experience <strong>and</strong> thus should be protected to those levels. At X-B<strong>and</strong>, the thresholds identified are 3,500 volts per meter (peak power)<strong>and</strong> 1,270 volts per meter (average power). An FAA st<strong>and</strong>ard, Notice8110.71 “Guidance for the Certification of Aircraft Operating in HighIntensity Radiated Fields” (Federal Aviation Administration, 1998—Notice8110.71) also identifies the operational environment that aircraft areNMD Deployment Final EIS 3-227
Chapter 3—Affected Environmentlikely to experience. The FAA thresholds for operating in high intensityradiated field environments are 3,000 volts per meter (peak power) <strong>and</strong>300 volts per meter (average power).Radiation HazardsOperation of radars may generate levels of EMR that are above thest<strong>and</strong>ards set to prevent harm to humans. Radars may also generateEMR that is great enough to cause the inadvertent detonation ofordnance or the inadvertent ignition of fuels.Human Exposure. The EMR that is generated by radars, microwaveovens, cellular phones, etc. is non-ionizing radiation that is absorbed intothe human body in the form of heat. This causes the temperature of thebody to rise. At low intensities, the heat that is induced by EMR can beaccommodated by the thermoregulatory capabilities of the individualsexposed. Thus, any effects produced would generally be reversible. Athigh intensities, the body’s ability to regulate temperature through bloodflow <strong>and</strong> sweat may be exceeded, which could lead to cell tissue damage(Hanscom AFB, 1991—EA HAVE STARE Radar).All current st<strong>and</strong>ards are based upon a 1982 report published by ANSI.The results of that report state that laboratory animals may be affectedby specific absorption rates above 4 watts per kilogram, if maintained forprotracted periods of time. Therefore, ANSI adopted a 10-fold safetymargin specifying a maximum absorption rate of 0.4 watt per kilogramaveraged over the whole body <strong>and</strong> 8 watts per kilogram in any one gramof tissue (IEEE, Inc., 1982—American National Safety Levels withRespect to Human Exposure to Radio Frequency Electromagnetic Fields).In 1991, the IEEE published a revision to the 1982 ANSI report. Thisrevision has since been adopted by the DOD as the st<strong>and</strong>ard forprotecting personnel from radiation hazards (Department of <strong>Defense</strong>,1996—Protection of DoD Personnel from Exposure to RadiofrequencyRadiation <strong>and</strong> Military Exempt Lasers). The revision defined personnelexposure limits as a function of frequency in controlled <strong>and</strong> uncontrolledenvironments. Controlled environments represent areas that may beoccupied by personnel who accept potential exposure as a contingent ofemployment or duties, by individuals who knowingly enter areas wheresuch levels are to be expected, <strong>and</strong> by personnel passing through suchareas. Uncontrolled environments generally represent living quarters,workplaces, or public access areas where personnel would not expect toencounter higher levels of radio frequency energy. In the X-B<strong>and</strong>frequency range, the more stringent personnel exposure limits are inuncontrolled environments. (See table 3.8-1.) These personnel exposurelimits range from 5.33 to 8 milliwatts per square centimeter for anaverage time of 11.25 minutes to 7.5 minutes respectively (IEEE, Inc.,3-228 NMD Deployment Final EIS
Chapter 3—Affected Environment1999—American National Safety Levels with Respect to HumanExposure to Radio Frequency Electromagnetic Fields).Table 3.8-1: IEEE Personnel Exposure Limits for UncontrolledEnvironmentsFrequency Range(in megahertz)Power Density(in milliwatts per squarecentimeter)0.003 to 0.1 100 6Average Time (minutes)0.1 to 1.34 100 61.34 to 3.0 180/f 2 f 2 /0.33 to 30 180/f 2 3030 to 100 0.2 30100 to 300 0.2 30300 to 3,000 f/1,500 303,000 to 15,000 f/1,500 90,000/f15,000 to 300,000 10 616,000/fSource: IEEE, Inc., 1999—American National Safety Levels with Respect to Human Exposure toRadio Frequency Electromagnetic Fields.Note: f = frequency in megahertzPeople with pacemakers may also be affected by the EMR generated byradars. According to the Air Force Occupational Safety <strong>and</strong> HealthSt<strong>and</strong>ard 161-9, significant disruption of normal pacemaker functionrequires radio frequency radiation signals having a primary frequencybetween 100 <strong>and</strong> 5,000 megahertz, pulsewidths greater than 10microseconds, <strong>and</strong> electric field strengths greater than 200 volts permeter (Department of the Air Force, 1987—Exposure to Radio FrequencyRadiation). The disruption of pacemakers via radio frequency radiationhas also been studied extensively at the Georgia Technical ResearchInstitute, <strong>and</strong> similar results have been found. The disruption ofpacemakers has not been studied in the X-B<strong>and</strong> frequency range becausethe potential for interference in the X-B<strong>and</strong> was so low that it did notm<strong>and</strong>ate further testing.Public concerns have also arisen regarding exposure to potential radiationhazards from electric <strong>and</strong> magnetic fields caused by power lines.However, a 1997 report from the National Academy of Sciences thatexamined over 500 studies performed over 17 years found that there isno conclusive evidence that electromagnetic fields play a role in thedevelopment of cancer, reproductive <strong>and</strong> developmental abnormalities, orlearning <strong>and</strong> behavioral problems (National Academy of Sciences, 1997—Possible Health Effects of Exposure to Residential Electric <strong>and</strong> MagneticFields). Researchers have studied the potential effects on human cells<strong>and</strong> tissue from electric <strong>and</strong> magnetic fields, <strong>and</strong> have found that only atNMD Deployment Final EIS 3-229
Chapter 3—Affected Environmentlevels between 1,000 <strong>and</strong> 100,000 times stronger than typical fieldsfound in residential areas have cells shown any reaction to electric <strong>and</strong>magnetic fields exposure. Therefore, the effects from power linegenerated electric <strong>and</strong> magnetic fields were given no furtherconsideration in this study.Electroexplosive Devices. An electroexplosive device is defined as asingle unit, device, or subassembly in which electrical energy is used toinitiate an enclosed explosive, propellant, or pyrotechnic material. Someapplications of electroexplosive devices are detonators, squibs, blastingcaps, <strong>and</strong> igniters. An electroexplosive device typically consists of aprimary charge, a booster charge, <strong>and</strong> a heat sensitive bead. The heatsensitive bead is similar to a match head, <strong>and</strong> it is ignited when a currentruns across two wires that are connected to the bead, thus constituting abridge. The bead ignites <strong>and</strong> sets off the primary charge, which initiatesthe main charge. The current that ignites the bead can be induced byenergy from EMR. Thus, high levels of EMR can inadvertently initiate thedevice. Energy from EMR may also cause the electroexplosive device tobecome inactive or dud whenever the induced current is insufficient toinitiate the device.The military st<strong>and</strong>ards applied to electroexplosive devices take intoconsideration three different phases in which electroexplosive devicescan be initiated: (1) h<strong>and</strong>ling/loading, (2) presence, <strong>and</strong> (3) shipping.The h<strong>and</strong>ling/loading phase occurs whenever the electroexplosive deviceis in an exposed condition, i.e. not installed or packaged. This is theworst case scenario. The presence phase occurs when theelectroexplosive device has been installed in a weapon, such as when around of ammunition has been loaded in a gun or a missile has beenloaded aboard a plane. The shipping phase occurs whenever theelectroexplosive device is stored in a shipping container or package. Themilitary st<strong>and</strong>ards associated with radiation hazards to electroexplosivedevices are listed in table 3.8-2.Table 3.8-2: Electroexplosive St<strong>and</strong>ardsMilitary St<strong>and</strong>ard Date Threshold at X-B<strong>and</strong>in volts per meterPhaseAir Force Manual 91- May 1996 200 H<strong>and</strong>ling/Loading201Military St<strong>and</strong>ard 464 March 1997 1,270 Presence/ShippingSource: Department of <strong>Defense</strong>, 1996—DODI 6055.11—Protection of DOD Personnel fromExposure to Radio Frequency Radiation.Fuels. High levels of EMR may cause the accidental ignition of fuelvapors by radio frequency induced arcs during fuel h<strong>and</strong>ling operations.The probability of accidental ignition has been reduced in recent years3-230 NMD Deployment Final EIS
Chapter 3—Affected Environmentthrough various mitigation techniques such as pressurized fuelingsystems on aircraft <strong>and</strong> the use of less volatile fuels. However, the riskis still present during the h<strong>and</strong>ling of more volatile fuels such as motorvehicle <strong>and</strong> aviation gasolines. Air Force Technical Order 31 Z-10-4requires a threshold of 5,000 milliwatts per square centimeter to preventthe inadvertent ignition of fuels (Department of the Air Force, 1989—Electromagnetic Radiation Hazards).3.8.1 ALASKA INSTALLATIONS3.8.1.1 Clear AFS—Health <strong>and</strong> SafetyThis section describes the health <strong>and</strong> safety concerns for the affectedbase property at Clear AFS <strong>and</strong> the surrounding area. The ROI for health<strong>and</strong> safety includes the base <strong>and</strong> adjacent properties that could beaffected by the deployment of a GBI or BMC2 at Clear AFS. The areapotentially affected off-base would be the properties immediatelyadjacent to the base <strong>and</strong> the transportation network for <strong>hazardous</strong><strong>materials</strong>. For a general description of the health <strong>and</strong> safety resourcearea, see section 3.8.The Air Force has developed st<strong>and</strong>ards that dictate the amount of fireequipment that must be present based on the types of total square footageof base structures <strong>and</strong> housing. The Clear AFS fire department meetsthese st<strong>and</strong>ards, maintaining one structural pumper, a smaller fire fightingvehicle, <strong>and</strong> an emergency comm<strong>and</strong> vehicle. One centrally located facilityhouses the equipment. The positioning of this facility also meets the AirForce time <strong>and</strong> distance requirements for facility response. The basecontractor has a Health <strong>and</strong> Safety Plan <strong>and</strong> there is a full-time emergencymedical technician on the base.Base health <strong>and</strong> safety issues at Clear AFS include EMR associated withoperation of the Ballistic <strong>Missile</strong> Early Warning System radar <strong>and</strong> runwayapproach clearance zones at the end of the Clear Airport public airstrip.To ensure operational safety around the Ballistic <strong>Missile</strong> Early WarningSystem radar, a 1,524-meter (5,000-foot) control zone is maintained forstructures emanating in a northwesterly direction from the radar (figure3.8-1) (Clear AFS, 1993—Comprehensive Planning Framework).Radiation exposure measurement taken in surveys identified areas inwhich the power density levels exceeded the permissible exposure levelof 4 milliwatts per square centimeter. These areas are within the baseTechnical Site where the radar facilities are located. All areas in whichradiation levels above the permissible exposure level were measured havebeen posted with warning signs, <strong>and</strong> access is strictly controlled duringradar operation. The base also maintains a Radiation Protection Program,which is implemented by the Radiation Protection Officer. This programis intended to identify, monitor, <strong>and</strong> control areas <strong>and</strong> sources ofpotentially <strong>hazardous</strong> radiation, <strong>and</strong> to provide training for personnelNMD Deployment Final EIS 3-231
Index MapAnderson RoadClear AFSAlaskaRadarControlZoneNenana RiverLake SansingPhased-ArrayRadarCoolingPondTech SiteComposite AreaCampSiteClear AirportRadio RelayStationRunwayClearanceZonesClear Air Force StationBallistic <strong>Missile</strong> EarlyWarning System RadarAlaska RailroadParks HighwayEXPLANATIONNORTHhs_clas_0013-232RoadsWater AreaInstallation BoundaryRailroadsBallistic <strong>Missile</strong> SystemRadar Control ZoneScale0 2,500 5,000 Feet0 762 1,524 MetersNMD Deployment Final EISExisting Health <strong>and</strong>Safety Issues, ClearAir Force StationAlaskaFigure 3.8-1
Chapter 3—Affected Environmentworking at the site with respect to such hazards (U.S. Department of theAir Force, 1997—EA for Radar Upgrade at Clear Air Station, Alaska).Currently, a new solid state phased-array radar is being installed at ClearAFS to replace the existing Ballistic <strong>Missile</strong> Early Warning System radar.The new radar is expected to be operational in the fall of 2000. Groundlevelmeasurements taken at a distance of 305 meters (1,000 feet) froma similar radar as the proposed phased-array averaged 0.005 milliwatt persquare centimeter, well below the permissible exposure levels of 4milliwatts per square centimeter. In addition, the phased-array radar isnot expected to be a threat to fuel-h<strong>and</strong>ling operations or to groundbasedelectroexplosive devices (U.S. Department of the Air Force,1997—EA for Radar Upgrade at Clear Air Station, Alaska).Clear Airport is a small public airstrip northeast of the base. The runwayapproach clearance zones on the southern end of the runway are onClear AFS boundary (Clear AFS, 1993—Comprehensive PlanningFramework). The airstrip is primarily used by small private planes <strong>and</strong>has no scheduled commercial service.3.8.1.2 Eareckson AS—Health <strong>and</strong> SafetyThis section describes the health <strong>and</strong> safety concerns for the affected baseproperty at Eareckson AS <strong>and</strong> the surrounding area. The ROI for health<strong>and</strong> safety includes the base <strong>and</strong> adjacent public that could be affected bythe deployment of an XBR. The ROI for EMR human health effects is thebase <strong>and</strong> adjacent property. This ROI is based on the area where potentialeffects to human health are expected to occur (out to 150 meters [492feet]). The ROI for certain electronic equipment <strong>and</strong> aircraft (see below)includes an area up to 350 kilometers (217 miles). For a generaldescription of the health <strong>and</strong> safety resource area, see section 3.8.On-base SafetyThe Air Force has developed st<strong>and</strong>ards that dictate the amount of fireequipment that must be present based on the types of aircraft <strong>and</strong> totalsquare footage of base structures <strong>and</strong> housing. The Eareckson AS firedepartment meets these st<strong>and</strong>ards, maintaining four crash fire trucks, threestructural pumpers, <strong>and</strong> one spill response truck. One centrally locatedfacility houses the equipment. The positioning of this facility also meetsthe Air Force time <strong>and</strong> distance requirements for facility response.The threats to human safety from aircraft accidents at Eareckson AS havebeen addressed by the establishment of safety zones around the airfield.In order to minimize the risk at each end of the runway, a Clear Zone <strong>and</strong>Approach Zones have been designated. These zones have beenestablished to limit development around the airfield on the isl<strong>and</strong> (figure3.8-2).NMD Deployment Final EIS 3-233
Index MapCobra DaneRadarEarecksonASAlaskaShemya PassBering SeaAWS RoadRUNWAY "C" - Ab<strong>and</strong>onedRUNWAY "B" - Ab<strong>and</strong>onedEast RoadClear Zone10,000' RUNWAY - ActiveExisting SewageTreatment PlantFoxBeachPacific OceanClear ZoneEXPLANATIONRoadsL<strong>and</strong> AreaWater AreaUnexploded OrdnanceExplosive Safety Quantity Distance (ESQD)Runway Clear Zone BoundaryExisting Health <strong>and</strong>Safety Issues,Eareckson Air StationNORTHhs_eas_0013-234Scale0 1,738 3,475 Feet0 530 1,059 MetersNMD Deployment Final EISAlaskaFigure 3.8-2
Chapter 3—Affected EnvironmentOther base safety issues include ESQDs associated with aircraft loading<strong>and</strong> unloading areas, unexploded ordnance areas, World War II bunkers,<strong>and</strong> the weather. Although no ordnance is stored on the base, the AirForce still maintains ESQDs along the aircraft flight line for aircraft usingthe airfield. There are presently four designated areas on the isl<strong>and</strong> thathave known unexploded ordnance. These areas are clearly marked with“Danger Unexploded Ordnance” signs. Each person working on theisl<strong>and</strong> is informed of these areas. As a result of past construction on theisl<strong>and</strong>, there are many areas, which may have underground structures,which could pose a health hazard if not identified prior to constructionactivities. Periods of <strong>hazardous</strong> weather conditions (usually high winds)occur at Eareckson AS, <strong>and</strong> individuals are warned to take precautionsduring these conditions. The base safety office may limit outside accessduring these conditions. The base contractor has a Health <strong>and</strong> SafetyPlan, <strong>and</strong> there is a full-time emergency medical technician on the isl<strong>and</strong>.Electromagnetic Radiation EnvironmentFor purposes of this study, the electromagnetic environment around theEareckson AS site includes all ground-based systems within a 30-kilometer (19-mile) radius for out-of-b<strong>and</strong> systems <strong>and</strong> within a 350-kilometer (217-mile) radius for in-b<strong>and</strong>, adjacent b<strong>and</strong>, <strong>and</strong> harmonicallyrelatedb<strong>and</strong>s. The out-of-b<strong>and</strong> communications-electronics environmentaround the Eareckson AS site was found to include 48 systems rangingin frequencies from 221 kilohertz to 10,525 megahertz. The distributionof these systems over the electromagnetic spectrum, VHF–K-B<strong>and</strong>, isshown in figure 3.8-3. These systems were categorized into potentialreceiving of frequency-related interference or non-frequency relatedinterference.Communications–Electronics Frequency Related Interference. Theexisting ground-based communications-electronics environment aroundthe Eareckson AS site includes no in-b<strong>and</strong> systems. The airborneelectromagnetic environment includes three types of in-b<strong>and</strong> systems:fire control, bomb/navigation, <strong>and</strong> weather radars. Weather radars areutilized on both civilian <strong>and</strong> military aircraft. Section 3.3.1.1 provides anoverview of the airspace <strong>and</strong> airports in the Eareckson AS ROI.Communications–Electronics Non-frequency Related Interference. The outof-b<strong>and</strong>electromagnetic environment (within 30 kilometers [19 miles]) atthe Eareckson AS site includes 48 ground-based systems. The majority ofthe systems (37 of 48 systems) are used for UHF <strong>and</strong> VHF l<strong>and</strong>-mobileradios. Also included are one airport surveillance radar, one early warningradar, one air traffic control radar beacon, one VHF omni-directionalrange/tactical air navigation aid, one Identify Friend or Foe (IFF) system,<strong>and</strong> six fixed/mobile-broadcasting satellites. Although no airborne systemsare registered with the National Telecommunications <strong>and</strong> InformationNMD Deployment Final EIS 3-235
30Equipment Number2520151050VHF UHF L-B<strong>and</strong> S-B<strong>and</strong> C-B<strong>and</strong> X/Ku-B<strong>and</strong> K/Ka-B<strong>and</strong>Frequency B<strong>and</strong>Equipment Distributionat Eareckson AirStationFigure 3.8-3hs_eas_xbr_0023-236NMD Deployment Final EIS
Chapter 3—Affected EnvironmentAdministration (NTIA) or FCC for this area, it is anticipated that variousavionics equipment (tactical air navigation, IFF systems, glideslopes,beacons, etc.) will be present as aircraft travel in <strong>and</strong> out of the area.Additionally, the COBRA DANE Early Warning Radar is on Eareckson AS<strong>and</strong> can adversely affect electroexplosive devices aboard aircraft. Aseparation distance of 6 kilometers (4 miles) is recommended forelectroexplosive devices aboard aircraft, in the presence phase, <strong>and</strong> 1.20kilometers (0.75 mile) for electroexplosive devices on the ground, in theh<strong>and</strong>ling/loading phase.Radiation Hazards. Based upon the presence of high-power emitterswithin a 30-kilometer (19-mile) radius of Eareckson AS, the existingelectromagnetic environment could present substantial levels of radiationhazards to personnel <strong>and</strong> electroexplosive devices. No hazard to fuels isexpected.The COBRA DANE Radar, AN/FPS-108, presents the highest probabilityfor radiation hazards. COBRA DANE is an early-warning phased-arrayradar that provides tactical warning <strong>and</strong> attack assessment of sealaunched<strong>and</strong> intercontinental ballistic missiles launched against thecontinental United States.The COBRA DANE operates in the L-B<strong>and</strong> frequency range (1,000 to2,000 megahertz). The beam from the COBRA DANE is continuallyscanning, <strong>and</strong> therefore will interact with the surrounding environment.However, due to the location <strong>and</strong> orientation of the COBRA DANEantenna on top of a cliff facing the open ocean, the interaction with theenvironment is limited to sidelobe <strong>and</strong> backlobe interactions.According to IEEE C95.1, personnel exposure limits for uncontrolledenvironments in the 1,000 to 2,000 megahertz frequency range arebetween 0.78 <strong>and</strong> 0.92 milliwatt per square centimeter for an averagetime of 30 minutes. The COBRA DANE Radar can exceed the IEEEst<strong>and</strong>ard for distances out to approximately 100 meters (328 feet). Thearea around the face of the COBRA DANE is an enclosed area withingovernment-controlled l<strong>and</strong> that is fenced to assure no unauthorizedaccess occurs within the <strong>hazardous</strong> area.3.8.1.3 Eielson AFB—Health <strong>and</strong> SafetyThis section describes the health <strong>and</strong> safety concerns for the affectedbase property at Eielson AFB <strong>and</strong> the surrounding area. The ROI forhealth <strong>and</strong> safety includes the base <strong>and</strong> adjacent properties that could beaffected by the deployment of a GBI or BMC2 at Eielson AFB. The areapotentially affected off-base would be the properties immediatelyadjacent to the base <strong>and</strong> the transportation network for <strong>hazardous</strong>NMD Deployment Final EIS 3-237
Chapter 3—Affected Environment<strong>materials</strong>. For a general description of the health <strong>and</strong> safety resourcearea, see section 3.8.The Eielson AFB Safety Office reviews base safety issues. Other offices,such as the Bioenvironmental Engineering Office, also ensure safeoperations by providing services such as sampling of indoor air, water,<strong>and</strong> unknown material or <strong>waste</strong>. To assist in emergency response,Eielson AFB maintains mutual aid agreements with the Bureau of L<strong>and</strong>Management to fight range fires <strong>and</strong> 10 local fire departments within thesurrounding area. The Bureau of L<strong>and</strong> Management has the primaryresponsibility of fighting fires in the forested area of Eielson AFB withassistance from the base fire department. The base maintains firebreaksaround <strong>hazardous</strong> areas such as ammunition storage areas <strong>and</strong> fuelstorage areas (Pacific Air Forces, 1998—Draft General Plan, Eielson AFB).The Air Force has developed st<strong>and</strong>ards that dictate the amount of fire/crashequipment <strong>and</strong> staffing that must be present based on the number <strong>and</strong>types of aircraft stationed on-base, <strong>and</strong> the types <strong>and</strong> total square footageof base structures <strong>and</strong> housing. The Eielson AFB fire department meetsthese st<strong>and</strong>ards, maintaining five crash trucks, three structural trucks, twowater trucks, two ramp vehicles, two comm<strong>and</strong> vehicles, <strong>and</strong> one<strong>hazardous</strong> material truck. The base currently has 74 personnel toadminister <strong>and</strong> manage the program for both the flightline <strong>and</strong> the basefacilities. Two fire stations, one along the flightline <strong>and</strong> the second in thebase housing area, provide the base fire protection needs. The positioningof these facilities meets the Air Force time <strong>and</strong> distance requirements forfacility response.The threats to human safety from aircraft accidents at Eielson AFB aresummarized in the Air Installation Compatible Use Zone (AICUZ) Report.The AICUZ guidelines are based on the type of aircraft at the base <strong>and</strong>the nature of operations conducted. In order to minimize the risk to thepublic at each end of the runway, a Clear Zone <strong>and</strong> two AccidentPotential Zones have been designated. The Clear Zone, the area whereaircraft mishaps are most likely to occur, is contained within the baseboundaries (figure 3.8-4).Other on-base safety restrictions include ESQDs associated with theRailroad Unloading Dock, munitions storage at Engineer Hill <strong>and</strong> QuarryHill, A-10 aircraft weather shelters, weapon unloading <strong>and</strong> loading areas,small arms munitions impact areas, <strong>and</strong> the chaff flare facility locatednear the northern end of the runway. There are no EMR safety zones onEielson AFB (Pacific Air Forces, 1998—Draft General Plan, Eielson AFB).To service the base aircraft, large amounts of jet fuel are stored on-basealong with hydrazine, which is associated with the F-16 emergencypower unit. The base has both st<strong>and</strong>ard <strong>and</strong> emergency operationprocedures for the h<strong>and</strong>ling of both of these fuels.3-238 NMD Deployment Final EIS
Index MapEielsonAFBThe Alaska RailroadRichardson HighwayTransmitter Rd.AlaskaManchu TrailQuarry Rd.2Skeet RangeTanana RiverEXPLANATIONEielson AFB BoundaryNORTHhs_eafb_001Explosive Safety QuantityDistance (ESQD)Runway Clear ZoneBoundaryRoadsScale0 .8 1.6 Miles0 1.25 2.5 KilometersRailroadsWater AreaBuildingNMD Deployment Final EISExisting Health <strong>and</strong>Safety Issues,Eielson Air ForceBaseAlaskaFigure 3.8-43-239
Chapter 3—Affected Environment3.8.1.4 Fort Greely—Health <strong>and</strong> SafetyThis section describes the health <strong>and</strong> safety concerns for the affectedbase property at Fort Greely <strong>and</strong> the surrounding area. The ROI forhealth <strong>and</strong> safety includes the base <strong>and</strong> adjacent properties that could beaffected by the deployment of a GBI or BMC2 at Fort Greely. The areapotentially affected off-base would be the properties immediatelyadjacent to the base <strong>and</strong> the transportation network for <strong>hazardous</strong><strong>materials</strong>. For a general description of the health <strong>and</strong> safety resourcearea, see section 3.8.The Fort Greely cantonment is being realigned; therefore, some of theoperations in this area have ceased. The base still maintainsmaintenance personnel <strong>and</strong> fire fighting support for the cantonment area.The Fort Greely fire department maintains four crash/pumper trucks, threebrush trucks, one small pumper truck, <strong>and</strong> a comm<strong>and</strong> vehicle. The basecurrently has 11 personnel to administer <strong>and</strong> manage the fire department.To assist in emergency response, Fort Greely maintains mutual aidagreements with most of the small communities within a 161-kilometer(100-mile) radius of the base. The Bureau of L<strong>and</strong> Management has theprimary responsibility of fighting fires in the forested area of Fort Greelywith assistance from the post fire department.Fort Greely has an airfield; however, this field is only minimally used fortraining. The Clear Zones for the airfield are contained within the baseboundaries (Department of the Army, 1983—The Master Plan of FortGreely).Health <strong>and</strong> safety issues at Fort Greely are associated with both Army<strong>and</strong> Air Force activities <strong>and</strong> range fires. The Army trains at Fort Greelythroughout the year with exercises including the deployment of troops,weapons firing, <strong>and</strong> infantry tactical maneuvers. The Fort Greely TrainingArea is also used as a test site for weapons <strong>and</strong> equipment, includingexperimental designs, under conditions of extreme cold. Weapons arefired from the east side of the Delta River towards weapon impact areas(figure 3.8-5). Weapons include rockets, mortars, small arms, <strong>and</strong>artillery. Access to the weapon impact areas on Fort Greely is restrictedbecause of the potential of unexploded ordnance (U.S. Army Alaska,1997—Draft Integrated Natural Resources Management Plan). Becauseof the long history of military training on Fort Greely there is still a lowpotential for unexploded ordnance in areas outside of the weapon impactareas. Most of this ordnance consists of small arms ammunition <strong>and</strong> 40-millimeter practice grenades. The Fort Greely East Training Area is usedprimarily as a nonfiring maneuver area. The Cold Regions Test Centerutilizes this same area for experimental airdrops, airborne training, <strong>and</strong>testing of clothing, vehicles, <strong>and</strong> equipment (U.S. Army Alaska, 1997—Draft Integrated Natural Resources Management Plan).3-240 NMD Deployment Final EIS
Little Delta RiverIndex MapFt. GreelyRichardson HighwayDelta CreekAlaskaDelta Creek AssaultL<strong>and</strong>ing StripTanana RiverDelta RiverSullivanAir StripCantonment AreaDelta JunctionAllen Army AirfieldBuffalo Drop ZoneAlaska HighwayEddy Drop ZoneMain PostButch Drop ZoneBennet Air StripFox Drop ZoneDelta RiverDonnellyAssault Airfield/Drop ZoneBear Drop ZoneRichardson HighwayJarvis CreekEXPLANATIONRoads <strong>and</strong> Major TrailsRiversNORTHhs_fge_001Installation BoundaryTrans-Alaska PipelineCantonment AreaMain Post BoundaryScale 1:500,0000 4 7.9 Miles0 6.4 12.7 KilometersFort GreelyAir StripDrop ZoneHazard AreaImpact AreaFiring PointCityNMD Deployment Final EISExisting Health <strong>and</strong>Safety Issues,Fort GreelyAlaskaFigure 3.8-53-241
Chapter 3—Affected EnvironmentThe Air Force uses the airspace above Fort Greely <strong>and</strong> the weaponsimpact areas for training activities. The type of aircraft operationsinclude close air support, aerial gunnery, rockets, bombing, trainingflights, <strong>and</strong> test flights. These activities are conducted within therestricted airspace or along military training routes above Fort Greely.The Air Force has safety procedures in place for the aircraft activitiesabove Fort Greely.Under a Memor<strong>and</strong>um of Underst<strong>and</strong>ing, the Bureau of L<strong>and</strong> ManagementAlaska Fire Service is responsible for fire detection <strong>and</strong> suppression onwithdrawn l<strong>and</strong>s. The Alaska Fire Service has a reciprocal Fire ProtectionAgreement with the State of Alaska, Department of Natural Resources,Division of Forestry. The Alaska Wildl<strong>and</strong> Fire Management Planestablishes four fire protection options (Bureau of L<strong>and</strong> Management,1998—Draft Alaska Wildl<strong>and</strong> Fire Management Plan). L<strong>and</strong> managersmay select among these options, based on the evaluation of theirindividual legal m<strong>and</strong>ates, policies, regulations, resource management,objectives <strong>and</strong> local conditions. The fire protection status options are: Critical Protection—L<strong>and</strong>s receive maximum detection coverage<strong>and</strong> are of highest priorities for attack response (figure 3.8-6). Full Protection—Areas receive maximum detection coverage<strong>and</strong> immediate <strong>and</strong> aggressive initial attack response. Modified Protection—A level of protection is provided betweenFull <strong>and</strong> Limited. Limited Protection—Areas where the values at risk do notwarrant the expense or suppression <strong>and</strong> are areas wherenatural fire is important to ecosystem sustainability. Restricted—Includes Weapon Impact Areas <strong>and</strong> other placeswhere no “on the ground” fire fighting can be accomplisheddue to the danger of unexploded ordnance.Nineteen fires of 40 hectares (100 acres) or more occurred on FortGreely from 1954–1997. Two were in the East Training Area <strong>and</strong>occurred in 1954 <strong>and</strong> 1987. The remaining 17 fires were in the FortGreely West Training Area. Ten of the above fires were caused byincendiary devices, <strong>and</strong> five by lightning. Information on the remainingfour is not available. The U.S. Army Alaska requires a 15-meter (50-foot)firebreak around all facilities.3.8.1.5 Yukon Training Area (Fort Wainwright)—Health <strong>and</strong> SafetyThis section describes the health <strong>and</strong> safety concerns for the affectedbase property at the Yukon Training Area <strong>and</strong> the surrounding area. TheROI for health <strong>and</strong> safety includes the base <strong>and</strong> adjacent properties thatcould be affected by the deployment of a GBI or BMC2 at the YukonTraining Area. The area potentially affected off-base would be the3-242 NMD Deployment Final EIS
Little Delta RiverIndex MapFt. GreelyRichardson HighwayDelta CreekAlaskaTanana RiverDelta RiverCantonment AreaDelta JunctionAllen ArmyAirfieldAlaska HighwayWest Training AreaMain PostEast TrainingAreaDelta RiverRichardson HighwayJarvis CreekEXPLANATIONRoads <strong>and</strong> Major TrailsRiversNORTHhs_fge_002Installation BoundaryTrans-Alaska PipelineCantonment AreaMain Post BoundaryScale 1:500,0000 4 7.9 Miles0 6.4 12.7 KilometersFort GreelyCritical ProtectionFull ProtectionModified ActionLimited ActionCityNMD Deployment Final EISFire Protection Status,Fort GreelyAlaskaFigure 3.8-63-243
Chapter 3—Affected Environmentproperties immediately adjacent to the base <strong>and</strong> the transportationnetwork for <strong>hazardous</strong> <strong>materials</strong>. For a general description of the health<strong>and</strong> safety resource area, see section 3.8.Health <strong>and</strong> safety issues at the Yukon Training Area are associated withboth Army <strong>and</strong> Air Force activities <strong>and</strong> range fires. The Army trains at theYukon Training Area throughout the year with exercises including thedeployment of troops, weapons firing, <strong>and</strong> infantry tactical maneuvers.Weapons are fired from firing points into the Stuart Creek Impact Area(figure 3.8-7). Weapons include rockets, mortars, small arms, <strong>and</strong>artillery. Access to the weapon impact areas on the Yukon Training Areais restricted because of the potential of unexploded ordnance. Because ofthe long history of military training on the Yukon Training Area, there isstill a low potential for unexploded ordnance in areas outside of theweapon impact areas. Most of the ordnance consists of small armsammunition <strong>and</strong> 40-millimeter practice grenades. In addition to the StuartCreek Impact Area, there are two small arms range in the maneuver area.The Air Force uses the airspace above the Yukon Training Area <strong>and</strong> theStuart Creek Impact Area for training activities. The type of aircraftoperations include close air support, aerial gunnery, rockets, bombing,training flights, <strong>and</strong> test flights. These activities are conducted withinthe restricted airspace or along military training routes above the YukonTraining Area. The Air Force has safety procedures in place for theaircraft activities above the Yukon Training Area.Range fire fighting practices for the Yukon Training Area are similar tothose described for Fort Greely (section 3.8.1.4). Figure 3.8-8 providesthe fire protection status options for the Yukon Training Area.Eleven fires of 40 hectares (100 acres) or more occurred on the YukonTraining Area from 1954-1997. Nine of these fires were caused byincendiary devices within the Stuart Creek Impact Area <strong>and</strong> Buffer Zone.Two fires occurred within the northern portion of the maneuver area.The cause of one fire is unknown <strong>and</strong> the other was caused by lightning.Firebreaks are maintained around critical facilities at the Yukon TrainingArea.3.8.2 NORTH DAKOTA INSTALLATIONS3.8.2.1 Cavalier AFS—Health <strong>and</strong> SafetyThis section describes the health <strong>and</strong> safety concerns for the affectedbase property at Cavalier AFS <strong>and</strong> the surrounding area. The ROI forhealth <strong>and</strong> safety includes the base <strong>and</strong> adjacent public that could beaffected by the deployment of an XBR. The ROI for EMR human healtheffects is the base <strong>and</strong> adjacent property. This ROI is based on the areawhere potential effects to human health are expected to occur (out to3-244 NMD Deployment Final EIS
Index MapYukonTrainingAreaChenaHot Springs RoadSouth Fork Chena RiverChena RiverHuskyDrop ZoneTransmitter RoadAlaskaBeaver Creek RoadEielson AFBSmall ArmsRangeManchu TrailQuarryRoadSkyline RoadStuart CreekImpact Area/Buffer ZoneBrigadier TrailSmall ArmsRange2Tanana RiverJohnson RoadSalcha RiverRichardson HighwayEXPLANATIONRoadsRiversNORTHhs_yukon_002Water AreaInstallation BoundaryScale 1:300,0000 2.4 4.7 Miles0 3.8 7.6 KilometersYukon Training AreaDrop ZoneSmall Arms RangeImpact Area/Buffer ZoneFiring PointNMD Deployment Final EISExisting Health <strong>and</strong>Safety Issues, YukonTraining AreaAlaskaFigure 3.8-73-245
Index MapYukonTrainingAreaChenaHot Springs RoadSouth Fork Chena RiverChena RiverTransmitter RoadAlaskaBeaver Creek RoadEielson AFBManchu TrailQuarryRoadSkyline RoadBrigadier TrailTanana RiverJohnson RoadSalcha RiverRichardson HighwayEXPLANATIONRoadsRiversWater AreaInstallation BoundaryYukon Training AreaFull ProtectionModified ActionLimited ActionFire Protection Status,Yukon Training AreaNORTHhs_yukon_0013-246Scale 1:300,0000 2.4 4.7 Miles0 3.8 7.6 KilometersNMD Deployment Final EISAlaskaFigure 3.8-8
Chapter 3—Affected Environment150 meters [492 feet]). The ROI for certain electronic equipment <strong>and</strong>aircraft (see below) includes a radius up to 350 kilometers (217 miles).For a general description of the health <strong>and</strong> safety resource area, seesection 3.8.On-base SafetyThe Air Force has developed st<strong>and</strong>ards that dictate the amount of fireequipment <strong>and</strong> staffing that must be present based on the types <strong>and</strong> totalsquare footage of base structures <strong>and</strong> housing. The Cavalier AFS firedepartment meets these st<strong>and</strong>ards, maintaining two pumper trucks. Thebase currently has 18 personnel to administer <strong>and</strong> manage the programfor base facilities. One centrally located facility houses the equipment.The positioning of this facility also meets the Air Force time <strong>and</strong> distancerequirements for facility response. The Cavalier AFS Fire ProtectionContractor established mutual aid agreements with six neighboringcommunities to ensure emergency response is available for the site <strong>and</strong>local towns.Electromagnetic Radiation EnvironmentFor purposes of this study, the electromagnetic environment around theCavalier AFS site includes all ground-based systems within a 30-kilometer(19-mile) radius for out-of-b<strong>and</strong> systems <strong>and</strong> within a 350-kilometer(217-mile) radius for in-b<strong>and</strong>, adjacent b<strong>and</strong>, <strong>and</strong> harmonically-relatedb<strong>and</strong>s. The out-of-b<strong>and</strong> communications-electronics environment aroundthe Cavalier AFS site was found to include 205 systems ranging infrequencies from 48 to 24,150 megahertz. The distribution of thesesystems over the electromagnetic spectrum, VHF–K-B<strong>and</strong>, is shown infigure 3.8-9. These systems were categorized into potential sensitivereceptors of frequency-related interference or non-frequency relatedinterference.Communications—Electronics Frequency Related Interference. Theexisting ground-based communications-electronics environment aroundthe Cavalier AFS site includes two in-b<strong>and</strong> systems: a precisionapproach radar in Minot, North Dakota, <strong>and</strong> a weather radar in ParkRapids, Minnesota. The airborne electromagnetic environment includesthree types of in-b<strong>and</strong> systems: fire control, bomb/navigation, <strong>and</strong>weather radars. Weather radars are utilized on both civilian <strong>and</strong> militaryaircraft. Section 3.3.2.1 provides an overview of the airspace <strong>and</strong>airports in the Cavalier AFS ROI.Communications—Electronics Non-frequency Related Interference. Theout-of-b<strong>and</strong> electromagnetic environment (within 30 kilometers [19miles]) at the Cavalier AFS site includes 205 ground-based systems. Themajority of the systems (193 systems) are l<strong>and</strong>-mobile UHF <strong>and</strong> VHFNMD Deployment Final EIS 3-247
Equipment Number140120100806040200Cavalier AFS<strong>Missile</strong> Site RadarRemote Sprint Launch Site 1Remote Sprint Launch Site 2VHF UHFL-B<strong>and</strong>S-B<strong>and</strong>C-B<strong>and</strong>X/Ku-B<strong>and</strong>Frequency B<strong>and</strong>K/Ka-B<strong>and</strong>Remote Sprint Launch Site 4EXPLANATIONNote: Number of equipment found within50 kilometers (31 miles) of site.Equipment Distributionin Northeast NorthDakotaFigure 3.8-9hs_cas_xbr_0013-248NMD Deployment Final EIS
Chapter 3—Affected Environmentradios. Also included are one speed gun, one satellite communicationsterminal, <strong>and</strong> ten fixed/mobile broadcasting satellites. Although noairborne systems are registered with the NTIA or FCC for this area, it isanticipated that various avionics equipment (tactical air navigation, IFFsystems, glideslopes, beacons, etc.) will be present as aircraft travel in<strong>and</strong> out of the area.Also, the Perimeter Acquisition Radar can adversely affectelectroexplosive devices aboard aircraft. In 1974, tests were conductedwhere electroexplosive devices aboard a B-52H were flown through EMRfields from the Perimeter Acquisition Radar. Based on those tests, a 13-kilometer (8-mile) required separation distance was recommended foraircraft carrying electroexplosive devices (Hovan <strong>and</strong> Wirt, 1974—Response of Airborne Electroexplosive Devices to SafeguardElectromagnetic Radiation).Radiation Hazards. The Perimeter Acquisition Radar, AN/FPQ-16,presents the highest probability for radiation hazards within the 30-kilometer (19-mile) ROI. The Perimeter Acquisition Radar is a phasedarrayradar that provides tactical warning <strong>and</strong> attack assessment of sealaunched<strong>and</strong> intercontinental ballistic missiles launched against thecontinental United States.The Perimeter Acquisition Radar operates in the UHF b<strong>and</strong> (420 to 450megahertz). The beam from the Perimeter Acquisition Radar iscontinually scanning, <strong>and</strong> therefore interacts with the surroundingenvironment.According to IEEE C95.1, personnel exposure limits for uncontrolledenvironments in the 420 to 450 megahertz frequency range are between0.28 <strong>and</strong> 0.30 milliwatt per square centimeter for an average time of 30minutes. The Perimeter Acquisition Radar can exceed the IEEE st<strong>and</strong>ardfor distances out to approximately 120 meters (394 feet). The areaaround the Perimeter Acquisition Radar at this distance is an enclosedarea within government-controlled l<strong>and</strong> that is fenced to assure nounauthorized access occurs. No hazards to fuels in the area occur.3.8.2.2 Gr<strong>and</strong> Forks AFB—Health <strong>and</strong> SafetyThis section describes the health <strong>and</strong> safety concerns for the affectedbase property at Gr<strong>and</strong> Forks AFB <strong>and</strong> the surrounding area. The ROI forhealth <strong>and</strong> safety includes the base <strong>and</strong> adjacent properties that could beaffected by the deployment of a GBI or BMC2 at Gr<strong>and</strong> Forks AFB. Thearea potentially affected off-base would be the properties immediatelyadjacent to the base, <strong>and</strong> the transportation network for <strong>hazardous</strong><strong>materials</strong>. For a general description of the health <strong>and</strong> safety resourcearea, see section 3.8.NMD Deployment Final EIS 3-249
Chapter 3—Affected EnvironmentThe Gr<strong>and</strong> Forks Safety Office reviews base safety issues. Other offices,such as the Bioenvironmental Engineering Office, also ensure safeoperations by providing services such as sampling of indoor air, water,<strong>and</strong> unknown material or <strong>waste</strong>. To assist in emergency response, Gr<strong>and</strong>Forks AFB maintains mutual aid agreements with local fire departments inthis area.The Air Force has developed st<strong>and</strong>ards that dictate the amount offire/crash equipment <strong>and</strong> staffing that must be present based on thenumber <strong>and</strong> types of aircraft stationed on-base, <strong>and</strong> the types <strong>and</strong> totalsquare footage of base structures <strong>and</strong> housing. The Gr<strong>and</strong> Forks AFB firedepartment meets these st<strong>and</strong>ards, maintaining nine trucks with bothwater <strong>and</strong> foam delivery capacities. The base currently has 62 personnelto administer <strong>and</strong> manage the program for both the flightline <strong>and</strong> thebase facilities. One centrally located facility houses the equipment forboth the flightline <strong>and</strong> the base structure fire protection needs. Thepositioning of this facility also meets the Air Force time <strong>and</strong> distancerequirements for facility response.The threats to human safety from aircraft accidents at Gr<strong>and</strong> Forks AFBare summarized in the AICUZ Report. The AICUZ guidelines are based onthe type of aircraft at the base <strong>and</strong> the nature of operations conducted.In order to minimize the risk to the public at each end of the runway, aClear Zone <strong>and</strong> two Accident Potential Zones have been designated. TheClear Zone, the area where aircraft mishaps are most likely to occur, iscontained within the base boundaries (figure 3.8-10). Other on-basesafety restrictions include ESQDs associated with the Weapons StorageArea, alert apron, <strong>and</strong> flightline area <strong>and</strong> small arms range.The base has six fixed-unit EMR sources that are monitored on aquarterly basis. The base radiation officer is responsible for the overallmanagement of the EMR program. The program involves identifying,categorizing, <strong>and</strong> surveying all radio frequency emitters on the base toensure personnel are adequately protected against unnecessary exposureto EMR (U.S. Department of the Air Force, 1997—Gr<strong>and</strong> Forks AFBGeneral Plan). Most of the EMR sources are associated with airfieldnavigational <strong>and</strong> weather radar systems.Gr<strong>and</strong> Forks AFB has a long history of transporting <strong>and</strong> h<strong>and</strong>ling missiles.The Air Force has instituted a rigorous training program for individualswho h<strong>and</strong>led the various components of the Minuteman III missiles. TheAir Force also has formal safety programs addressing missile logistics,which provide detailed safety requirements <strong>and</strong> m<strong>and</strong>atory reportingsystem for identifying <strong>and</strong> preventing safety-related problems. <strong>Missile</strong>facilities are regularly inspected to ensure compliance with safety criteria.Safety provisions are incorporated into all aspects of missile maintenance<strong>and</strong> transportation. <strong>Missile</strong> transport only occurs when weather3-250 NMD Deployment Final EIS
Index MapGr<strong>and</strong> Forks AFBRiverNorth DakotaTurtleCR 3Trap <strong>and</strong>Skeet RangeRedwood AvenueFlight Line7th Avenue6th AvenueSteenAvenueMainGateWeapons StorageAreaEielson StreetAlertApronAlert AvenueSecondary GateCR 3US 2EXPLANATIONInstallation BoundaryExplosive Safety Quantity Distance (ESQD)Runway Clear Zone BoundaryElectromagnetic Radiation Source PointsGateCR = County RoadND = U.S. HighwayExisting Health <strong>and</strong>Safety Issues, Gr<strong>and</strong>Forks Air Force BaseNORTHhs_gfafb_001Scale 1:40,0000 1,667 3,333 Feet0 508 1,016 MetersNMD Deployment Final EISNorth DakotaFigure 3.8-103-251
Chapter 3—Affected Environmentconditions are good, <strong>and</strong> then only with a high level of security. Anormal maintenance schedule involves removing between four <strong>and</strong> eightmissiles a month for servicing at Gr<strong>and</strong> Forks AFB. Prior to any missilemovement, a maintenance vehicle traveled the route to check for roadconditions. The Air Force has a long record of safe h<strong>and</strong>ling <strong>and</strong>maintenance of missiles. Approximately 804,700 kilometers (500,000miles) have been driven by transporter-erectors carrying Minutemanmissiles (I, II, <strong>and</strong> III) between the deployment bases <strong>and</strong> the launchfacilities. In roughly 30 years, only six rollover accidents have occurred,with none involving propellant ignition. The Air Force Logistic Comm<strong>and</strong>studied the potential for transporting <strong>and</strong> disposing of missile motorsfrom Malmstrom AFB, <strong>and</strong> found that no serious accident consequencesinvolving transportation of the guidance system, reentry system, <strong>and</strong> thepropulsion system rocket engine have occurred (Department of the AirForce, 1997—Gr<strong>and</strong> Forks AFB General Plan).3.8.2.3 <strong>Missile</strong> Site Radar—Health <strong>and</strong> SafetyThis section describes the health <strong>and</strong> safety concerns for the affectedbase property at the <strong>Missile</strong> Site Radar <strong>and</strong> the surrounding area. TheROI for health <strong>and</strong> safety includes the base <strong>and</strong> adjacent public that couldbe affected by the deployment of a GBI, BMC2, or XBR. The ROI for theGBI <strong>and</strong> BMC2 is the base <strong>and</strong> the adjacent base property. The ROI forEMR human health effects is also the base <strong>and</strong> adjacent property. ThisROI is based on the area where potential effects to human health areexpected to occur (out to 150 meters [492 feet]). The ROI for certainelectronic equipment <strong>and</strong> aircraft (see below) includes an area up to 350kilometers (217 miles). For a general description of the health <strong>and</strong> safetyresource area, see section 3.8.On-base SafetyDuring a 3-month period in 1975, the <strong>Missile</strong> Site Radar was an activeinstallation consisting of an operational radar <strong>and</strong> missile field of 30launchers for Spartan long-range nuclear warhead missiles <strong>and</strong> 16launchers for Sprint short-range nuclear missiles. During operations, nomissile accidents occurred. All operational systems have been removedfrom the site. Associated with the deployment of this system, restrictivesafety easements were obtained with surrounding property owners tolimit future development. These easements are currently active. The<strong>Missile</strong> Site Radar is currently inactive, <strong>and</strong> access to the site is restrictedto authorized personnel for occasional facility maintenance. The basemaintenance contractor maintains a health <strong>and</strong> safety plan, whichaddresses worker safety in accordance with the Occupational Safety <strong>and</strong>Health Administration (OSHA) (Wheeler Contracting, Inc., 1996—Safety<strong>and</strong> Health Plan for the SRMSC). Because no activities occur at the site,there are no public health <strong>and</strong> safety issues to adjacent properties. Toassist in emergency response at the site, mutual aid agreements are3-252 NMD Deployment Final EIS
Chapter 3—Affected Environmentmaintained with the fire departments in the towns of Langdon <strong>and</strong>Nekoma. The mutual aid agreements allow access by the firedepartments to the site for responding to fires or accident/injuryassistance (U.S. Army Space <strong>and</strong> Strategic <strong>Defense</strong> Comm<strong>and</strong>, 1994—Memor<strong>and</strong>um of Agreement between Langdon, North Dakota Fire District<strong>and</strong> U.S. Army Space <strong>and</strong> Strategic <strong>Defense</strong> Comm<strong>and</strong>; Memor<strong>and</strong>um ofAgreement between Nekoma North Dakota Fire District <strong>and</strong> U.S. ArmySpace <strong>and</strong> Strategic <strong>Defense</strong> Comm<strong>and</strong>).Electromagnetic Radiation EnvironmentFor purposes of this study, the electromagnetic environment around the<strong>Missile</strong> Site Radar includes all ground-based systems within a 30-kilometer (19-mile) radius for out-of-b<strong>and</strong> systems <strong>and</strong> within a 350-kilometer (217-mile) radius for in-b<strong>and</strong>, adjacent b<strong>and</strong>, <strong>and</strong> harmonicallyrelated b<strong>and</strong>s. The out-of-b<strong>and</strong> communications-electronics environmentaround the <strong>Missile</strong> Site Radar was found to include 204 systems rangingin frequencies from 43 to 24,150 megahertz. The distribution of thesesystems over the electromagnetic spectrum, VHF–K-B<strong>and</strong>, is shown insection 3.8.2.1, figure 3.8-9. These systems were categorized intopotential sensitive receptors of frequency-related interference or nonfrequencyrelated interference.Communications–Electronics Frequency Related Interference. Theexisting ground-based communications-electronics environment aroundthe <strong>Missile</strong> Site Radar includes two in-b<strong>and</strong> systems: a precisionapproach radar in Minot, North Dakota, <strong>and</strong> a weather radar in ParkRapids, Minnesota. The airborne electromagnetic environment includesthree types of in-b<strong>and</strong> systems: fire control, bomb/navigation, <strong>and</strong>weather radars. Weather radars are utilized on both civilian <strong>and</strong> militaryaircraft. Section 3.3.2.1 provides an overview of the airspace <strong>and</strong>airports in the <strong>Missile</strong> Site Radar ROI.Communications–Electronics Non-frequency Related Interference. Theout-of-b<strong>and</strong> electromagnetic environment (within 30 kilometers [19 miles])at the <strong>Missile</strong> Site Radar included 204 ground-based systems. Themajority of the systems (191 systems) are l<strong>and</strong>-mobile UHF <strong>and</strong> VHFradios. Also included are one FM radio station, one air navigation beacon,five pager/cellular phone towers, five satellite communications systems,<strong>and</strong> one speed gun. Although no airborne systems are registered with theNTIA or FCC for this area, it is anticipated that various avionics equipment(tactical air navigation, IFF systems, glideslopes, beacons, etc.) will bepresent as aircraft travel in <strong>and</strong> out of the area.Radiation Hazards. Based upon the absence of high-power emitterswithin a 30-kilometer (19-mile) radius of the <strong>Missile</strong> Site Radar, theexisting electromagnetic environment does not present substantial levelsof radiation hazards to personnel, electroexplosive devices, or fuels.NMD Deployment Final EIS 3-253
Chapter 3—Affected Environment3.8.2.4 Remote Sprint Launch Site 1—Health <strong>and</strong> SafetyThis section describes the health <strong>and</strong> safety concerns for the affectedbase property at Remote Sprint Launch Site 1 <strong>and</strong> the surrounding area.The ROI for health <strong>and</strong> safety includes the base <strong>and</strong> adjacent public thatcould be affected by the deployment of an XBR. The ROI for EMR humanhealth effects is the base <strong>and</strong> adjacent property. This ROI is based onthe area where potential effects to human health are expected to occur(out to 150 meters [492 feet]). The ROI for certain electronic equipment<strong>and</strong> aircraft (see below) includes an area up to 350 kilometers (217miles). For a general description of the health <strong>and</strong> safety resource area,see section 3.8.On-base SafetyDuring a 3-month period in 1975, Remote Sprint Launch Site 1 wasactive <strong>and</strong> consisted of 12 launch stations. During operation, no missileaccidents occurred. Remote Sprint Launch Site 1 is currently inactive,access to the site is restricted to authorized personnel for occasionalfacility maintenance. The base maintenance contractor maintains ahealth <strong>and</strong> safety plan, which addresses worker safety in accordancewith OSHA (Wheeler Contracting, Inc., 1996—Safety <strong>and</strong> Health Plan forthe SRMSC). Because no activities occur at the site, there are no publichealth <strong>and</strong> safety issues to adjacent properties.Electromagnetic Radiation EnvironmentFor purposes of this study, the electromagnetic environment aroundRemote Sprint Launch Site 1 includes all ground-based systems within a30-kilometer (19-mile) radius for out-of-b<strong>and</strong> systems <strong>and</strong> within a 350-kilometer (217-mile) radius for in-b<strong>and</strong>, adjacent b<strong>and</strong>, <strong>and</strong> harmonicallyrelatedb<strong>and</strong>s. The out-of-b<strong>and</strong> communications-electronics environmentaround Remote Sprint Launch Site 1 was found to include 198 systemsranging in frequencies from 43 to 12,290 megahertz. The distribution ofthese systems over the electromagnetic spectrum, VHF–K-B<strong>and</strong>, isshown in section 3.8.2.1, figure 3.8-9. These systems were categorizedinto potential victims of frequency-related interference or non-frequencyrelated interference.Communications–Electronics Frequency Related Interference. Theexisting ground-based communications-electronics environment aroundRemote Sprint Launch Site 1 includes two in-b<strong>and</strong> systems: a precisionapproach radar in Minot, North Dakota, <strong>and</strong> a weather radar in ParkRapids, Minnesota. The airborne electromagnetic environment includesthree types of in-b<strong>and</strong> systems: fire control, bomb/navigation, <strong>and</strong>weather radars. Weather radars are utilized on both civilian <strong>and</strong> militaryaircraft. Section 3.3.2.1 provides an overview of the airspace <strong>and</strong>airports in the Remote Sprint Launch Site 1 ROI.3-254 NMD Deployment Final EIS
Chapter 3—Affected EnvironmentCommunications–Electronics Non-frequency Related Interference. Theout-of-b<strong>and</strong> electromagnetic environment (within 30 kilometers [19miles]) at Remote Sprint Launch Site 1 included 198 ground-basedsystems. The majority of the systems (184 systems) are l<strong>and</strong>-mobileUHF <strong>and</strong> VHF radios. Also included are five satellite communicationssystems, one fixed broadcasting satellite, <strong>and</strong> eight pager/cellular phonetowers. Although no airborne systems are registered with the NTIA orFCC for this area, it is anticipated that various avionics equipment(tactical air navigation, IFF systems, glideslopes, beacons, etc.) will bepresent as aircraft travel in <strong>and</strong> out of the area.Radiation Hazards. Based upon the absence of high-power emitterswithin a 30-kilometer (19-mile) radius of Remote Sprint Launch Site 1,the existing electromagnetic environment does not present substantiallevels of radiation hazards to personnel, electroexplosive devices, orfuels.3.8.2.5 Remote Sprint Launch Site 2—Health <strong>and</strong> SafetyThis section describes the health <strong>and</strong> safety concerns for the affectedbase property at Remote Sprint Launch Site 2 <strong>and</strong> the surrounding area.The ROI for health <strong>and</strong> safety includes the base <strong>and</strong> adjacent public thatcould be affected by the deployment of an XBR. The ROI for EMR humanhealth effects is the base <strong>and</strong> adjacent property. This ROI is based onthe area where potential effects to human health are expected to occur(out to 150 meters [492 feet]). The ROI for certain electronic equipment<strong>and</strong> aircraft (see below) includes an area up to 350 kilometers (217miles). For a general description of the health <strong>and</strong> safety resource area,see section 3.8.On-base SafetyOn-base safety for Remote Sprint Launch Site 2 is similar to thatdescribed for Remote Sprint Launch Site 1.Electromagnetic Radiation EnvironmentFor purposes of this study, the electromagnetic environment aroundRemote Sprint Launch Site 2 includes all ground-based systems within a30-kilometer (19-mile) radius for out-of-b<strong>and</strong> systems <strong>and</strong> within a 350-kilometer (217-mile) radius for in-b<strong>and</strong>, adjacent b<strong>and</strong>, <strong>and</strong> harmonicallyrelatedb<strong>and</strong>s. The communications-electronics environment aroundRemote Sprint Launch Site 2 was found to include 152 systems rangingin frequencies from 31 to 24,150 megahertz. The distribution of thesesystems over the electromagnetic spectrum, VHF–K-B<strong>and</strong>, is shown insection 3.8.2.1, figure 3.8-9. These systems were categorized intopotential victims of frequency-related interference or non-frequencyrelated interference.NMD Deployment Final EIS 3-255
Chapter 3—Affected EnvironmentCommunications–Electronics Frequency Related Interference. Theexisting ground-based communications-electronics environment aroundRemote Sprint Launch Site 2 includes two in-b<strong>and</strong> systems: a precisionapproach radar in Minot, North Dakota, <strong>and</strong> a weather radar in ParkRapids, Minnesota. The airborne electromagnetic environment includesthree types of in-b<strong>and</strong> systems: fire control, bomb/navigation, <strong>and</strong>weather radars. Weather radars are utilized on both civilian <strong>and</strong> militaryaircraft. Section 3.3.2.1 provides an overview of the airspace <strong>and</strong>airports in the Remote Sprint Launch Site 2 ROI.Communications–Electronics Non-frequency Related Interference. Theout-of-b<strong>and</strong> electromagnetic environment (within 30 kilometers [19miles]) at Remote Sprint Launch Site 2 includes 152 ground-basedsystems. The majority of the systems (142 systems) are l<strong>and</strong>-mobileUHF <strong>and</strong> VHF radios. Also included are one air navigational aid, onespeed gun, six pager/cellular phone towers, one satellite communicationssystem, <strong>and</strong> one fixed broadcasting satellite. Although no airbornesystems are registered with the NTIA or FCC for this area, it isanticipated that various avionics equipment (tactical air navigation, IFFsystems, glideslopes, beacons, etc.) will be present as aircraft travel in<strong>and</strong> out of the area.Radiation Hazards. Based upon the absence of high-power emitterswithin a 30-kilometer (19-mile) radius of Remote Sprint Launch Site 2,the existing electromagnetic environment does not present substantiallevels of radiation hazards to personnel, electroexplosive devices, orfuels.3.8.2.6 Remote Sprint Launch Site 4—Health <strong>and</strong> SafetyThis section describes the health <strong>and</strong> safety concerns for the affectedbase property at Remote Sprint Launch Site 4 <strong>and</strong> the surrounding area.The ROI for health <strong>and</strong> safety includes the base <strong>and</strong> adjacent public thatcould be affected by the deployment of an XBR. The ROI for EMR humanhealth effects is the base <strong>and</strong> adjacent property. This ROI is based onthe area where potential effects to human health are expected to occur(out to 150 meters [492 feet]). The ROI for certain electronic equipment<strong>and</strong> aircraft (see below) includes an area up to 350 kilometers (217miles). For a general description of the health <strong>and</strong> safety resource area,see section 3.8.On-base SafetyOn-base safety for Remote Sprint Launch Site 4 is similar to thatdescribed for Remote Sprint Launch Site 1.3-256 NMD Deployment Final EIS
Chapter 3—Affected EnvironmentElectromagnetic Radiation EnvironmentFor purposes of this study, the electromagnetic environment aroundRemote Sprint Launch Site 4 includes all ground-based systems within a30-kilometer (19-mile) radius for out-of-b<strong>and</strong> systems <strong>and</strong> within a 350-kilometer (217-mile) radius for in-b<strong>and</strong>, adjacent b<strong>and</strong>, <strong>and</strong> harmonicallyrelatedb<strong>and</strong>s. The communications-electronics environment aroundRemote Sprint Launch Site 4 was found to include 132 systems rangingin frequencies from 43 to 24,150 megahertz. The distribution of thesesystems over the electromagnetic spectrum, VHF–K-B<strong>and</strong>, is shown insection 3.8.2.1, figure 3.8-9. These systems were categorized intopotential victims of frequency-related interference or non-frequencyrelated interference.Communications-Electronics Frequency Related Interference. Theexisting ground-based communications-electronics environment aroundRemote Sprint Launch Site 4 includes two in-b<strong>and</strong> systems: a precisionapproach radar in Minot, North Dakota, <strong>and</strong> a weather radar in ParkRapids, Minnesota. The airborne electromagnetic environment includesthree types of in-b<strong>and</strong> systems: fire control, bomb/navigation, <strong>and</strong>weather radars. Weather radars are utilized on both civilian <strong>and</strong> militaryaircraft. Section 3.3.2.1 provides an overview of the airspace <strong>and</strong>airports in the Remote Sprint Launch Site 4 ROI.Communications–Electronics Non-frequency Related Interference. Theout-of-b<strong>and</strong> electromagnetic environment (within 30 kilometers [19miles]) at Remote Sprint Launch Site 4 includes 132 ground-basedsystems. The majority of the systems (112 systems) are l<strong>and</strong>-mobileUHF <strong>and</strong> VHF radios. Also included are one speed gun, twelve satellitecommunications systems, <strong>and</strong> seven pager/cellular phone towers.Although no airborne systems are registered with the NTIA or FCC forthis area, it is anticipated that various avionics equipment (tactical airnavigation, IFF systems, glideslopes, beacons, etc.) will be present asaircraft travel in <strong>and</strong> out of the area.Radiation Hazards. Based upon the absence of high-power emitterswithin a 30-kilometer (19-mile) radius of Remote Sprint Launch Site 4,the existing electromagnetic environment does not present substantiallevels of radiation hazards to personnel, electroexplosive devices, orfuels.NMD Deployment Final EIS 3-257
Chapter 3—Affected Environment3.9 LAND USE AND AESTHETICSL<strong>and</strong> use can be defined as the human use of l<strong>and</strong> resources for variouspurposes including economic production, natural resources protection, orinstitutional uses. L<strong>and</strong> uses are frequently regulated by managementplans, policies, ordinances, <strong>and</strong> regulations that determine the types ofuses that are allowable or protect specially designated or environmentallysensitive uses. Potential issues typically stem from encroachment of onel<strong>and</strong> use or activity on another, or an incompatibility between adjacentl<strong>and</strong> uses that leads to encroachment.Visual resources include the natural <strong>and</strong> man-made features that give aparticular environment its aesthetic quality. The analysis considers visualresource sensitivity, which is the degree of public interest in a visualresource <strong>and</strong> concern over adverse changes in the quality of theresource.3.9.1 ALASKA INSTALLATIONSThis brief introduction is provided to describe the l<strong>and</strong> uses in thepotentially affected areas in the Alaska region. Almost all of the l<strong>and</strong>within the ROIs is relatively undisturbed <strong>and</strong> is very sparsely populated.With the exception of the Yukon Training Area <strong>and</strong> Eielson AFB in theFairbanks North Star Borough, there are virtually no forms ofcomprehensive zoning. The controls that do exist are fairly lenient. Allof the potential sites are located on Federal l<strong>and</strong> <strong>and</strong> are not subject tolocal l<strong>and</strong> use controls, but do try to be consistent with the regulationsthat do exist to avoid conflict.3.9.1.1 Clear AFS—L<strong>and</strong> UseThis section describes the l<strong>and</strong> uses <strong>and</strong> aesthetics for the affected baseproperty at Clear AFS. The ROI for l<strong>and</strong> use includes those areaspotentially affected by deployment of the GBI or BMC2 at Clear AFS.This area includes the base <strong>and</strong> areas immediately adjacent to the base.The ROI for aesthetics includes the base <strong>and</strong> adjacent areas within theviewshed.Regional L<strong>and</strong> UseClear AFS is located in Interior Alaska in the northeast corner of theDenali Borough. The regional l<strong>and</strong> use ROI includes the installationproperty <strong>and</strong> surrounding adjacent l<strong>and</strong> uses.The Denali Borough is the zoning <strong>and</strong> development authority in theregion. However, almost the entire zone is virtually zoned as unrestricteduse, which allows almost any type of development unless individualcommunities vote to have further zoning or l<strong>and</strong> use regulations (Denali3-258 NMD Deployment Final EIS
Chapter 3—Affected EnvironmentBorough, 1997—Denali Borough Comprehensive L<strong>and</strong> Use Plan). SinceClear AFS is a Federal property, it does not fall under the jurisdiction ofthe local planning authorities. The area around Clear AFS is sparselypopulated <strong>and</strong> consists of undisturbed forestl<strong>and</strong>. The nearest inhabitedstructure is just to the south of the base, <strong>and</strong> the community ofAnderson is 8 kilometers (5 miles) to the north (U.S. Department of theInterior, 1998—Northern Intertie Project, Final EIS). The city of Andersonoperates a small airport on the adjacent property to the west. None ofthe l<strong>and</strong> uses in the area are incompatible with adjoining l<strong>and</strong> uses ofClear AFS.Clear AFS L<strong>and</strong> UseClear AFS consists of 4,670 hectares (11,542 acres) with approximately142 hectares (350 acres) of the installation being developed <strong>and</strong> theremainder being mostly forested l<strong>and</strong> that is relatively undisturbed. Ofthe total acreage at Clear AFS, 4,666 hectares (11,530 acres) arewithdrawn from the public domain from the Department of the Interior,Bureau of L<strong>and</strong> Management, <strong>and</strong> 4.7 hectares (11.5 acres) are byeasement from the State of Alaska (Gori, 1999—Comments received byEDAW, Inc., regarding NMD Deployment Coordinating Draft DEIS)The mission facilities of Clear AFS are divided into three main areas <strong>and</strong>are centrally located on the installation as shown in figure 3.9-1. TheComposite Area contains the headquarters, housing, recreation,community service, <strong>and</strong> administrative facilities <strong>and</strong> is just inside themain gate to the north. The Technical Site (also known as theOperations Area) is located to west of the Composite Area <strong>and</strong> containsthe Ballistic <strong>Missile</strong> Early Warning System radar <strong>and</strong> related equipment aswell as the power plant. Just north of the Technical Site is theconstruction site of the Solid State Phased-Array Radar that is to replacethe existing Ballistic <strong>Missile</strong> Early Warning System radar. The new SolidState Phased-Array Radar will affect less than 2 hectares (5 acres) (U.S.Department of the Air Force, 1997—EA for Radar Upgrade at Clear AS).The third area is the Camp Area, which is located to the south of theComposite Area. This area is composed of civil engineering maintenanceshops, security police offices, a fire station, <strong>and</strong> transient lodging. Theremainder of the installation is open space consisting of mostlyundisturbed forest that is at times used by military personnel forrecreation activities <strong>and</strong> hunting. (Clear AS, 1993—ComprehensivePlanning Framework)The base is used by the stationed personnel for various recreationalactivities. Hunting <strong>and</strong> fishing are the most common activities. There isalso hiking, cross-country skiing, running, picnicking, snowshoeing,snowmobiling, <strong>and</strong> off-road vehicle use. Use is limited to militarypersonnel, <strong>and</strong> there is no subsistence hunting or fishing occurring onbase.NMD Deployment Final EIS 3-259
Index MapAnderson RoadClear AFSAlaska103Nenana RiverLake SansingProposedPhased-ArrayRadar83CoolingPondTech Site3CampSiteComposite Area87Clear Airport1Radio RelayStationRunwayClearanceZones3310Clear Air Force StationAlaska RailroadParks Highway710EXPLANATION1 Airfield2 Aviation Support*3 Industrial4 Institutional (Medical/Educational)*5 AdministrativeNORTHlu_clas_0023-260Scale0 2,368 4,735 Feet678100 722 1,443 Meters9Commercial*ResidentialRecreationAgriculture*Open SpaceWater AreaRoadsInstallation BoundaryRailroadsBallistic <strong>Missile</strong> SystemRadar Control Zone*St<strong>and</strong>ard l<strong>and</strong> use designationnot applicable to this figureNMD Deployment Final EISExisting L<strong>and</strong> Use,Clear Air Force StationAlaskaFigure 3.9-1
Chapter 3—Affected EnvironmentAestheticsThe ROI for aesthetics at Clear AFS includes the general visualenvironment surrounding the station <strong>and</strong> areas visible from offsitelocations.The visual environment of Clear AFS is characterized by the relatively flatterrain that primarily consists of undisturbed forests, woodl<strong>and</strong>s, <strong>and</strong>meadows. The topography is generally flat, with the elevation of ClearAFS ranging from about 165 meters (540 feet) in the northern portion toabout 198 meters (650 feet) above sea level in the southern portion ofbase (U.S. Department of the Air Force, 1997—EA for Radar Upgrade atClear AS). The most significant man-made features are the Ballistic<strong>Missile</strong> Early Warning System radar <strong>and</strong> the Tracking Radar. The threeBallistic <strong>Missile</strong> Early Warning System radars are approximately 50meters (165 feet) tall. The Tracking Radar, which is dome-shaped, isapproximately 43 meters (140 feet) in diameter. The Ballistic <strong>Missile</strong>Early Warning System radar is not visible from surrounding highways orrecreation areas because of the flatness of the l<strong>and</strong> <strong>and</strong> the heavy forestcover; thus, the site <strong>and</strong> surrounding area have a low visual sensitivity.(U.S. Department of the Air Force, 1997—Supplemental EA for RadarUpgrade, Clear AS)3.9.1.2 Eareckson AS—L<strong>and</strong> UseThis section describes the l<strong>and</strong> uses <strong>and</strong> aesthetics for the affected baseproperty at Eareckson AS. The ROI for l<strong>and</strong> use includes those areaspotentially affected by deployment of the XBR at this site. This areaincludes the base <strong>and</strong> areas up to 30 kilometers (19 miles) from the siteto include areas where certain sensitive electronics may be susceptible totemporary interference by use of the XBR. The ROI for aestheticsincludes the base <strong>and</strong> adjacent areas within the viewshed.Regional L<strong>and</strong> UseEareckson AS is located on Shemya Isl<strong>and</strong> near the end of the AleutianIsl<strong>and</strong> chain. The regional l<strong>and</strong> use ROI includes the area within a 30-kilometer (19-mile) radius from the Eareckson AS site in the AleutiansWest Census Area.The Aleutians West Census Area is unincorporated <strong>and</strong> has no officialzoning ordinances. However, all development will require review forconsistency with the st<strong>and</strong>ards of the Alaska Coastal ManagementProgram. See the Coastal Zone Management section below for furtherdetails.NMD Deployment Final EIS 3-261
Chapter 3—Affected EnvironmentThe area around Shemya is virtually all open ocean, with the uninhabitedisl<strong>and</strong>s of Nizki about 3 kilometers (2 miles) to the west <strong>and</strong> Alaid 8kilometers (5 miles) to the west on the other side of Nizki. All of the l<strong>and</strong>uses in the area are compatible with the adjoining areas of Eareckson AS.Eareckson AS L<strong>and</strong> UseEareckson AS consists of 1,425 hectares (3,520 acres), which is theentire isl<strong>and</strong> of Shemya. The isl<strong>and</strong> is located wholly within the AlaskaMaritime National Wildlife Refuge (U.S. Department of the Air Force,1997—Final Installation-Wide Environmental Baseline Survey, EarecksonAS). The Alaska Maritime National Wildlife Refuge is administered by theUSFWS. The purposes of the Alaska Maritime National Wildlife Refugeinclude (1) conserving wildlife <strong>and</strong> wildlife habitat in their naturaldiversity, (2) fulfilling international treaty obligations of the United Stateswith respect to fish <strong>and</strong> wildlife, (3) providing for a subsistenceopportunity by local residents, (4) providing a national <strong>and</strong> internationalprogram of scientific research on marine resources, <strong>and</strong> (5) ensuringwater quality <strong>and</strong> quantity within the refuge.The southern portion of the air station is dominated by an airfield <strong>and</strong>airfield support, which consists of support buildings <strong>and</strong> one activerunway. Administrative buildings are scattered throughout the northernportion of the station. Housing is in the north central section of the base,<strong>and</strong> community <strong>and</strong> service facilities are in close proximity to the housing<strong>and</strong> administrative facilities. Industrial sites are scattered throughout theair station, with the remainder of the l<strong>and</strong> being open space. These l<strong>and</strong>uses are shown in figure 3.9-2. Facilities associated with the airfield, theCOBRA DANE Radar, <strong>and</strong> some housing <strong>and</strong> administrativeaccommodations are all of the facilities that are currently in use. Theremainder of the facilities is currently inactive.Coastal Zone ManagementAll of the communities within the Aleutians West Coastal ResourceService Area (AWCRSA) are coastal, <strong>and</strong> essentially all developable l<strong>and</strong>within the AWCRSA is located in the "zone of direct influence" of thecoastal environment. All major development in the AWCRSA will requirereview for consistency with the st<strong>and</strong>ards of the Alaska CoastalManagement Program <strong>and</strong> the policies of the AWCRSA coastal program.(Aleutians West Coastal Resource Service Area, 1991—CoastalManagement Plan)3-262 NMD Deployment Final EIS
Index MapEarecksonASAlaskaShemya Pass33Bering Sea8723RUNWAY "C" - Ab<strong>and</strong>oned3RUNWAY "B" - Ab<strong>and</strong>oned35331035331210,000' RUNWAY - Active3210FoxBeach3Pacific OceanEXPLANATION1 Airfield2 Aviation Support3 Industrial4 Institutional (Medical/Educational)*5 AdministrativeNORTHlu_eas_002Scale0 1,738 3,475 feet0 530 1,059 meters678910Commercial*ResidentialRecreationAgriculture*Open Space11Military*Water Area*St<strong>and</strong>ard l<strong>and</strong> use designationnot applicable to this figureNMD Deployment Final EISExisting L<strong>and</strong> Use,Eareckson Air StationAlaskaFigure 3.9-23-263
Chapter 3—Affected EnvironmentFederal l<strong>and</strong>s are excluded from Alaska's coastal zone boundaries.Activities on these l<strong>and</strong>s do, however, require preparation of a CoastalZone Consistency Determination in accordance with the Coastal ZoneManagement Act of 1972. Any activities on Federal l<strong>and</strong>s <strong>and</strong> watersthat affect any l<strong>and</strong> or water use or natural resource of the AWCRSAcoastal zone must be consistent, to the maximum extent practicable,with the enforceable policies of the AWCRSA coastal managementprogram. (Aleutians West Coastal Resource Service Area, 1991—CoastalManagement Plan)AestheticsThe ROI for aesthetics at Eareckson AS includes the general visualenvironment surrounding the station <strong>and</strong> areas visible from offsitelocations.The visual environment is characterized by Shemya Isl<strong>and</strong>'s presence in abroad span of open ocean. The topography of the isl<strong>and</strong> is gently rolling,with elevations at sea level on the southern or Pacific side <strong>and</strong> slopingupward to 73 meters (240 feet) on the north or Bering Sea side (U.S.Department of the Air Force, 1997—Final Installation-Wide EnvironmentalBaseline Survey, Eareckson AS). The visual environment on-base is fairlydeveloped <strong>and</strong> typical of a military installation with a mixture of airfields,housing, industrial, <strong>and</strong> administrative facilities. Since access toEareckson AS is restricted, <strong>and</strong> due to the remoteness of the isl<strong>and</strong>,viewpoints are extremely limited. This limits views to occasional aircraft<strong>and</strong> boat traffic. Overall, the station has a very low visual sensitivity.3.9.1.3 Eielson AFB—L<strong>and</strong> UseThis section describes the l<strong>and</strong> uses <strong>and</strong> aesthetics for Eielson AFB <strong>and</strong>adjacent property. The ROI for l<strong>and</strong> use includes those areas potentiallyaffected by the use of facilities <strong>and</strong> infrastructure at Eielson AFB for thedeployment of GBI or BMC2 on the Yukon Training Area just outside theEielson base boundary. The ROI for aesthetics includes the base <strong>and</strong> thesurrounding areas in the viewshed.Regional L<strong>and</strong> UseEielson AFB is southeast of Fairbanks in the Fairbanks North StarBorough. The regional l<strong>and</strong> use ROI for Eielson AFB includes the base<strong>and</strong> the adjacent surrounding l<strong>and</strong> uses.3-264 NMD Deployment Final EIS
Chapter 3—Affected EnvironmentThe Fairbanks North Star Borough provides the framework for thecommunity to make l<strong>and</strong> use <strong>and</strong> future development decisions. Planningwithin the base boundary is not under the borough's jurisdiction becauseit is Federal property; however, coordination between the base <strong>and</strong>borough often occurs. This coordination helps to prevent l<strong>and</strong> use <strong>and</strong>noise conflicts between the base <strong>and</strong> surrounding communities. EielsonAFB is located in a relatively undeveloped, sparsely populated area. Twocommunities are located in close proximity to the base. The communityof Moose Creek abuts the northwest boundary of Eielson AFB, consistingof residential <strong>and</strong> commercial l<strong>and</strong> uses. The community of Salcha islocated a few miles south of the base with residential areas with adensity of less than one unit per acre (U.S. Department of the Air Force,1992—AICUZ Study, Eielson AFB). A mixture of commercial, lightindustrial, <strong>and</strong> residential areas has been developed along the RichardsonHighway, between the base <strong>and</strong> the North Pole. The remainder of thebase is surrounded on the north, east, <strong>and</strong> west by undeveloped militaryreservation l<strong>and</strong>. There have been no conflicts with the surrounding l<strong>and</strong>uses, <strong>and</strong> the only incompatible l<strong>and</strong> uses exist northwest of Eielson AFBin the community of Moose Creek <strong>and</strong> along the Richardson Highwaythat runs through the base parallel to the runways. Moose Creekcurrently has some residential <strong>and</strong> commercial uses within the AccidentPotential Zone at the end of Runway 13. Also, parts of the RichardsonHighway fall into the Clear Zones <strong>and</strong> the Accident Potential Zones ofrunways 13 <strong>and</strong> 31 (U.S. Department of the Air Force, 1992—AICUZStudy, Eielson AFB).Eielson AFB L<strong>and</strong> UseEielson AFB main base encompasses approximately 8,021 hectares(19,820 acres) (Gori, 1999—Comments received by EDAW, Inc.,regarding the NMD Deployment Coordinating Draft DEIS). It managesanother 15,098 hectares (37,309 acres) at four other offsite locations.The l<strong>and</strong> uses at Eielson AFB consist of the airfield, airfield operations,industrial, administration, community facilities, medical facilities, housing,recreational, <strong>and</strong> open space areas, as depicted in figure 3.9-3.The airfield l<strong>and</strong> use is the dominant l<strong>and</strong> use category on the base, <strong>and</strong>consists of the runway, taxiways, <strong>and</strong> parking/maintenance/armingaprons. Airfield operations are located adjacent to the airfield to the eastalong Flightline Avenue <strong>and</strong> essentially coexist with the airfieldoperations. The main industrial area is located in the central section ofthe base just west of the airfield operations area. Other industrial areasare scattered in the eastern section of the base <strong>and</strong> on Engineer Hill.NMD Deployment Final EIS 3-265
Index MapEielsonAFB103The Alaska RailroadRichardson Highway73Transmitter Rd.11Alaska3Manchu Trail108121865724438312Quarry Rd.1221283Tanana River11 1011EXPLANATION1 Airfield2 Aviation Support3 Industrial4 Institutional (Medical/Educational)5 AdministrativeNORTHlu_eafb_0023-266Scale0 .8 1.6 Miles0 1.25 2.5 Kilometers678910CommercialResidentialRecreationAgriculture*Open Space1112MilitaryTraining AreaWater AreaRoadsRailroadsInstallation BoundaryBuilding*St<strong>and</strong>ard l<strong>and</strong> use designationnot applicable to this figureNMD Deployment Final EISExisting L<strong>and</strong> Use,Eielson Air Force BaseAlaskaFigure 3.9-3
Chapter 3—Affected EnvironmentAdministration facilities are located in the central section of the maincantonment area between Central Avenue <strong>and</strong> Flightline Avenue.Housing l<strong>and</strong> use areas are located in the northeast portion of thecantonment area. Community facilities are situated between theadministrative areas <strong>and</strong> the housing. Medical facilities are just to thesouth of the Community Area. Outdoor recreation is scatteredthroughout the remainder of the base. The rest of the base is made up ofopen space, with portions of the open space being used for trainingactivities. (Pacific Air Forces, 1998—Draft General Plan, Eielson AFB)Eielson AFB is used by military personnel <strong>and</strong> the general public forvarious recreational activities. These activities include hunting, fishing,trapping, camping, picnicking, jogging, cycling, cross-country skiing, dogmushing,snowmobiling, archery, <strong>and</strong> firing ranges. Some facilities <strong>and</strong>recreation areas on-base are governed by Air Force Instruction 34-101,Service Programs <strong>and</strong> Use Eligibility, <strong>and</strong> are limited to military personnel,retired military, DOD civilians, <strong>and</strong> their bona fide guests.AestheticsThe aesthetics ROI for Eielson AFB includes the general visualenvironment surrounding the base <strong>and</strong> areas visible from offsite locations.The visual environment around Eielson AFB is characterized by therelatively flat wetl<strong>and</strong>s-type terrain that is dominant in the area. Theairfield <strong>and</strong> supporting facilities are the prominent man-made features onEielson. Approximately 89 percent of the base is flat alluvial floodplainwith elevations ranging from 158 meters (520 feet) to 168 meters (550feet). The remaining 11 percent of the base consists of rolling hills withelevations up to 343 meters (1,125 feet) (Eielson Air Force Base, 1998—Integrated Natural Resources Management Plan). Parts of Eielson AFBare visible from the Richardson Highway, which bisects the base justsouthwest of the airfield, <strong>and</strong> from the community of Moose Creek. Theremainder of the base provides very limited views due to the flatness ofthe l<strong>and</strong>, restricted access, <strong>and</strong> dense vegetation. The character of thebase is typical of most military installations, <strong>and</strong> because the terrain isrelatively flat it does not provide for any prominent vistas; therefore,Eielson AFB has a relatively low visual sensitivity.NMD Deployment Final EIS 3-267
Chapter 3—Affected Environment3.9.1.4 Fort Greely—L<strong>and</strong> UseThis section gives a description of the l<strong>and</strong> uses <strong>and</strong> aesthetics for theaffected base property at Fort Greely <strong>and</strong> the adjacent property. The ROIfor l<strong>and</strong> uses includes those areas potentially affected by deployment ofthe GBI or BMC2 at Fort Greely. The ROI for aesthetics includes the base<strong>and</strong> the surrounding areas in the viewshed.Regional L<strong>and</strong> UseFort Greely is located southeast of Fairbanks <strong>and</strong> just south of thecommunity of Delta Junction in an unincorporated borough. The ROI forl<strong>and</strong> use includes all of Fort Greely <strong>and</strong> the surrounding adjacent l<strong>and</strong>uses.Since the post is not located in a municipality or a borough, there are nolocal zoning or l<strong>and</strong> use policies. There are also no state plans orguidelines for the area. Therefore, existing l<strong>and</strong> uses do not conflict withany Federal, state, or local l<strong>and</strong> use plans or policies. The l<strong>and</strong> aroundFort Greely is primarily agricultural, undeveloped open space, forests,tundra, or wetl<strong>and</strong>s <strong>and</strong> is sparsely populated, with the closest inhabitedstructure being in Delta Junction. Most development occurs on theRichardson Highway north towards Fairbanks, <strong>and</strong> some smallsettlements are found along the highways at Big Delta, Richardson,Alrich, <strong>and</strong> Birch Lake. The Trans-Alaskan Oil Pipeline does bisect FortGreely, with a pumping station located 4 kilometers (2.5 miles)southwest of the cantonment area. There is also a large private tract ofl<strong>and</strong> that separates the maneuver area <strong>and</strong> the drop zone area of FortGreely. This 65-hectare (160-acre) tract was excluded from the areaoriginally withdrawn. No l<strong>and</strong> uses in the area are incompatible with theadjoining l<strong>and</strong> uses of Fort Greely. (U.S. Army Alaska, 1997— DraftIntegrated Natural Resources Management Plan)Fort Greely L<strong>and</strong> UseFort Greely consists of about 267,519 hectares (661,051 acres), most ofwhich was withdrawn l<strong>and</strong> from the Bureau of L<strong>and</strong> Management bypublic l<strong>and</strong> order or public law. The l<strong>and</strong> uses of Fort Greely are shownin figure 3.9-4. Fort Greely consists of the Main Post, two large trainingareas (Fort Greely West Training Area <strong>and</strong> Fort Greely East TrainingArea), <strong>and</strong> three outlying sites in the area, Gerstle River Test Site (7,689hectares, 19,000 acres), Black Rapids Training Site (1,125 hectares,2,779 acres), <strong>and</strong> Whistler Creek Rock Climbing Area (214 hectares, 530acres). (U.S. Army Alaska, 1997—Draft Integrated Natural ResourcesManagement Plan)3-268 NMD Deployment Final EIS
Little Delta RiverIndex MapFt. GreelyRichardson HighwayDelta CreekAlaskaDelta Creek AssaultL<strong>and</strong>ing StripTanana RiverDelta River710SullivanAir StripCantonment Area6Delta JunctionAllen Army AirfieldBuffalo Drop Zone1Alaska Highway1110Eddy Drop Zone111Main PostButch Drop ZoneBennet Air StripDonnellyAssault Airfield/Drop ZoneFox Drop ZoneBear Drop ZoneDelta RiverRichardson HighwayJarvis Creek10EXPLANATION1Roads <strong>and</strong> Major Trails2RiversInstallation Boundary3Trans-Alaska Pipeline 4Cantonment Area 5Main Post BoundaryCity6Scale 1:500,000 70 4 7.9 MilesNORTHlu_fge_0020 6.4 12.7 KilometersAirfieldAviation Support*Industrial*Institutional*Administrative*CommercialResidential891011Recreation*Agriculture*Open SpaceMilitaryDrop ZoneHazard AreaImpact Area*St<strong>and</strong>ard l<strong>and</strong> use designationnot applicable to this figureNMD Deployment Final EISExisting L<strong>and</strong> Use,Fort GreelyAlaskaFigure 3.9-43-269
Chapter 3—Affected EnvironmentThe potential NMD site would be located in what is known as the MainPost Area, just outside the cantonment area. The Main Post areaconsists of approximately 5,810 hectares (14,357 acres) <strong>and</strong> serves asthe center for most of the day-to-day activities at Fort Greely. Thecantonment area consists of family <strong>and</strong> troop housing, medical facilities,administrative buildings, community services, industrial areas, recreationareas, open space, <strong>and</strong> the Allen Army Airfield. (U.S. Army Alaska,1997—Draft Integrated Natural Resources Management Plan) Thisportion of Fort Greely is operating on a skeleton crew, <strong>and</strong> very fewfacilities are being utilized. A total of 741 hectares (1,830 acres) withinthe cantonment area is subject to BRAC realignment action, which isscheduled to be completed in July 2001. A prison is currently beingconsidered as a potential reuse of a portion of the cantonment area.(Gori, 1999—Comments received by EDAW, Inc., regarding the NMDDeployment Coordinating Draft DEIS)The Fort Greely West Training Area consists of 231,479 hectares(571,995 acres), currently withdrawn from the public domain by PublicLaw 99-606. The withdrawal terminates in 2001. The Department ofthe Army has published a Legislative EIS to renew its use of the FortGreely West Training Area (formerly known as the Fort Greely ManeuverArea). (Gori, 1999—Comments received by EDAW, Inc., regarding theNMD Deployment Coordinating Draft DEIS) This area is used as a testsite for weapons <strong>and</strong> equipment (U.S. Army Alaska, 1997—DraftIntegrated Natural Resources Management Plan) <strong>and</strong> is used to testexperimental designs under extreme weather conditions. This testing ofweapons <strong>and</strong> equipment includes all types of bombing <strong>and</strong> gunneryexercises in the impact areas. Large impact areas <strong>and</strong> buffer zones arerequired, since equipment <strong>and</strong> weapons with unknown or unreliable firingcharacteristics are being tested. Vehicle testing is also conducted on themaneuver area. This portion of Fort Greely contains very few man-madefacilities. (U.S. Department of the Army, 1980—EIS concerningProposed L<strong>and</strong> Withdrawal for the 172 nd Infantry Brigade at Fort Greely)The area to the south <strong>and</strong> east of the potential NMD site is known as theFort Greely East Training Area. This area of Fort Greely consists of20,943 hectares (51,750 acres) <strong>and</strong> is located east of the West TrainingArea (U.S. Army Alaska, 1997—Draft Integrated Natural ResourcesManagement Plan). This l<strong>and</strong> was withdrawn from the public domain byPublic Law 99-606. The withdrawal terminates in 2001. TheDepartment of the Army has published a Legislative EIS to renew its useof the Fort Greely East Training Area (formerly known as the Fort GreelyAir Drop Zone). This area is primarily used as a non-firing maneuver area.(Gori, 1999—Comments received by EDAW, Inc., regarding the NMDDeployment Coordinating Draft DEIS) Other activities includeexperimental air drops, airborne training, <strong>and</strong> testing of clothing, vehicles,<strong>and</strong> equipment. The principal facilities within this area are 53-kilometer3-270 NMD Deployment Final EIS
Chapter 3—Affected Environment(33-mile) <strong>and</strong> 18-kilometer (11-mile) vehicle test loops used to testvehicles in extreme weather conditions <strong>and</strong> varying snow depths. Othervehicles are tested during all seasons <strong>and</strong> on different types of terrain.Other than these test loops, there are very few man-made structures.When portions of the range are not in use for the testing of <strong>materials</strong>,infantry, artillery, <strong>and</strong> engineer units use the area for non-firing marches,troop maneuvers, artillery unit training, <strong>and</strong> small arms training (withblank ammunition). (U.S. Department of the Army, 1980—EISconcerning Proposed L<strong>and</strong> Withdrawal for the 172 nd Infantry Brigade atFort Greely)Fort Greely with its abundance of open space is used by the military <strong>and</strong>the public for a wide range of recreation activities. Portions of the basemay be closed at times for military missions, <strong>and</strong> impact areas are alwaysclosed for safety considerations. Otherwise, most of the remainder ofthe base can be used for recreation after obtaining permission from FortGreely. The most common recreation activities on the base are hunting,fishing, <strong>and</strong> trapping. Other activities include off-road vehicle use, hiking,backpacking, camping, boating, bicycling, wildlife watching, <strong>and</strong> skiing.The use of Fort Greely for subsistence is minimal.AestheticsThe ROI for aesthetics at Fort Greely includes the general visualenvironment surrounding the base <strong>and</strong> areas visible from offsite locations.The visual environment varies from rolling, plateau terrain in the WestTraining Area to relatively flat terrain at the Fort Greely East TrainingArea portion of the base. The East Training Area <strong>and</strong> northern sectionsof the West Training Area are nearly level <strong>and</strong> are covered with blackspruce, deciduous trees <strong>and</strong> shrubs, <strong>and</strong> muskeg. The southern part ofthe West Training Area consists of rolling plateaus mixed with kettlelakes. This area also has dense vegetation mixed with bogs, tundra,gorges, <strong>and</strong> rock outcroppings (U.S. Department of the Interior <strong>and</strong> U.S.Department of <strong>Defense</strong>, 1994—Fort Greely Proposed ResourceManagement Plan, Final EIS). The elevations range from 366 meters(1,200 feet) in the East Training Area <strong>and</strong> Cantonment Area toapproximately 1,829 meters (6,000 feet) above sea level in thesouthwestern portion of the West Training Area (U.S. Army Alaska,1997—Draft Integrated Natural Resources Management Plan). Thedominant visual features around Fort Greely include views of Mt. Hayes<strong>and</strong> the Alaska Range <strong>and</strong> the Trans-Alaska pipeline. Most views ontothe base from the Richardson Highway are screened by timber. Due tothe thickness of cover <strong>and</strong> sparse population of the region, Fort Greelyhas a relatively low visual sensitivity.NMD Deployment Final EIS 3-271
Chapter 3—Affected Environment3.9.1.5 Yukon Training Area (Fort Wainwright)—L<strong>and</strong> UseThis section describes the l<strong>and</strong> uses <strong>and</strong> aesthetics for the affected baseproperty at the Yukon Training Area (Fort Wainwright) <strong>and</strong> adjacentproperty. The ROI for l<strong>and</strong> use includes those areas potentially affectedby deployment of the GBI or BMC2 at the Yukon Training Area. The ROIfor aesthetics includes the training area <strong>and</strong> the surrounding areas in theviewshed.Regional L<strong>and</strong> UseThe Yukon Training Area is located in the Fairbanks North Star Boroughsoutheast of Fairbanks <strong>and</strong> adjacent to Eielson AFB. Although the YukonTraining Area is part of Fort Wainwright, it is located about 24 kilometers(15 miles) southeast of the main post. The regional l<strong>and</strong> use ROIincludes the maneuver area <strong>and</strong> surrounding adjacent l<strong>and</strong> uses.The Fairbanks North Star Borough is the planning <strong>and</strong> zoning authority forthe region around the Yukon Training Area. Since the Yukon TrainingArea is federally owned, it does not fall under the jurisdiction of theFairbanks North Star Borough. The l<strong>and</strong> around the training area is zonedas agriculture, forest l<strong>and</strong>, open space/natural areas, reserve areas(hunting, trapping, fishing, mining, recreation, <strong>and</strong> agriculture), <strong>and</strong>remote settlement areas (Fairbanks North Star Borough, 1997—Comprehensive Plan). The l<strong>and</strong> surrounding the Yukon Training Area,with the exception of Eielson AFB, is sparsely populated. The closestinhabited structure is in the community of Moose Creek just outside thenorthwest boundary of Eielson AFB. None of the l<strong>and</strong> uses in the areaare incompatible with the adjoining l<strong>and</strong> uses of the Yukon Training Area.Yukon Training Area (Fort Wainwright) L<strong>and</strong> UseThe site consists of 100,362 hectares (248,000 acres) <strong>and</strong> is utilized byall branches of the armed forces. It is jointly managed by the Bureau ofL<strong>and</strong> Management <strong>and</strong> the U.S. Army. This training area is currentlywithdrawn by Public Law 99-606. The withdrawal terminates in 2001.The Department of the Army has published a Legislative EIS to renew itsuse of the Fort Wainwright Yukon Training Area (formerly known as theFort Wainwright Yukon Maneuver Area). (Gori, 1999—Commentsreceived by EDAW, Inc., regarding the NMD Deployment CoordinatingDraft DEIS)The Yukon Training Area is relatively undeveloped, undisturbed, <strong>and</strong> hasvery few man-made structures. It is roughly broken down into threemain areas as shown in figure 3.9-5. One area is a 16-square-kilometer(6-square-mile) tract called the Stuart Creek Impact Area, which islocated in the north central portion of the maneuver area. This area isused by the Air Force <strong>and</strong> Army for the firing of live <strong>and</strong>/or practice3-272 NMD Deployment Final EIS
10Index MapYukonTrainingAreaChenaHot Springs Road 7South Fork Chena RiverChena RiverAFTAC Area8AlaskaHuskyDrop ZoneTran smitter Road11Beaver Creek Road7Small ArmsRangeBiathlon CourseSeeFigure 3.9-3Eielson AFBManchu TrailQuarryRoadSmall ArmsRangeSkyline RoadAb<strong>and</strong>oned Nike<strong>Missile</strong> SitesStuart CreekImpact Area/Buffer ZoneBrigadier Trail11Tanana River11Richardson HighwayJohnson Road7Salcha River10EXPLANATION1 Airfield*2 Aviation Support*3 Industrial*4 Institutional*5 Administrative*NORTHlu_yukon_002Commercial*ResidentialRecreationAgriculture*Scale 1:300,0000 2.4 4.7 Miles678910Open Space0 3.8 7.6 Kilometers11MilitaryImpact Area/BufferZoneAb<strong>and</strong>oned Nike <strong>Missile</strong> SiteDrop ZoneSmall Arms RangeAFTAC AreaRoadsRiversInstallation Boundary*St<strong>and</strong>ard l<strong>and</strong> use designationnot applicable to this figureNMD Deployment Final EISExisting L<strong>and</strong> Use,Yukon Training AreaAlaskaFigure 3.9-53-273
Chapter 3—Affected Environmentmunitions (U.S. Department of the Interior, <strong>and</strong> U.S. Department of<strong>Defense</strong>, 1994—Fort Wainwright Yukon Maneuver Area, ProposedResource Management Plan, Final EIS). The Air Force TechnicalApplications Center site is another area within the Yukon Training Area.It is located in the northwest corner of the maneuver area just east ofTransmitter Road <strong>and</strong> north of Beaver Creek Road. The Air ForceTechnical Applications Center site consists of 8,802 hectares (21,750acres) jointly utilized by the Army <strong>and</strong> the Air Force TechnicalApplications Center. Approximately 971 hectares (2,400 acres) withinthis large parcel are used exclusively by the Air Force (Department of theArmy, 1989—Permit of usage of the Air Force Technical ApplicationsCenter site). The Air Force Technical Applications Center site is used foroperation of a seismographic system that detects seismic disturbances<strong>and</strong> detonations of nuclear weapons worldwide. The remainder of theYukon Training Area is designated as training areas for mortar, artillery,<strong>and</strong> maneuver exercises. Within these training areas are two Nike sites(Bravo <strong>and</strong> Charlie), which are ab<strong>and</strong>oned nuclear defense facilities of theNike Hercules missile system. (U.S. Army Corps of Engineers, 1994—Field Report/Site Assessment for Yukon Maneuver Area, Nike Sites B &C, Fort Wainwright, Alaska)The Yukon Training Area with its abundance of open space is used bythe military <strong>and</strong> the public for a wide range of recreation activities.Portions of the base may be closed at times for military missions <strong>and</strong>impacts areas, <strong>and</strong> the Air Force Technical Applications Center area isalways closed for safety considerations <strong>and</strong> military operations.Otherwise, most of the remainder of the base can be used for recreationafter obtaining permission from Fort Wainwright or Eielson AFB. Themost common recreation activities on the base are hunting, fishing, <strong>and</strong>trapping. Other activities include off-road vehicle use, hiking,backpacking, camping, snowmobiling, wildlife watching, <strong>and</strong> skiing.AestheticsThe ROI for aesthetics at the Yukon Training Area includes the generalvisual environment surrounding the maneuver area <strong>and</strong> areas visible fromoffsite locations.The visual environment around the Yukon Training Area is best describedby the rolling terrain that primarily consists of undisturbed forests <strong>and</strong>woodl<strong>and</strong>s. There are some scattered wetl<strong>and</strong>s, relatively flat areas, <strong>and</strong>some parts that have been disturbed by training activities. Thetopography varies from rolling to hilly with elevations ranging from 168meters (550 feet) to 995 meters (3,265 feet) above sea level (U.S.Department of the Army, 1979—Draft EIS concerning Proposed L<strong>and</strong>Withdrawal for the 172th Infantry Brigade at Fort Wainwright). Due tothe terrain <strong>and</strong> remoteness of the Yukon Training Area, views of theYukon Training Area are extremely limited. Some roads into the area are3-274 NMD Deployment Final EIS
Chapter 3—Affected Environmentnot monitored, <strong>and</strong> the public could gain access into portions of theYukon Training Area, but due to the thickness of cover <strong>and</strong> lack ofprominent vistas, the Yukon Training Area has a low visual sensitivity.3.9.2 NORTH DAKOTA INSTALLATIONSA brief introduction is included to generally describe the l<strong>and</strong> uses in thenortheastern North Dakota region. Most of the l<strong>and</strong> within all of the ROIsis almost extensively used for agricultural purposes with some scatteredresidential, commercial, <strong>and</strong> industrial areas usually located around smallcommunities or towns. The area around all of the proposed sites is verysparsely populated. No form of comprehensive zoning or planning existsfor most counties in the region. However, most of the counties in thisregion do have some l<strong>and</strong> use controls that regulate development aroundhighways for health <strong>and</strong> safety concerns <strong>and</strong> for the preservation ofagricultural l<strong>and</strong>s but leave planning <strong>and</strong> economic development toregional planning councils. All of the potential sites are located onFederal property <strong>and</strong> are not subject to local l<strong>and</strong> use controls, but all tryto be as consistent as possible with these l<strong>and</strong> use controls.3.9.2.1 Cavalier AFS—L<strong>and</strong> UseThis section describes the l<strong>and</strong> uses <strong>and</strong> aesthetics for the affected baseproperty at Cavalier AFS <strong>and</strong> surrounding area. The ROI for l<strong>and</strong> useincludes the base, adjacent l<strong>and</strong> areas potentially affected byconstruction <strong>and</strong> deployment of the XBR, <strong>and</strong> areas up to 30 kilometers(19 miles) from the site to include areas where certain sensitiveelectronics may be susceptible to temporary interference with use of theXBR. The ROI will include those l<strong>and</strong> uses that may contain sensitiveelectronics such as residential, commercial, industrial, <strong>and</strong> institutional(such as medical <strong>and</strong> educational). The ROI for aesthetics includes thebase <strong>and</strong> adjacent off-base properties within the viewshed.Regional L<strong>and</strong> UseCavalier AFS is located in the northeast corner of North Dakota on thewestern edge of Pembina County in the Beaulieu Township. The regionall<strong>and</strong> use ROI includes the area within a 30-kilometer (19-mile) radius fromthe Cavalier AFS site in Pembina County.Beaulieu Township has no zoning ordinances; therefore, development inthe area is reviewed by Pembina County <strong>and</strong> the Red River RegionalPlanning Council to ensure compliance with the overall developmentguidelines. All of Pembina County’s regulations deal with developmentaround highways for health <strong>and</strong> safety concerns <strong>and</strong> for the preservationof agricultural l<strong>and</strong>s. Red River Regional Planning Council is the planning<strong>and</strong> economic development authority for the four-county region of Gr<strong>and</strong>Forks, Nelson, Pembina, <strong>and</strong> Walsh counties (Wangler, 1998—PersonalNMD Deployment Final EIS 3-275
Chapter 3—Affected Environmentcommunication). However, since Cavalier AFS is a Federal property itdoes not fall within the zoning <strong>and</strong> planning regulations of the council.As shown in table 3.9-1, the area is sparsely populated. The smalltowns within the ROI generally contain residential, commercial, industrial,<strong>and</strong> institutional l<strong>and</strong> uses that support the surrounding area. Theremainder of the area outside of these towns consists of pasture l<strong>and</strong>,cultivated cropl<strong>and</strong>, wooded areas, <strong>and</strong> some small bodies of waterscattered throughout the area. A small logging operation is adjacent tothe north of Cavalier AFS, <strong>and</strong> a few farmsteads are in the area, with theclosest inhabited structure being less than 0.8 kilometer (0.5 mile) awayfrom the site. All of the l<strong>and</strong> uses in the area are compatible withadjoining areas of Cavalier AFS.Table 3.9-1: Urban/Populated Areas within 30 Kilometers (19 Miles) ofthe Cavalier AFS SiteUrban/Populated Area Population Occupied HousingUnitsDistance (1)kilometers (miles)Akra * * 15 (9)Backoo * * 19 (12)Cavalier 1,508 631 23 (14)Concrete 20 6 3 (2)Crystal 201 80 23 (14)Easby * * 26 (16)Edinburg 292 127 24 (15)Gardar * * 15 (9)Hallson * * 6 (4)Hensel * * 18 (11)Leroy * * 24 (15Leyden * * 18 (11)Milton 141 62 15 (9)Mountain 130 44 5 (3)Olga * * 13 (8)Osnabrock 198 72 19 (12)Svold * * 11 (7)Union * * 19 (12)Vang * * 26 (16)Walhalla 1,131 454 21 (13)Source: U.S. Department of Commerce, 1998—U.S. Census Bureau.(1)Distance is in air miles* Unincorporated communities, no population data available3-276 NMD Deployment Final EIS
Chapter 3—Affected EnvironmentCavalier AFS L<strong>and</strong> UseThe general l<strong>and</strong> use is described by the eight l<strong>and</strong> use categories shownin figure 3.9-6. The station property totals 112 hectares (278 acres).The base is broken down into the airfield, industrial, administrative,commercial, residential, public recreation, <strong>and</strong> open space l<strong>and</strong> usecategories. (U.S. Air Force Space Comm<strong>and</strong>, undated—ComprehensivePlanning Framework)The eastern half of the site is dominated by mission-oriented industriall<strong>and</strong> uses consisting of the power plant, radar, <strong>and</strong> sewage <strong>and</strong> watertreatment facilities. The western portion of the site is dominated byresidential, administrative, industrial, <strong>and</strong> public facility/recreational useswith the remainder of the base being open l<strong>and</strong> use (U.S. Air Force SpaceComm<strong>and</strong>, undated—Comprehensive Planning Framework). There is alsoa small airfield at the southern end of the station that consists of ahelicopter pad <strong>and</strong> clear lanes for l<strong>and</strong>ing <strong>and</strong> takeoff.AestheticsThe ROI for aesthetics at Cavalier AFS includes the general visualenvironment surrounding the station <strong>and</strong> the areas visible from offsitelocations.The visual environment is distinguished by the open plains surroundingthe site, which are predominately used for agriculture <strong>and</strong> are the mostsignificant feature of the natural environment. The topography of the siteis generally flat at Cavalier AFS, with the site being at about 358 meters(1,175 feet) above sea level. The most significant man-made feature isthe Perimeter Acquisition Radar building. This facility st<strong>and</strong>sapproximately 37 meters (121.5 feet) tall. (U.S. Army Strategic <strong>Defense</strong>Comm<strong>and</strong>, 1991—Preliminary Building Availability Conditions Survey–SRMSC) Public access to the site is prohibited; therefore, views arelimited to passing traffic on ND 5 to the north, ND 32 to the east, <strong>and</strong> toadjacent l<strong>and</strong> owners. The site has a relatively low visual sensitivitybecause the flatness of the l<strong>and</strong> limits any prominent vistas.3.9.2.2 Gr<strong>and</strong> Forks AFB—L<strong>and</strong> UseThis section describes the l<strong>and</strong> uses <strong>and</strong> aesthetics for the base property<strong>and</strong> the surrounding areas of Gr<strong>and</strong> Forks AFB. The ROI for l<strong>and</strong> use <strong>and</strong>aesthetics includes the base <strong>and</strong> adjacent properties that could beaffected by construction activities <strong>and</strong> deployment of a GBI or BMC2 atGr<strong>and</strong> Forks AFB. The area potentially affected off-base would be theproperties immediately adjacent to the base.NMD Deployment Final EIS 3-277
CR 8993LoggingOperation95Patrol Road7AccessRoad10 10Fifth Avenue3PAR BuildingSixth StreetFourth Avenue76573Admin.3Service Road3SewageTreatmentPonds87310Patrol Road1Helicopter PadIndex MapCavalier AFS9North DakotaEXPLANATION1 Airfield2 Aviation Support*3 Industrial4 Institutional (Medical/Educational)*5 AdministrativeNORTHlu_cas_0023-278Scale 1:11,0000 459 917 Feet0 140 280 Meters678910CommercialResidentialRecreationAgricultureOpen SpaceRoadsInstallation BoundaryCR = County RoadPAR = Perimeter AcquisitionRadar*St<strong>and</strong>ard l<strong>and</strong> use designationnot applicable to this figureNMD Deployment Final EISExisting L<strong>and</strong> Use,Cavalier Air ForceStationNorth DakotaFigure 3.9-6
Chapter 3—Affected EnvironmentRegional L<strong>and</strong> UseThe regional l<strong>and</strong> use that could be affected by NMD deploymentincludes those properties immediately adjacent to the base in Gr<strong>and</strong> ForksCounty. The l<strong>and</strong> in the region is approximately 96 percent agricultural,2 percent developed, <strong>and</strong> 2 percent woodl<strong>and</strong>s, water bodies, <strong>and</strong>wetl<strong>and</strong>s.Development within Gr<strong>and</strong> Forks County is reviewed by the Gr<strong>and</strong> ForksCounty Planning <strong>and</strong> Zoning Commission to ensure conformity with thecounty's zoning <strong>and</strong> subdivision regulations. Because Gr<strong>and</strong> Forks AFB isFederal property, it does not fall within the zoning <strong>and</strong> planningregulations of the county. Gr<strong>and</strong> Forks County adopted zoning within theGr<strong>and</strong> Forks AFB vicinity based on the Air Force mission. Two zoneswere created to prevent l<strong>and</strong> uses that may encroach upon the base’smission. Zone I was established immediately around the base. Permitteduses are single family residences with a minimum lot size of 1 hectare(2.5 acres), agriculture, <strong>and</strong> "usual <strong>and</strong> ordinary farm buildings." Zone IIextends outward from Zone I, permitting uses in Zone I plus additionaluses such as duplexes, churches, motels, places of business, <strong>and</strong> mobilehome courts (U.S. Department of the Air Force, 1995—AICUZ Study,Gr<strong>and</strong> Forks AFB). The actual l<strong>and</strong> use immediately adjacent to the baseis agricultural, with the nearest inhabited structure being 0.8 kilometer(0.5 mile) from the base. A small commercial area <strong>and</strong> the town ofEmerado are located southeast of the base. No l<strong>and</strong> uses in the area areincompatible with adjoining areas of Gr<strong>and</strong> Forks AFB (U.S. Departmentof the Air Force, 1997—Gr<strong>and</strong> Forks AFB General Plan).Gr<strong>and</strong> Forks AFB L<strong>and</strong> UseGr<strong>and</strong> Forks AFB encompasses an area of 1,954 hectares (4,830 acres)(U.S. Department of the Air Force, 1997—Integrated Natural ResourceManagement Plan). L<strong>and</strong> uses at Gr<strong>and</strong> Forks AFB, as categorized in theGr<strong>and</strong> Forks Air Force Base General Plan include administrative, aircraftoperations <strong>and</strong> maintenance, airfield, community, housing, industrial,medical, open space, recreation, <strong>and</strong> water (figure 3.9-7).The airfield l<strong>and</strong> use is the dominant category on the base, <strong>and</strong> is focusedon the runway. The aircraft operations <strong>and</strong> maintenance l<strong>and</strong> use isinterdependent with the airfield l<strong>and</strong> use <strong>and</strong> is just east of the runway.The industrial areas include the base civil engineering complex onSeventh Avenue, the supply <strong>and</strong> transportation complex on EielsonStreet, <strong>and</strong> the Munitions Storage Area. The administrative l<strong>and</strong> useareas are spread along Steen Avenue, with two smaller areas physicallyseparated from it. Community facilities such as the Base Exchange <strong>and</strong>Commissary are on Holzapple Street, the schools in the family housingarea, <strong>and</strong> several commercial areas <strong>and</strong> community support areas areNMD Deployment Final EIS 3-279
Index Map9Gr<strong>and</strong> Forks AFB9TurtleRiver1North DakotaCR 3Runway10Housing73847Redwood AvenueSchools927th Avenue864 4732235 55Eielson Street6th Avenue643510SteenAvenueMainGate7MunitionsStorageArea9US 21012Alert Avenue87Secondary GateCR 36746EXPLANATION1 Airfield2 Aviation Support3 Industrial4 Institutional (Medical/Educational)5 AdministrativeNORTHlu_gfafb_0023-280Scale 1:40,0000 1,667 3,333 Feet0 508 1,016 Meters678910CommercialResidentialRecreationAgricultureOpen SpaceRoadsInstallation BoundaryGateCR = County RoadND = U.S. HighwayNMD Deployment Final EISExisting L<strong>and</strong> Use,Gr<strong>and</strong> Forks Air ForceBaseNorth DakotaFigure 3.9-7
Chapter 3—Affected Environmentadjacent to the unaccompanied housing. The medical l<strong>and</strong> use includesmedical activity such as the dental clinic <strong>and</strong> hospital. Family housingl<strong>and</strong> uses are found in attached <strong>and</strong> detached residential units located inthe Main, Dakota, <strong>and</strong> Sunflake family housing areas <strong>and</strong> a mobile homepark. Single personnel housing for enlisted members is in the centralbase area. Although pockets of outdoor recreation areas for childrenexist in the family housing area, the concentration of outdoor recreationl<strong>and</strong> use is with the ball park complex <strong>and</strong> golf course area. Open spaceon the base is west of County Road 3 up to the main gate <strong>and</strong> north ofthe central core of the main base area (U.S. Department of the Air Force,1997—Gr<strong>and</strong> Forks AFB General Plan).AestheticsThe ROI for aesthetics at Gr<strong>and</strong> Forks AFB includes the general visualenvironment surrounding the station <strong>and</strong> the areas visible from off-baseareas.The visual environment in the vicinity of Gr<strong>and</strong> Forks AFB is characterizedby the agricultural l<strong>and</strong> that surrounds the base. The topography of thel<strong>and</strong> is generally flat, with elevations ranging from 268 meters to 280meters (880 feet to 920 feet) above sea level, averaging about 271meters (890 feet) above sea level (U.S. Department of the Air Force,1997—Integrated Natural Resource Management Plan). Gr<strong>and</strong> Forks AFBis fairly developed <strong>and</strong> typical of a military installation with a mixture ofairfield, industrial, administrative, <strong>and</strong> housing facilities. The mostsignificant aspect of the natural environment is the flatness of the l<strong>and</strong><strong>and</strong> the abundance of agricultural l<strong>and</strong> surrounding the base. The mostsignificant man-made features are the airfield <strong>and</strong> the adjacent supportfacilities. These features are surrounded by open l<strong>and</strong>, which consists ofsome woodl<strong>and</strong>s, wetl<strong>and</strong>s that include the lagoons for <strong>waste</strong>watertreatment, <strong>and</strong> some agricultural outleased l<strong>and</strong>. Since public access tothe base is prohibited, viewpoints are primarily limited to traffic on U.S.Highway 2 to the south of Gr<strong>and</strong> Forks AFB, CR 3B to the east, <strong>and</strong> toadjacent l<strong>and</strong> owners who use the l<strong>and</strong> for agricultural purposes. Thearea has a low visual sensitivity because the flatness of the area does notallow for any prominent vistas.3.9.2.3 <strong>Missile</strong> Site Radar—L<strong>and</strong> UseThis section describes the l<strong>and</strong> uses <strong>and</strong> aesthetics for the affected baseproperty at the SRMSC <strong>Missile</strong> Site Radar <strong>and</strong> the surrounding area. TheROI for l<strong>and</strong> use includes the base <strong>and</strong> those adjacent areas potentiallyaffected by the construction <strong>and</strong> deployment of the GBI or XBR at thissite <strong>and</strong> areas up to 30 kilometers (19 miles) from the site to includeareas where certain sensitive electronics may be susceptible to temporaryinterference with use of the XBR. The ROI will include those l<strong>and</strong> usesthat may contain sensitive electronics such as residential, commercial,NMD Deployment Final EIS 3-281
Chapter 3—Affected Environmentindustrial, <strong>and</strong> institutional (such as medical <strong>and</strong> educational). The ROIfor aesthetics includes the base <strong>and</strong> adjacent off-base properties withinthe viewshed.Regional L<strong>and</strong> UseThe <strong>Missile</strong> Site Radar is located in the Nekoma Township just north ofthe town of Nekoma in Cavalier County. The regional l<strong>and</strong> use ROIincludes the area within a 30-kilometer (19-mile) radius from the <strong>Missile</strong>Site Radar.Nekoma Township has no zoning ordinances; therefore, development inthe area is reviewed by Cavalier County <strong>and</strong> the North Central PlanningCouncil to ensure compliance with overall development guidelines(Dufman, 1998—Personal communication). The Council is the planning<strong>and</strong> economic development authority for a six-county region that includesCavalier, Ramsey, Benson, Eddy, Towner, <strong>and</strong> Rolette counties.However, <strong>Missile</strong> Site Radar is a Federal property <strong>and</strong> does not fall withinthe zoning <strong>and</strong> planning regulations of the Council or the county. Asshown in table 3.9-2, the area is sparsely populated. The small townswithin the ROI can be expected to contain residential, commercial,industrial, <strong>and</strong> institutional l<strong>and</strong> uses that support the surrounding area.The remaining l<strong>and</strong> outside these small towns is almost exclusively usedfor agricultural purposes with the majority being used for cropl<strong>and</strong>, withsmall bodies of water <strong>and</strong> wooded areas scattered throughout. There area few farmsteads <strong>and</strong> the town of Nekoma within close proximity to thesite. The closest inhabited structure is approximately 0.8 kilometer (0.5mile) away. All of the l<strong>and</strong> uses in the area are compatible with adjoiningareas of the <strong>Missile</strong> Site Radar.<strong>Missile</strong> Site Radar L<strong>and</strong> UseThe general l<strong>and</strong> use of the 175-hectare (432-acre) site is depicted infigure 3.9-8. The eastern half of the site is dominated by missionorientedl<strong>and</strong> uses consisting of launch silos, a power plant, a radar, <strong>and</strong>sewage <strong>and</strong> water treatment facilities. The western portion of the site isdominated by mostly open space. In the central section there areadministrative, residential, <strong>and</strong> some industrial buildings remaining. Thereare also some indoor <strong>and</strong> outdoor recreation facilities located in thecentral portion of the base (U.S. Army Corps of Engineers, 1974—Analysis of Existing Facilities at SRMSC). Some existing permanentsafety restrictive easements are in place that extend outside the <strong>Missile</strong>Site Radar boundary. These easements limit uses to only those of anagricultural nature. No permanent habitable structures are permitted inthis easement. Currently, no structures are located within theseeasements. The entire site is currently inactive, but is being maintainedin a caretaker status.3-282 NMD Deployment Final EIS
Index MapMSR6North Dakota9Launch Sites710SewageTreatmentPonds81HelicopterPad3ND 151084877533MSRBuilding7CR 26Main Gate977NekomaEXPLANATION1 Airfield2 Aviation Support*3 Industrial4 Institutional (Medical/Educational)5 AdministrativeNORTHlu_msr_002Scale 1:15,0000 625 1,250 Feet0 191 381 Meters678910Commercial*ResidentialRecreationAgricultureOpen SpaceRoadsInstallation BoundaryGateCR = County RoadND = North Dakota Highway*St<strong>and</strong>ard l<strong>and</strong> use designationnot applicable to this figureNMD Deployment Final EISExisting L<strong>and</strong> Use,<strong>Missile</strong> Site RadarNorth DakotaFigure 3.9-83-283
Chapter 3—Affected EnvironmentTable 3.9-2: Urban/Populated Areas within 30 Kilometers (19 Miles)of the <strong>Missile</strong> Site RadarUrban/Populated Area Population Occupied HousingUnitsDistance (1)kilometers (miles)Adams 225 121 29 (18)Alsen 118 60 26 (16)Derrick * * 19 (12)Easby * * 16 (10)Edmore 329 135 21 (13)Fairdale 80 34 15 (9)Hampden 94 52 23 (14)Langdon 2,241 960 19 (12)Loma 19 12 13 (8)Milton 141 62 24 (15)Nekoma 61 30 2 (1)Osnabrock 198 72 18 (11)Weaver * * 27 (17)Source: U.S. Department of Commerce, 1998—U.S. Census Bureau.(1)Distance in air miles* Unincorporated communities, no population data availableAestheticsThe ROI for aesthetics at the <strong>Missile</strong> Site Radar includes the generalvisual environment surrounding the site <strong>and</strong> the areas visible from offsitelocations.The visual environment is characterized by the open plains surroundingthe site that are used for agriculture. The agricultural l<strong>and</strong> is the mostsignificant feature of the natural environment. The topography of thel<strong>and</strong> is relatively flat, with the <strong>Missile</strong> Site Radar being at about 497meters (1,630 feet) above sea level (U.S. Army Corps of Engineers,1974—Analysis of Existing Facilities at SRMSC). The most significantman-made feature is the <strong>Missile</strong> Site Radar building. This facility lookssimilar to a pyramid <strong>and</strong> st<strong>and</strong>s approximately 23 meters (75 feet) tall.Public access to the site is prohibited; therefore, views are limited totraffic on Highway 1 to the west, CR 26 to the south, <strong>and</strong> CR 66 to thenorth, <strong>and</strong> to adjacent l<strong>and</strong> owners <strong>and</strong> to the town of Nekoma to thesouth. The site <strong>and</strong> the surrounding area have a low visual sensitivitybecause the flatness of the l<strong>and</strong> does not provide for any prominentvistas.3-284 NMD Deployment Final EIS
Chapter 3—Affected Environment3.9.2.4 Remote Sprint Launch Site 1—L<strong>and</strong> UseThis section describes the l<strong>and</strong> uses <strong>and</strong> aesthetics for the affected baseproperty at the SRMSC Remote Sprint Launch Site 1 <strong>and</strong> surroundingarea. The ROI for l<strong>and</strong> use includes the base, adjacent areas potentiallyaffected by construction <strong>and</strong> deployment of the XBR, <strong>and</strong> areas up to 30kilometers (19 miles) from the site to include property where certainsensitive electronics may be susceptible to temporary interference withuse of the XBR. The ROI will include those l<strong>and</strong> uses that may containsensitive electronics such as residential, commercial, industrial, <strong>and</strong>institutional (such as medical <strong>and</strong> educational). The ROI for aestheticsincludes the base <strong>and</strong> adjacent off-base properties within the viewshed.Regional L<strong>and</strong> UseThe regional l<strong>and</strong> use includes the area within a 30-kilometer (19-mile)radius from Remote Sprint Launch Site 1. The site is located inNorthfield Township east of the town of Hampden in Ramsey County <strong>and</strong>is 1.2 kilometers (0.75 mile) south of Cavalier County.Northfield Township has no zoning ordinances; therefore, development inthe area is reviewed by Ramsey County <strong>and</strong> the North Central PlanningCouncil to ensure compliance with overall development guidelines. TheCouncil is the planning <strong>and</strong> economic development authority for a sixcountyregion that includes Cavalier, Ramsey, Benson, Eddy, Towner,<strong>and</strong> Rolette counties (Anderson, 1998—Personal communication,February 23). However, Remote Sprint Launch Site 1 is a Federalproperty <strong>and</strong> does not fall within the jurisdiction of the county or theNorth Central Planning Council. As shown in table 3.9-3, the area issparsely populated, with the closest inhabited structure being about 2.4kilometers (1.5 miles) northeast of the site. The small towns within theROI generally contain residential, commercial, industrial, <strong>and</strong> institutionall<strong>and</strong> uses that support the surrounding area. The remaining l<strong>and</strong> outsidethese small towns is almost exclusively used for agricultural purposes,mostly cropl<strong>and</strong>, with some wooded areas <strong>and</strong> small bodies of waterdistributed throughout. None of the l<strong>and</strong> uses in the area areincompatible with adjoining l<strong>and</strong> uses of Remote Sprint Launch Site 1.Remote Sprint Launch Site 1 L<strong>and</strong> UseThe general l<strong>and</strong> use of the 17-hectare (41-acre) site is military (U.S.Army Strategic <strong>Defense</strong> Comm<strong>and</strong>, 1991—Preliminary BuildingAvailability Conditions Survey, SRMSC). The site consists of ab<strong>and</strong>onedanti-missile launch silos that are located near the center of the site,launch support buildings located to the west of the launch silos, <strong>and</strong>sewage treatment ponds in the eastern portion of the site. A perimeterfence surrounds the facility. A security fence also surrounds the sewageNMD Deployment Final EIS 3-285
Chapter 3—Affected Environmenttreatment ponds, as shown in figure 3.9-9. Remote Sprint Launch Site 1is currently inactive, but is maintained in a caretaker status.Table 3.9-3: Urban/Populated Areas within 30 Kilometers (19 Miles)of Remote Sprint Launch Site 1Urban/PopulatedAreaPopulationOccupied HousingUnitsDistance (1)kilometers (miles)Alsen 118 60 15 (9)Calio 30 16 29 (18)Derrick * * 6 (4)Edmore 329 135 16 (10)Fairdale 80 34 27 (17)Garske * * 29 (18)Hampden 94 52 5 (3)Langdon 2,241 960 30 (19)Lawton 63 30 30 (19)Loma 19 12 11 (7)Munich 341 122 24 (15)Nekoma 61 30 16 (10)Saint Joe * * 26 (16)Starkweather 180 68 24 (15)Weaver * * 8 (5)Source: U.S. Department of Commerce, 1998—U.S. Census Bureau.(1)Distance in air miles* Unincorporated communities, No Population Data AvailableAestheticsThe ROI for aesthetics at Remote Sprint Launch Site 1 includes thegeneral visual environment surrounding the site <strong>and</strong> the areas visible fromoffsite locations.The visual environment is characterized by the open plains surroundingthe site that are used for agriculture. The agricultural l<strong>and</strong> is the mostsignificant feature of the natural environment. The topography of thel<strong>and</strong> is relatively flat, with Remote Sprint Launch Site 1 being at about474 meters (1,555 feet) above sea level. (U.S. Army Corps ofEngineers, 1974—Analysis of Existing Facilities at SRMSC) The mostsignificant man-made features are the launch silos, launch supportbuildings, <strong>and</strong> the sewage treatment lagoons. Public access to the site isprohibited; therefore, views are limited to traffic on CR 32 to the south<strong>and</strong> to adjacent l<strong>and</strong> owners. The site <strong>and</strong> the surrounding area have a3-286 NMD Deployment Final EIS
Index MapRSL-1Launch SitesNorth DakotaPatrol Road11Underground LaunchSupport FacilityService RoadSewage TreatmentPonds9Access Road119CR 32EXPLANATION1 Airfield*2 Aviation Support*3 Industrial*678Commercial*Residential*Recreation*11MilitaryRoadsInstallation BoundaryExisting L<strong>and</strong> Use,Remote Sprint LaunchSite 145NORTHlu_rsl1_002Institutional (Medical/Educational)*Administrative*Scale 1:4,0000 167 333 Feet0 51 101 Meters910AgricultureOpen Space**St<strong>and</strong>ard l<strong>and</strong> use designationnot applicable to this figureNMD Deployment Final EISNorth DakotaFigure 3.9-93-287
Chapter 3—Affected Environmentlow visual sensitivity because the flatness of the l<strong>and</strong> does not providefor any prominent vistas.3.9.2.5 Remote Sprint Launch Site 2—L<strong>and</strong> UseThis section describes the l<strong>and</strong> uses <strong>and</strong> aesthetics for the affected baseproperty at the SRMSC Remote Sprint Launch Site 2. The ROI for l<strong>and</strong>use includes the base, adjacent areas potentially affected by construction<strong>and</strong> deployment of an XBR, <strong>and</strong> properties up to 30 kilometers (19 miles)from the site to include areas where certain sensitive electronics may besusceptible to temporary interference with use of the XBR. The ROI willinclude those l<strong>and</strong> uses which may contain sensitive electronics such asresidential, commercial, industrial, <strong>and</strong> institutional (such as medical <strong>and</strong>educational). The ROI for aesthetics includes the base <strong>and</strong> adjacent offbaseproperties within the viewshed.Regional L<strong>and</strong> UseThe Remote Sprint Launch Site 2 is located in Langdon Townshipnortheast of the town of Dresden. The regional l<strong>and</strong> use ROI includes thearea within a 30-kilometer (19-mile) radius from Remote Sprint LaunchSite 2.Langdon Township has zoning regulations for the town of Langdon <strong>and</strong>for areas outside the incorporated areas. These regulations deal withflood zones, building <strong>and</strong> tree setbacks, <strong>and</strong> agricultural uses. Nonconforminguses are reviewed by the Township Board (Borgan, 1999—Personal communication). Cavalier County falls under the jurisdiction ofthe North Central Planning Council. The Council is the planning <strong>and</strong>economic development authority for a six-county region that includesCavalier, Ramsey, Benson, Eddy, Towner, <strong>and</strong> Rolette counties.However, since Remote Sprint Launch Site 2 is a Federal property, itdoes not fall within the zoning <strong>and</strong> planning regulations of the Council orthe county. As shown in table 3.9-4, the area is sparsely populated,with the closest inhabited structure being 1.1 kilometers (0.7 mile) away.The remaining l<strong>and</strong> outside the towns is almost exclusively used foragricultural purposes with the majority being used for cropl<strong>and</strong>, withsmall bodies of water <strong>and</strong> wooded areas scattered throughout. All of thel<strong>and</strong> uses in the area are compatible with adjoining areas of RemoteSprint Launch Site 2.Remote Sprint Launch Site 2 L<strong>and</strong> UseThe general l<strong>and</strong> use of the 15-hectare (36-acre) site is military,consisting of ab<strong>and</strong>oned anti-missile launch silos located in the centralportion of the site, launch support buildings in the southern portion, <strong>and</strong>sewage treatment ponds located on the eastern side of the site (U.S.Army Strategic <strong>Defense</strong> Comm<strong>and</strong>, 1991—Preliminary Building3-288 NMD Deployment Final EIS
Chapter 3—Affected EnvironmentAvailability <strong>and</strong> Conditions Survey, SRMSC). A perimeter fencesurrounds the facility. There is also a security fence around the sewagetreatment ponds. See figure 3.9-10. The entire site is currently inactive,but is maintained under a caretaker status.Table 3.9-4: Urban/Populated Areas within 30 Kilometers (19 Miles)of Remote Sprint Launch Site 2Urban/Populated Area Population OccupiedHousing UnitsDistance (1)kilometers (miles)Dresden * * 4 (3)Easby * * 21 (13)Hannah 59 25 23 (14)Langdon 2,241 960 11 (7)Loma 19 12 24 (15)Maida * * 18 (11)Mount Carmel * * 10 (6)Olga * * 30 (19)Osnabrock 198 72 29 (18)Snowflake/Windygates 1,850 (2) 620 (2) 19 (12)Vang * * 23 (14)Wales 44 20 15 (9)Source: U.S. Department of Commerce, 1998—U.S. Census Bureau; Statistics Canada, 1999—Welcome to Statistics Canada.(1)Distance in air miles(2)Canadian towns that fall within the Pembina Municipality (County), which is the smallestbreakdown of the Canadian Census* Unincorporated communities, no population data availableAestheticsThe ROI for aesthetics at Remote Sprint Launch Site 2 includes thegeneral visual environment surrounding the site <strong>and</strong> the areas visible fromoffsite locations.The visual environment is characterized by the open plains surroundingthe site that are used for agriculture, <strong>and</strong> the agricultural l<strong>and</strong> is the mostsignificant feature of the natural environment. The topography of thel<strong>and</strong> is relatively flat, with Remote Sprint Launch Site 2 being at about489 meters (1,603 feet) above sea level. The most significant man-madefeatures are the launch silos, launch support buildings, <strong>and</strong> the sewagetreatment lagoons. Public access to the site is prohibited; therefore,views are limited to traffic on an unnamed county road that serves as theaccess road off of Highway 1 to the site <strong>and</strong> to adjacent l<strong>and</strong> owners.NMD Deployment Final EIS 3-289
Service RoadIndex MapRSL-29North DakotaLaunch Sites11Sewage TreatmentPondsPatrol RoadAccess Road11Underground LaunchSupport Facility9EXPLANATION1 Airfield*2 Aviation Support*3 Industrial*678Commercial*Residential*Recreation*11MilitaryRoadsInstallation BoundaryExisting L<strong>and</strong> Use,Remote Sprint LaunchSite 245NORTHlu_rsl2_0023-290Institutional (Medical/Educational)*Administrative*Scale 1:4,0000 167 333 Feet0 51 101 Meters910AgricultureOpen Space**St<strong>and</strong>ard l<strong>and</strong> use designationnot applicable to this figureNMD Deployment Final EISNorth DakotaFigure 3.9-10
Chapter 3—Affected EnvironmentThe site <strong>and</strong> the surrounding area have a low visual sensitivity becausethe flatness of the l<strong>and</strong> does not provide for any prominent vistas.3.9.2.6 Remote Sprint Launch Site 4—L<strong>and</strong> UseThis section describes the l<strong>and</strong> uses <strong>and</strong> aesthetics for the affected baseproperty at the SRMSC Remote Sprint Launch Site 4. The ROI for l<strong>and</strong>use includes the base, adjacent off-base property potentially affected byconstruction <strong>and</strong> deployment of the XBR, <strong>and</strong> areas up to 30 kilometers(19 miles) from the site to include areas where certain sensitiveelectronics may be susceptible to temporary interference with use of theXBR. The ROI will include those l<strong>and</strong> uses that may contain sensitiveelectronics such as residential, commercial, industrial, <strong>and</strong> institutional(such as medical <strong>and</strong> educational). The ROI for aesthetics includes thebase <strong>and</strong> adjacent off-base properties within the viewshed.Regional L<strong>and</strong> UseRemote Sprint Launch Site 4 is located in Kinloss Township southwest ofthe town of Fairdale in Walsh County. The regional l<strong>and</strong> use ROI includesthe area within a 30-kilometer (19-mile) radius from Remote SprintLaunch Site 4.Kinloss Township does not have any zoning ordinances; therefore,development in the area is reviewed by Walsh County <strong>and</strong> the Red RiverRegional Planning Council to ensure compliance with overall developmentguidelines. The Council is the planning <strong>and</strong> economic developmentauthority for a four-county region that includes Gr<strong>and</strong> Forks, Pembina,Walsh, <strong>and</strong> Nelson counties (Wangler, 1998—Personal communication).However, since Remote Sprint Launch Site 4 is a Federal property, itdoes not fall within the zoning <strong>and</strong> planning regulations of the Council orthe county. As shown in table 3.9-5, the area is sparsely populated,with the closest inhabited structure being about 3.2 kilometers (2 miles)away in Fairdale. The small towns within the ROI generally containresidential, commercial, industrial, <strong>and</strong> institutional l<strong>and</strong> uses that supportthe surrounding area. The remaining l<strong>and</strong> outside these small towns isalmost exclusively used for agricultural purposes, with the majority beingused for cropl<strong>and</strong>, with small bodies of water <strong>and</strong> wooded areasscattered throughout the area. All of the l<strong>and</strong> uses in the area arecompatible with adjoining areas of Remote Sprint Launch Site 4.Remote Sprint Launch Site 4 L<strong>and</strong> UseThe general l<strong>and</strong> use of the 20-hectare (50-acre) site is military,consisting of ab<strong>and</strong>oned anti-missile launch silos located in the center ofthe site, launch support buildings located adjacent to the silos to theeast, <strong>and</strong> a sewage treatment pond located at the southern portion of thesite (U.S. Army Strategic <strong>Defense</strong> Comm<strong>and</strong>, 1991—Preliminary BuildingNMD Deployment Final EIS 3-291
Chapter 3—Affected EnvironmentAvailability <strong>and</strong> Conditions Survey, SRMSC). The facility is surroundedby a perimeter fence. There is also a security fence around the sewagetreatment ponds. See figure 3.9-11. The entire site is currently inactive,but is maintained in a caretaker status.Table 3.9-5: Urban/Populated Areas within 30 Kilometers (19 Miles)of Remote Sprint Launch Site 4Urban/Populated Area Population OccupiedHousing UnitsDistance (1)kilometers (miles)Adams 225 121 15 (9)Brocket 96 40 30 (19)Derrick * * 23 (14)Easby * * 26 (16)Edinburg 292 127 30 (19)Edmore 329 135 16 (10)Fairdale 80 34 3 (2)Lawton 63 30 21 (13)Loma 19 12 27 (17)Milton 141 62 23 (14)Nekoma 61 30 15 (9)Osnabrock 198 72 23 (14)Union * * 24 (15)Source: U.S. Department of Commerce, 1998—U.S. Census Bureau.(1)Distance in air miles* Unincorporated communities, no population data availableAestheticsThe ROI for aesthetics at Remote Sprint Launch Site 4 includes thegeneral visual environment surrounding the site <strong>and</strong> the areas visible fromoffsite locations.The visual environment is characterized by the open plains surroundingthe site that are used for agriculture. The agricultural l<strong>and</strong> is the mostsignificant feature of the natural environment. The topography of thel<strong>and</strong> is relatively flat, with Remote Sprint Launch Site 4 being at about489 meters (1,603 feet) above sea level. The most significant man-madefeatures are the launch silos, launch support buildings, <strong>and</strong> the sewagetreatment lagoons. Public access to the site is prohibited; therefore,views are limited to traffic on CR 22 to the east <strong>and</strong> CR 9 to the north<strong>and</strong> to adjacent l<strong>and</strong> owners. The site <strong>and</strong> the surrounding area have alow visual sensitivity because the flatness of the l<strong>and</strong> does not providefor any prominent vistas.3-292 NMD Deployment Final EIS
Index MapRSL-49North DakotaAccess Road11Service RoadPatrol RoadLaunch SitesUndergroundLaunchSupportFacility911Sewage TreatmentPondsEXPLANATION1 Airfield*2 Aviation Support*3 Industrial*4 Institutional (Medical/Educational)*5 Administrative*NORTHScale 1:3,5000 146 292 Feet0 45 89 Meters678910Commercial*Residential*Recreation*AgricultureOpen Space*11MilitaryRoadsInstallation Boundary*St<strong>and</strong>ard l<strong>and</strong> use designationnot applicable to this figureExisting L<strong>and</strong> Use,Remote Sprint LaunchSite 4North DakotaFigure 3.9-11lu_rsl4_002NMD Deployment Final EIS3-293
Chapter 3—Affected Environment3.10 NOISENoise is usually described as unwanted sound. Characteristics of soundinclude amplitude, frequency, <strong>and</strong> duration. Sound can vary over anextremely large range of amplitudes. The decibel (dB) is the acceptedst<strong>and</strong>ard unit for the measure of the amplitude of sound because itaccounts for the large variations in amplitude <strong>and</strong> reflects the way peopleperceive changes in sound amplitude. Sound pressure levels (SPL) areeasily measured, but the variability is subjective, <strong>and</strong> physical response tosound complicates the analysis of its impact on people. People judge therelative magnitude of sound sensation by subjective terms such as“loudness” or “noisiness.” Table 3.10-1 presents the perceived change inloudness due to changes in SPL.Table 3.10-1: Perceived Changes in Loudness due to Changes in SoundPressure LevelChange in Sound Pressure Level (decibels)Perceived Loudness3 Just noticeable5 Clearly noticeable10 Doubling or halvingSource: Cowan, 1994—H<strong>and</strong>book of Environmental Acoustics.Sound also varies with frequency or pitch. When describing sound <strong>and</strong>its effect on a human population, A-weighted sound levels, measured inA-weighted decibels (dBA), are typically used to account for the responseof the human ear. The term “A-weighted” refers to a filtering of thesound signal to emphasize frequencies in the middle of the audiblespectrum <strong>and</strong> to de-emphasize low <strong>and</strong> high frequencies in a mannercorresponding to the way the human ear perceives sound. The ANSI(1983) has established this filtering network. The A-weighted noise levelhas been found to correlate well with people’s judgments of noisiness ofdifferent sounds <strong>and</strong> has been used for many years as a measure ofcommunity noise. Typical A-weighted SPLs for some common noisesources are given in table 3.10-2.Noise is usually defined as sound that is undesirable because it interfereswith speech communication <strong>and</strong> hearing, is intense enough to damagehearing, or is otherwise annoying. Noise levels often change with time;therefore, to compare levels over different time periods, severaldescriptors have been developed that take into account this time-varyingnature. These descriptors are used to assess <strong>and</strong> correlate the variouseffects of noise on humans <strong>and</strong> animals, including l<strong>and</strong>-use compatibility,sleep interference, annoyance, hearing loss, speech interference, <strong>and</strong>startle effects.3-294 NMD Deployment Final EIS
Chapter 3—Affected EnvironmentSourceTable 3.10-2: Noise Levels of Common SourcesNoise Level(in A-weighted decibels)CommentAir raid siren 120 At 15.2 meters (50 feet)(threshold of pain)Rock concerts 110Airplane, 747 102.5 At 304.8 meters (1,000 feet)Jackhammer 96 At 3.0 meters (10 feet)Power lawn mower 96 At 0.9 meters (3 feet)Football game 88 Crowd size: 65,000Freight train at full speed 88 to 85 At 9 meters (30 feet)Portable hair dryer 86 to 77 At 0.3 meters (1 foot)Vacuum cleaner 85 to 78 At 1.5 meters (5 feet)Long range airplane 80 to 70 InsideConversation 60Typical suburban50backgroundBird calls 44Quiet urban nighttime 42Quiet suburban nighttime 36Library 34Bedroom at night 30Audiometric (hearingtesting) boothSource: Cowan, 1994—H<strong>and</strong>book of Environmental Acoustics.10 Threshold of hearing withouthearing lossThe primary environmental noise descriptor used in environmental noiseassessments is the A-weighted Day-Night Equivalent Sound Level (whichis abbreviated DNL <strong>and</strong> symbolized as Ldn). The DNL was developed toevaluate the total daily community noise environment. The DNL is theaverage A-weighted acoustical energy during a 24-hour period, with 10dBA added to all signals recorded within the hours of 10:00 p.m. <strong>and</strong>7:00 a.m. This 10 dBA is a penalty that accounts for the extrasensitivity people have to noise during typical sleeping hours.Almost all Federal agencies having non-occupational noise regulations useDNL as their principal noise descriptor for community assessments.These agencies include the FAA, the Federal Transit Administration, theU.S. EPA, the Department of Housing <strong>and</strong> Urban Development, theDepartment of Veterans Affairs, <strong>and</strong> the DOD. In addition, ANSIst<strong>and</strong>ards S12.9-1988, American National St<strong>and</strong>ard Quantities <strong>and</strong>Procedures for Description <strong>and</strong> Measurement of Environmental Sounds,Part 1 (1988), <strong>and</strong> S12.40-1990, American National St<strong>and</strong>ard SoundLevel Descriptors for Determination of Compatible L<strong>and</strong> Use (1990), bothNMD Deployment Final EIS 3-295
Chapter 3—Affected Environmentidentify DNL as the descriptor of choice for long-term environmentalassessment measurements.The Federal Interagency Committee on Urban Noise developed l<strong>and</strong>-usecompatibility guidelines for noise in terms of DNL (U.S. Department ofCommerce, 1980—Guidelines for Considering Noise in L<strong>and</strong> Use Planning<strong>and</strong> Control). Table 3.10-3 provides the U.S. Army’s DNL ranges forcompatibility with noise sensitive l<strong>and</strong> uses.NoiseZoneTable 3.10-3: L<strong>and</strong> Use Compatibility for NoiseCompatibility with NoiseSensitive L<strong>and</strong> UsesPercent of PopulationHighly AnnoyedA-weighted Day-NightSound Level (DNL)I Acceptable Less than 15 Less than 65 dBAII Normally unacceptable 15 to 39 65 to 75 dBAIII Unacceptable More than 39 Greater than 75 dBASource: U.S. Department of the Army, 1990—Environmental Quality, Environmental Protection <strong>and</strong>Enhancement.Other common environmental noise descriptors that are sometimes usedto supplement the DNL in environmental noise assessments are theContinuous Equivalent Sound Level (Leq), the Maximum InstantaneousSPL (Lmax), <strong>and</strong> the Sound Exposure Level (SEL).The Leq is the continuous equivalent sound level, defined as the single SPLthat, if constant over the stated measurement period, would contain thesame sound energy as the actual monitored sound that is fluctuating inlevel over the measurement period. The Leq must have a designated timeperiod; for example, an Leq for 30 minutes would be denoted as Leq(30 min).The Lmax is simply the highest SPL measured during a noise event.The total energy of a single discrete event, such as an aircraft flyoveror train passby, is represented by the SEL. The SEL is based onA-weighted sound levels that compress the total energy for the eventinto a 1-second time duration. Since most discrete events occur forlonger than 1 second, the SEL will be higher than values associatedwith any other rating method (including Lmax) for a specific event. TheSEL is the noise descriptor most commonly used to assess sleepdisturbance.The Federal Highway Administration has established criteria forcharacterizing motor vehicle noise on roads constructed with Federalfunds. Because they represent established criteria for analyzing trafficnoise levels, they will be used in analyzing baseline conditions. Based onthese criteria (see table 3.10-4), an exterior Leq(1 hour) of 67 dBA is thest<strong>and</strong>ard typically used to evaluate outdoor noise levels along roadways,3-296 NMD Deployment Final EIS
Chapter 3—Affected Environment<strong>and</strong>, therefore, this value will be used to characterize noise levels alongroadways adjacent to <strong>and</strong> in the areas surrounding proposed NMDactivities.Table 3.10-4: Federal Highway Administration Noise Abatement CriteriaActivityCategoryLeq(1 hour) (dBA)Area DescriptionA 57 (exterior) L<strong>and</strong>s on which serenity <strong>and</strong> quiet are of extraordinarysignificance <strong>and</strong> serve an important public need <strong>and</strong>where the preservation of those qualities is essential ifthe area is to continue to serve its intended purpose(Such areas could include amphitheaters, particularparts or portions of parks, open spaces, or historicdistricts which are dedicated or recognized byappropriate local officials for activities requiringspecial qualities or serenity <strong>and</strong> quiet)B 67 (exterior) Picnic areas, recreation areas, playgrounds, activesports areas, parks, residences, motels, hotels,schools, churches, libraries, <strong>and</strong> hospitalsC 72 (exterior) Developed l<strong>and</strong>s, properties, or activities not includedin categories A or BD --- Undeveloped l<strong>and</strong>s (For requirements on undevelopedl<strong>and</strong>s see paragraphs 11a <strong>and</strong> c of Federal AidHighway Program Manual, Volume 7, Chapter 7,Section 3)E 52 (interior) Residences, motels, hotels, public meeting rooms,schools, churches, libraries, hospitals, <strong>and</strong> auditoriumsSource: 23 CFR Part 772.Note: dBA = decibel A-weighted, Leq = equivalent sound levelUnder OSHA regulations (29 CFR 1910.95), which are designed toensure safe <strong>and</strong> healthy working conditions, workers exposed to 8-hourtime-weighted average SPLs of 85 dBA <strong>and</strong> 90 dBA are required to bemonitored <strong>and</strong> to be provided with hearing protection, respectively.While this st<strong>and</strong>ard is for workers, it is used as a reasonable guidance inassessing the potential impact to people in general.The ROI for noise includes those areas potentially affected by proposedNMD activities that might experience DNLs greater than or equal to 65dBA, those areas potentially affected by proposed NMD activities thatpotentially might experience short-term noise events (of less than 8 hours)with noise levels greater than or equal to 85 dBA, <strong>and</strong> those areas alongroadways potentially affected by proposed NMD activities that potentiallymight experience a Leq(1 hour) greater than or equal to 67 dBA.NMD Deployment Final EIS 3-297
Chapter 3—Affected Environment3.10.1 ALASKA INSTALLATIONS3.10.1.1 Clear AFS—NoiseThe area surrounding Clear AFS is sparsely populated <strong>and</strong>, thus, wouldbe expected to have a background noise level of DNL less than or equalto 55 dBA (see table 3.10-5). Furthermore, no major sources of noiseare known to exist around the NMD site at Clear AFS (EDAW, Inc.,1998—Trip report of visit to Alaska, July 20–31), thus traffic is expectedto be the main source of noise at Clear AFS <strong>and</strong> vicinity.Table 3.10-5: Noise Levels Expected in Various AreasCustomary QualitativeDescription of the AreaTypical Range ofBackground NoiseLevels (Day-NightLevel in dBA)AverageBackgroundNoise Level (Day-Night Level indBA)Average CensusTract PopulationDensity (Numberof People PerSquare Mile)Quiet SuburbanResidentialNormal SuburbanResidential48—52 50 63053—57 21 2,000Urban Residential 58—62 28 6,300Noisy UrbanResidential63—67 65 20,000Very Noisy UrbanResidential68—72 70 63,000Source: U.S. EPA, 1974—Information on Levels of Environmental Noise Requisite to Protect PublicHealth <strong>and</strong> Welfare with an Adequate Margin of Safety.Note: dBA = decibel A-weighted, Leq = equivalent sound levelThe main highway in the vicinity of Clear AFS is the George ParksHighway. The summer average daily traffic count for the George ParksHighway in the vicinity of Clear AFS is 2,011 (Alaska Department ofTransportation <strong>and</strong> Public Facilities, 1997—Annual Traffic VolumeReport). Traffic noise levels of Leq(1 hour) equals 72 dBA, Leq(1 hour) equals 67dBA, <strong>and</strong> Leq(1 hour) equals 57 dBA are estimated to occur at approximately14 meters (46 feet), 31 meters (101 feet), <strong>and</strong> 143 meters (469 feet)from the highway, respectively. For the purpose of analysis, the speedof the traffic was assumed to be 105 kilometers (65 miles) per hour.No noise sensitive receptors are known to exist in the vicinity of theNMD site at Clear AFS (EDAW, Inc., 1998—Trip Report of visit toAlaska, July 20–31).3-298 NMD Deployment Final EIS
Chapter 3—Affected Environment3.10.1.2 Eareckson AS—NoiseEareckson AS is located on Shemya Isl<strong>and</strong>, which has no populationother than personnel associated with the air station, <strong>and</strong> based on table3.10-5, would be expected to have a background noise level of DNL lessthan or equal to 55 dBA.Shemya Isl<strong>and</strong> is very quiet due to the prevailing winds, <strong>and</strong> aircraft noiseis only heard when st<strong>and</strong>ing next to the airfield (EDAW, Inc., 1998—TripReport of visit to Shemya, Alaska, April 24–May 1).The closest civilian community is Atka, which is approximately 604kilometers (375 miles) from Shemya Isl<strong>and</strong>.3.10.1.3 Eielson AFB—NoiseThe area surrounding Eielson AFB is sparsely populated, <strong>and</strong> thus, basedon table 3.10-5, would be expected to have a background noise level ofDNL less than or equal to 55 dBA.Aircraft noise at Eielson AFB occurs during aircraft engine warm-up,maintenance <strong>and</strong> testing, taxiing, takeoffs, approaches, <strong>and</strong> l<strong>and</strong>ings.Noise contours for aircraft operations were modeled for the Eielson AFBAir Installation Compatible Use Zone (AICUZ) Study (U.S. Department ofthe Air Force, 1992) <strong>and</strong> updated in 1996 (Eielson AFB, 1998—Integrated Natural Resources Management Plan).As shown in figure 3.10-1, the contour with a DNL value of 65 dBA wasestimated to occur outside the base boundaries on l<strong>and</strong> off the northernend of Runway 31. The community of Moose Creek, which has lowdensity housing, does fall within this contour. The highest DNLs occuron the runway <strong>and</strong> taxiways <strong>and</strong> were measured at 85 dBA. The loudestnoise contours were estimated to have a DNL value of 85 dBA <strong>and</strong> tosurround the majority of the airfield’s primary surface. (Eielson AFB,1998—Integrated Natural Resources Management Plan)The main highway in the vicinity of Eielson AFB is the RichardsonHighway. The Richardson Highway, a four-lane divided highway,provides access to the base through the Hursey Gate. This gate is theonly operational gate at Eielson allowing access to <strong>and</strong> from theinstallation (Pacific Air Forces, 1998—Draft General Plan, Eielson AFB).The summer average daily traffic count for the Richardson Highway inthe vicinity of the base is 10,461 (Alaska Department of Transportation<strong>and</strong> Public Facilities, 1997—Annual Traffic Volume Report). Assuming aneven division of the traffic (i.e., 5,230 on each side of the dividedhighway), traffic noise levels of Leq(1 hour) equals 72 dBA, Leq(1 hour) equals 67dBA, <strong>and</strong> Leq(1 hour) equals 57 dBA are estimated to occur at approximatelyNMD Deployment Final EIS 3-299
Index MapEielsonAFBThe Alaska RailroadRichardson HighwayTransmitter Rd.AlaskaMooseCreek6570Manchu Trail75858085Quarry Rd.8075Tanana River2EXPLANATIONRoadsWater AreaRailroadsNORTHns_eafb_0013-300Installation BoundaryNoise Contour: Day Night Level (decibel A-weighted)Scale0 .8 1.6 Miles0 1.25 2.5 KilometersNMD Deployment Final EISNoise Zones, EielsonAir Force BaseAlaskaFigure 3.10-1
Chapter 3—Affected Environment15 meters (49 feet), 32 meters (105 feet), <strong>and</strong> 150 meters (492 feet)from the highway, respectively. For the purpose of analysis, the trafficspeed was assumed to be 89 kilometers (55 miles) per hour.Other than the community of Moose Creek, no noise sensitive receptorsare known to exist in the vicinity of Eielson AFB.3.10.1.4 Fort Greely—NoiseThe area surrounding Fort Greely is sparsely populated, <strong>and</strong> thus, basedon table 3.10-5, would be expected to have a background noise level ofDNL less than or equal to 55 dBA. However, under certain conditions, alow level droning noise from a nearby Alaska pipeline pumping stationcan be heard (EDAW, Inc., 1998—Trip Report of visit to Alaska, July 20–31). This noise comes from the pumping stations’ jet turbine engines<strong>and</strong> was estimated to be approximately 55 dBA.The principal sources of noise at Fort Greely are vehicular traffic <strong>and</strong>military activities, including aircraft overflight <strong>and</strong> firing of large <strong>and</strong> smallcaliber weapons. Frequency <strong>and</strong> duration of noise from military activitiesvaries as a factor of the irregular training schedules. (U.S. Department ofthe Army, 1997—EA, Construct Munitions Storage Facility, Cold RegionsTest Center, Bolio Lake, Fort Greely, Alaska)While intermittent, noise from military activity at Fort Greely can be fairlyloud. Some representative examples include weapons testing,helicopters, <strong>and</strong> maintenance equipment. Noise from weapons testingtypically ranges from 112 to 190 dBA. The noise levels on the groundfrom a helicopter at 460 meters (1,500 feet) <strong>and</strong> 76 meters (250 feet) ofaltitude are 79 dBA <strong>and</strong> 95 dBA, respectively. Maintenance equipment,such as the tracked vehicles used for trail maintenance, can generatenoise levels up to 105 dBA. (U.S. Department of the Army, 1980—FinalEIS Concerning Proposed L<strong>and</strong> Withdrawal for the 172 nd Infantry Brigade(Alaska) at Fort Greely)The main highways in the vicinity of Fort Greely are the RichardsonHighway <strong>and</strong> the Alaska Highway. Estimated traffic noise levels forthese two segments of highway are shown in table 3.10-6.No noise sensitive receptors are known to exist in the vicinity of FortGreely.3.10.1.5 Yukon Training Area (Fort Wainwright)—NoiseThe area surrounding the Yukon Training Area is sparsely populated, <strong>and</strong>thus, based on table 3.10-5, would be expected to have a backgroundnoise level of DNL less than or equal to 55 dBA.NMD Deployment Final EIS 3-301
Chapter 3—Affected EnvironmentTable 3.10-6: Estimated Traffic Noise Levels for the Fort Greely Area (1)Segment of HighwayAverage AnnualDaily TrafficCount (2)Distance at whichLeq(1 hour) = 72 dBAoccursin meters (feet)Distance at whichLeq(1 hour) = 67 dBAoccursin meters (feet)Distance at whichLeq(1 hour) = 57 dBAoccursin meters (feet)Richardson Highway inthe vicinity of FortGreelyAlaska Highway at theRichardson HighwayJunction1,750 9 (29) 19 (62) 87 (284)3,350 10 (33) 22 (72) 101 (334)(1)Based on the methodology of the U.S. Federal Highway Administration (1978) <strong>and</strong> assuming a traffic speed of 89 kilometers(55 miles) per hour for the Richardson Highway, 72 kilometers (45 miles) per hour for the Alaska Highway.(2)Alaska Department of Transportation <strong>and</strong> Public Facilities, 1997—Annual Traffic Volume Report.Note: dBA = decibel A-weighted, Leq = equivalent sound levelSources of noise in the Yukon Training Area include subsonic overflightsof aircraft (U.S. Department of the Air Force, 1995—Final ElS, AlaskaMilitary Operations Areas). Noise from intermittent ground-based militaryactivities, similar to those described in section 3.10.1.4 for Fort Greely,is also expected to occur. However, while the Yukon Training Area isexpected to experience intermittent loud noises from both airborne <strong>and</strong>ground-based military activities, it is expected to have an averagebackground noise of DNL less than 55 dBA (U.S. Department of the AirForce, 1995—Final EIS, Alaska Military Operations Areas).The main highway in the vicinity of the Yukon Training Area is theRichardson Highway. Traffic noise from the Richardson Highway isdiscussed above in association with Eielson AFB in section 3.10.1.3.No noise sensitive receptors are known to exist in the vicinity of theYukon Training Area (EDAW, Inc., 1998—Trip Report of visit to Alaska,July 20–31).3.10.2 NORTH DAKOTA INSTALLATIONS3.10.2.1 Cavalier AFS—NoiseThe area surrounding Cavalier AFS is sparsely populated <strong>and</strong> thus, basedon table 3.10-5, would be expected to have a background noise level ofDNL less than or equal to 55 dBA. Furthermore, no major sources ofnoise are known to exist on Cavalier AFS (EDAW, Inc., 1998—TripReport of visit to North Dakota, June 16–18); thus, traffic is expected tobe the main source of noise at Cavalier AFS <strong>and</strong> vicinity.3-302 NMD Deployment Final EIS
Chapter 3—Affected EnvironmentThe main highways in the vicinity of Cavalier AFS are State Highways ND5 <strong>and</strong> 32 <strong>and</strong> County Road 89. Estimated traffic noise levels for thesethree segments of highway are shown in table 3.10-7. The areas nearCavalier AFS with the highest traffic volumes are the cities of Cavalier,Walhalla, <strong>and</strong> Langdon. Table 3.10-8 shows the estimated traffic noiselevels for the main road segments in these cities.Table 3.10-7: Estimated Traffic Noise Levels for the Cavalier AFS Area (1)Segment of HighwayAverage AnnualDaily TrafficCount (2)Distance atwhich Leq(1 hour) =72 dBA occursin meters (feet)Distance at whichLeq(1 hour) = 67 dBAoccursin meters (feet)Distance at whichLeq(1 hour) = 57 dBAoccursin meters (feet)ND 5 in the vicinity ofCavalier AFSND 32 in the vicinityof Cavalier AFSCR 89 at the ND 5junction1,000 5 (16) 11 (36) 50 (164)550 3 (10) 7 (23) 33 (108)300 2 (6) 4 (13) 17 (56)(1)Based on the methodology of the U.S. Federal Highway Administration (1978) <strong>and</strong> assuming a traffic speed of 105kilometer (65 miles) per hour for ND 5 <strong>and</strong> ND 32, a traffic speed of 89 kilometers (55 miles) per hour for CR 89.(2)North Dakota Department of Transportation, 1996—Traffic Volume Map, Pembina County.Note: dBA = decibel A-weighted, Leq = equivalent sound levelTable 3.10-8: Estimated Traffic Noise Levels for Cities Near Cavalier AFS (1)Segment of HighwayAverageAnnualDaily TrafficCount (2)Distance at whichLeq(1 hour) = 72 dBAoccursin meters (feet)Distance at whichLeq(1 hour) = 67 dBAoccursin meters (feet)Distance at whichLeq(1 hour) = 57 dBAoccursin meters (feet)ND 5 in the city ofCavalierND 32 in the city ofWalhalla3,500 7 (23) 15 (49) 70 (230)1,400 4 (13) 8 (26) 38 (125)ND 5 in the city ofLangdon1,325 4 (13) 8 (26) 37 (121)(1)Based on the methodology of the U.S. Federal Highway Administration (1978) <strong>and</strong> assuming a traffic speed of 72kilometers per hour (45 miles per hour).(2)North Dakota Department of Transportation, 1996—Traffic Volume Map, Pembina County.Note: dBA = decibel A-weighted, Leq = equivalent sound levelThe only noise sensitive receptor noted in the vicinity of the Cavalier AFSwithin 305 meters (1,000 feet) is a farmhouse approximately 90 meters(300 feet) from the western edge of the site.NMD Deployment Final EIS 3-303
Chapter 3—Affected Environment3.10.2.2 Gr<strong>and</strong> Forks AFB—NoiseThe area surrounding Gr<strong>and</strong> Forks AFB has a population densityrepresentative of a lightly populated rural area, <strong>and</strong> thus, based on table3.10-5, would be expected to have a background noise level of DNL lessthan or equal to 55 dBA.Aircraft noise at Gr<strong>and</strong> Forks AFB occurs during aircraft engine warm-up,maintenance <strong>and</strong> testing, taxiing, takeoffs, approaches, <strong>and</strong> l<strong>and</strong>ings.Noise contours for aircraft operations were modeled for the AirInstallation Compatible Use Zone (AICUZ) Study (U.S. Air Force, 1995)for Gr<strong>and</strong> Forks AFB. As can be seen from figure 3.10-2, contours withDNL values of both 65 <strong>and</strong> 70 dBA were estimated to occur outside thebase boundaries on l<strong>and</strong> northwest of the base. The DNL equals 65 dBAcontour was also estimated to extent very slightly off the southern endof the base. As the l<strong>and</strong> use in these areas was designated as“Open/Agricultural/Low Density,” the study did not conclude that therewere any l<strong>and</strong> use incompatibility due to the estimated aircraft noise.The loudest on-base noise contours were estimated to have a DNL valueof 89 dBA <strong>and</strong> to occur at the southern end of the runway. (U.S. AirForce, 1995—AICUZ Study, Gr<strong>and</strong> Forks AFB)The main highways in the vicinity of Gr<strong>and</strong> Forks AFB are U.S. Highway2 <strong>and</strong> County Road 3B. Estimated traffic noise levels for segments ofthese highways are shown in table 3.10-9.Table 3.10-9: Estimated Traffic Noise Levels for the Gr<strong>and</strong> Forks AFB Area (1)Segment of HighwayAverageAnnual DailyTraffic Count (2)Distance at whichLeq(1 hour) = 72 dBAoccursin meters (feet)Distance at whichLeq(1 hour) = 67 dBAoccursin meters (feet)Distance at whichLeq(1 hour) = 57 dBAoccurs inmeters (feet)CR 3B in the vicinity ofGr<strong>and</strong> Forks AFB maingateU.S. 2 in the vicinityof Gr<strong>and</strong> Forks AFBmain gate (3)U.S. 2 in the vicinityof Gr<strong>and</strong> Forks AFBsecondary gate (3)7,000 15 (49) 31 (102) 145 (478)10,500 16 (52) 34 (112) 158 (518)5,900 11 (35) 23 (76) 108 (353)(1)Based on the methodology of the U.S. Federal Highway Administration (1978) <strong>and</strong> assuming a trafficspeed of 105 kilometer (65 miles) per hour for U.S. 2, 89 kilometers (55 miles) per hour for CR 3B.(2)North Dakota Department of Transportation, 1996—Traffic Volume Map, Gr<strong>and</strong> Forks County.(3)Traffic assumed divided evenly for divided highway, U.S. 2.Note: dBA = decibel A-weighted, Leq = equivalent sound level3-304 NMD Deployment Final EIS
Index MapGr<strong>and</strong> Forks AFBHoneyfordMekinockNorth Dakota2RiverTurtle65757065Turtle RiverState Park807570GRAND FORKSAFBArvilla2SaltwaterCoulee4Hazen BrookEmerado23EXPLANATIONInstallation BoundaryNoise Contour: Day-Night Equivalent Sound Level (A-weighted decibel)Noise Zones, Gr<strong>and</strong>Forks Air Force BaseNORTHns_gfafb_aicuzScale0 .95 1.9 Miles0 1.5 3 KilometersNMD Deployment Final EISNorth DakotaFigure 3.10-23-305
Chapter 3—Affected EnvironmentA house is located approximately 0.5 kilometer (0.3 mile) west of thebase’s southwest boundary (U.S. Geological Survey, 1963—ArvillaQuadrangle, North Dakota). Two churches <strong>and</strong> a portion of Emeradoincorporated l<strong>and</strong> is located within approximately 0.5 kilometer (0.3 mile)of the base’s southeast corner (U.S. Geological Survey, 1979—EmeradoQuadrangle, North Dakota). No other specific noise sensitive receptorshave been noted within approximately 0.8 kilometer (0.5 mile) of thebase. Beyond this, there is a small trailer park southeast of the base <strong>and</strong>the community of Emerado south of the base.3.10.2.3 <strong>Missile</strong> Site Radar—NoiseThe area surrounding the <strong>Missile</strong> Site Radar is sparsely populated, <strong>and</strong>,based on table 3.10-5, would be expected to have a background noiselevel of DNL less than or equal to 55 dBA.The main highways in the vicinity of <strong>Missile</strong> Site Radar are StateHighways ND 1 <strong>and</strong> 66 <strong>and</strong> County Road 26. Estimated traffic noiselevels for these segments of highway are shown in table 3.10-10.Table 3.10-10: Estimated Traffic Noise Levels for the <strong>Missile</strong> Site Radar Area (1)Segment of HighwayAverageAnnualDaily TrafficCount (2)Distance at whichLeq(1 hour) = 72 dBAoccursin meters (feet)Distance at whichLeq(1 hour) = 67 dBAoccursin meters (feet)Distance at whichLeq(1 hour) = 57 dBAoccursin meters (feet)ND 1 in the vicinityof <strong>Missile</strong> Site RadarND 66 in the vicinityof <strong>Missile</strong> Site RadarCR 26 in the vicinityof <strong>Missile</strong> Site Radar600 4 (12) 8 (26) 35 (115)280 2 (7) 5 (16) 21 (69)180 1 (4) 3 (10) 13 (43)(1)Based on the methodology of the U.S. Federal Highway Administration (1978) <strong>and</strong> assuming a traffic speed of105 kilometers (65 miles) per hour for ND 1 <strong>and</strong> ND 66, 89 kilometers (55 miles) per hour for CR 26.(2)North Dakota Department of Transportation, 1996—Traffic Volume Map, Cavalier County.dBA = decibel A-weighted, Leq = equivalent sound levelThe <strong>Missile</strong> Site Radar is located approximately 0.8 kilometer (0.5 mile)north of Nekoma. The closest residential units to the site are tworesidences within approximately 305 meters (1,000 feet) of the westernside of the site.3.10.2.4 Remote Sprint Launch Site 1—NoiseThe area surrounding Remote Sprint Launch Site 1 is sparsely populated,<strong>and</strong>, based on table 3.10-5, would be expected to have a backgroundnoise level of DNL less than or equal to 55 dBA.3-306 NMD Deployment Final EIS
Chapter 3—Affected EnvironmentThe main highways in the vicinity of Remote Sprint Launch Site 1 areState Highway ND 1 <strong>and</strong> County Roads 3 <strong>and</strong> 32. Estimated traffic noiselevels for these segments of highway are shown in table 3.10-11.Table 3.10-11: Estimated Traffic Noise Levels for theRemote Sprint Launch Site 1 Area (1)Segment of HighwayAverageAnnualDaily TrafficCount (2)Distance at whichLeq(1 hour) = 72 dBAoccursin meters (feet)Distance at whichLeq(1 hour) = 67 dBAoccursin meters (feet)Distance at whichLeq(1 hour) = 57 dBAoccursin meters (feet)ND 1 in the vicinityof Remote SprintLaunch Site 1CR 3 in the vicinityof Remote SprintLaunch Site 1CR 32 in the vicinityof Remote SprintLaunch Site 1510 3 (10) 7 (23) 32 (105)280 2 (7) 4 (13) 17 (56)65 1 (3) 1 (3) 7 (23)(1)Based on the methodology of the U.S. Federal Highway Administration (1978) <strong>and</strong> assuming a traffic speedof 105 kilometers (65 miles) per hour for ND 1, a traffic speed of 89 kilometers (55 miles) per hour for CRs 3<strong>and</strong> 32.(2)North Dakota Department of Transportation, 1996—Traffic Volume Map, Ramsey County.Note: dBA = decibel A-weighted, Leq = equivalent sound levelThe closest noise sensitive receptor to the site is a residential unitapproximately 1.6 to 2.4 kilometers (1 to 1.5 miles) northeast of thesite.3.10.2.5 Remote Sprint Launch Site 2—NoiseThe area surrounding Remote Sprint Launch Site 2 is sparsely populated,<strong>and</strong> based on table 3.10-5, would be expected to have a backgroundnoise level of DNL less than or equal to 55 dBA.The main highways in the vicinity of Remote Sprint Launch Site 2 areState Highway ND 1 <strong>and</strong> County Road 55. Estimated traffic noise levelsfor these segments of highway are shown in table 3.10-12.The closest noise sensitive receptor to the site is a residential unitapproximately 1 kilometer (0.7 mile) east of the site.NMD Deployment Final EIS 3-307
Chapter 3—Affected EnvironmentTable 3.10-12: Estimated Traffic Noise Levelsfor the Remote Sprint Launch Site 2 Area (1)Segment ofHighwayAverageAnnual DailyTrafficCount (2)Distance at whichLeq(1 hour) = 72 dBAoccursin meters (feet)Distance at whichLeq(1 hour) = 67 dBAoccursin meters (feet)Distance at whichLeq(1 hour) = 57 dBAoccursin meters (feet)ND 1 in thevicinity ofRemote SprintLaunch Site 2CR 55 in thevicinity ofRemote SprintLaunch Site 2575 4 (13) 7 (23) 34 (112)150 1 (3 ) 3 (10) 11 (36)(1) Based on the methodology of the U.S. Federal Highway Administration (1978) <strong>and</strong> assuming a traffic speedof 105 kilometers (65 miles) per hour for ND 1, a traffic speed of 89 kilometers (55 miles) per hour for CR55.(2)North Dakota Department of Transportation, 1996—Traffic Volume Map, Cavalier County.Note: dBA = decibel A-weighted, Leq = equivalent sound level3.10.2.6 Remote Sprint Launch Site 4—NoiseThe area surrounding Remote Sprint Launch Site 4 is sparsely populated,<strong>and</strong>, based on table 3.10-5, would be expected to have a backgroundnoise level of DNL less than or equal to 55 dBA.The main highways in the vicinity of Remote Sprint Launch Site 4 areState Highways ND 1 <strong>and</strong> 17 <strong>and</strong> County Roads 9 <strong>and</strong> 22. Estimatedtraffic noise levels for these segments of highway are shown in table3.10-13.Fairdale, approximately 3 kilometers (2 miles) from the site, is thelocation with the closest noise sensitive receptors.3-308 NMD Deployment Final EIS
Chapter 3—Affected EnvironmentTable 3.10-13: Estimated Traffic Noise Levelsfor the Remote Sprint Launch Site 4 Area (1)Segment ofHighwayAverageAnnual DailyTraffic Count (2)Distance at whichLeq(1 hour) = 72 dBAoccursin meters (feet)Distance at whichLeq(1 hour) = 67 dBAoccursin meters (feet)Distance at whichLeq(1 hour) = 57 dBAoccursin meters (feet)ND 1 in thevicinity ofRemote SprintLaunch Site 4ND 17 in thevicinity ofRemote SprintLaunch Site 4CR 9 in thevicinity ofRemote SprintLaunch Site 4490 3 (10) 7 (23) 31 (102)450 3 (10) 6 (20) 30 (98)170 1 (3) 3 (10) 12 (39)CR 22 in thevicinity ofRemote SprintLaunch Site 4200 1 (3) 3 (10) 13 (43)(1)Based on the methodology of the U.S. Federal Highway Administration (1978) <strong>and</strong> assuming a traffic speedof 105 kilometers (65 miles) per hour for NDs 1 <strong>and</strong> 7, a traffic speed of 89 kilometers (55 miles) per hour forCRs 9 <strong>and</strong> 22.(2)North Dakota Department of Transportation, 1996—Traffic Volume Maps, Walsh <strong>and</strong> Ramsey Counties.Note: dBA = decibel A-weighted, Leq = equivalent sound levelNMD Deployment Final EIS 3-309
Chapter 3—Affected Environment3.11 SOCIOECONOMICSSocioeconomics describes a community by examining its social <strong>and</strong>economic characteristics. Several demographic variables are analyzed inorder to characterize the community, including population size, the means<strong>and</strong> amount of employment, <strong>and</strong> income creation. In addition,socioeconomics analyzes the fiscal condition of local government <strong>and</strong> theallocation of the assets of the community, such as its schools, housing,public services, <strong>and</strong> healthcare facilities.3.11.1 ALASKA INSTALLATIONS3.11.1.1 Clear AFS—SocioeconomicsClear AFS is in Denali Borough in Interior Alaska. It is within the cityboundary of Anderson, an Alaskan 2 nd Class City, 126 kilometers (78miles) southwest of Fairbanks <strong>and</strong> 459 kilometers (285 miles) north ofAnchorage. The Air Force Station was founded in 1961 as a ballisticearly warning site a year before Anderson was incorporated.Clear AFS is in a sparsely populated region that, until the late 1960s, hada rudimentary road network. Over 90 percent of the residents ofAnderson are employed by Clear AFS or other Federal <strong>and</strong> state entities.For the purposes of this analysis the economic ROI is considered tocoincide mainly with the Denali Borough boundary within which severalsmall centers of population exist. These include Anderson, Cantwell,Ferry, Healy, Lignite, <strong>and</strong> McKinley Park. In addition, the ROI includesNenana, which is outside the Denali Borough, but which is close enoughto Clear AFS to merit inclusion.PopulationDenali Borough was incorporated in 1990, when the U.S. Census of thatyear counted 1,764 residents. The certified 1997 population estimatefor the borough shows an increase of 5.6 percent to 1,864 people. Thepopulation of Alaska grew by 10.7 percent during the same period.An increasing proportion of the borough’s citizens live within the sixcommunities listed above; 88 percent in 1990, growing to 92 percent in1997. Over two-thirds live in the cities of Anderson <strong>and</strong> Healy. Figure3.11-1 illustrates the distribution of the 1997 population among the sixcommunities that compose Denali Borough.While Healy grew by 154 people between 1990 <strong>and</strong> 1997, Anderson lost69 residents. Nenana grew from a population of 393 in 1990 to 435 in1998.3-310 NMD Deployment Final EIS
Chapter 3—Affected EnvironmentFigure 3.11-1: Urban Distribution of the Population of Denali BoroughMcKinley Park11%Lignite8%Anderson30%Healy37%Ferry4%Cantwell10%Source: Alaska Department of Community <strong>and</strong> Regional Affairs, 1998-Denali Borough, CommunityAlaska Natives comprised 4.7 percent of the population of DenaliBorough in 1990. Figure 3.11-2 illustrates the varying densities ofAlaska Natives among the communities of Denali Borough. The nativepopulation of Nenana represented over 47 percent of the town'spopulation in 1990.EmploymentDenali Borough had 759 jobs in 1990, almost half of which were at, ordependent on, Clear AFS. The other main employers in the borough arethe Usibelli Coal Mine, Golden Valley Electric Association <strong>and</strong> the localSchool District. Tourism-related industry also accounts for a significantproportion of local jobs. The community of McKinley Park, for instance,is at the entrance to Denali National Park, the home of Mount McKinley,the highest mountain in North America. The Park provided virtually allMcKinley Park’s 84 jobs in 1990.Highway tourism, based on the George Parks Highway that linksAnchorage to Fairbanks, is important to communities such as Cantwell,Healy, <strong>and</strong> Lignite.NMD Deployment Final EIS 3-311
Chapter 3—Affected EnvironmentFigure 3.11-2: Alaska Natives as a Proportion of the Total Population inDenali Borough <strong>and</strong> its Communities, 199025.0%20.0%Percent15.0%10.0%5.0%0.0%DenaliBoroughAnderson Cantwell Ferry Healy Lignite McKinleyParkSource: Alaska Department of Community <strong>and</strong> Regional Affairs, 1998—Denali Borough, CommunityInformation Summary.The Usibelli Coal Mine is Alaska’s largest coal mining operation <strong>and</strong> islocated at Healy. It employs 145 people <strong>and</strong> supplies over 800,000 tonsof coal a year to the local power company, the University of Alaska <strong>and</strong>the military. Coal is also exported to the Far East. Figure 3.11-3illustrates the distribution of jobs in Denali Borough in 1990.Figure 3.11-3: The 1990 Distribution of Jobs in Denali BoroughMcKinley Park11%Lignite5%Healy26%Anderson49%Ferry2%Cantwell7%Source: Alaska Department of Community <strong>and</strong> Regional Affairs, 1998—Denali Borough,Community Information Summary.3-312 NMD Deployment Final EIS
Chapter 3—Affected EnvironmentIn 1990, 127 people in Nenana's population were employed, with overone half occupying Federal, state, or local jobs. Other significant sourcesof employment included Yutana Barge Lines <strong>and</strong> various local touristdestinations. Unemployment in 1990 reached 17.5 percent.The overall unemployment rate in Denali Borough was 10.1 percent in1990, with 35.6 percent of the total population stating that they wereeconomically inactive. These figures, however, masked extremes withinthe borough communities, where unemployment rates were as low as 3.9percent in Healy <strong>and</strong> as high as 34.6 percent in Cantwell <strong>and</strong> 39.1percent in Ferry. These extremes underline the statistical impact of verylow regional population counts.Retail SalesRetailing in Denali Borough is carried out on a very limited basis,providing for basic needs. According to the 1992 Census of Retail Trade(U.S. Bureau of the Census, 1998), there were eight retailingestablishments in the borough. In aggregate, they employed 20 people<strong>and</strong> had an annual turnover of about $3.2 million. They included a foodstore, two gas stations, three restaurant/bars <strong>and</strong> two miscellaneousstores. Fairbanks is the nearest variety retailing center to the ROI.Nenana has a small amount of retailing that in 1990 employed 20 people,suggesting that it matches Denali Borough with respect to this activity.IncomeIn 1990, Denali Borough had a median household income of $47,884;exactly half the households had an income higher than this figure, whilehalf had household incomes lower. Ten percent of the residents of DenaliBorough were living below the poverty level in 1990. Nenana had amedian income of $27,292 <strong>and</strong> 10.4 percent of its population werebelow the poverty level in 1990. Figure 3.11-4 illustrates the range ofmedian household income in Denali Borough.Figure 3.11-5 shows the proportion of residents who have incomesbelow the poverty level in each community.Housing, Education, <strong>and</strong> HealthDenali Borough had 937 housing units, according to the 1990 Census.Of these, about 41 percent were vacant. While 75 percent of DenaliBorough’s housing stock was located in its six constituent communities,over half the vacant homes were found outside these communities.Figure 3.11-6 shows the distribution of housing stock throughout DenaliBorough <strong>and</strong> its communities.NMD Deployment Final EIS 3-313
Chapter 3—Affected EnvironmentFigure 3.11-4: Median Household Income in Denali Borough <strong>and</strong> itsCommunities, 1990$60,000Median Household Income ($)$50,000$40,000$30,000$20,000$10,000$0DenaliBoroughAnderson Cantwell Ferry Healy Lignite McKinleyParkSource: Alaska Department of Community <strong>and</strong> Regional Affairs, 1998—Denali Borough, CommunityInformation Summary.Figure 3.11-5: The Proportion of Residents Earning Below Poverty LevelIncomes in Denali Borough <strong>and</strong> its Communities, 199016.0%14.0%12.0%Percent10.0%8.0%6.0%4.0%2.0%0.0%DenaliBoroughAnderson Cantwell Ferry Healy Lignite McKinleyParkSource: Alaska Department of Community <strong>and</strong> Regional Affairs, 1998—Denali Borough, CommunityInformation Summary.3-314 NMD Deployment Final EIS
Chapter 3—Affected EnvironmentFigure 3.11-6: The Distribution of the Housing Stock ofDenali Borough, 1990Ex-community25%Anderson19%Cantwell9%McKinley Park15%Ferry4%Lignite5%Healy23%Source: Alaska Department of Community <strong>and</strong> Regional Affairs, 1998—Denali Borough,Community Information Summary.Nenana had an additional 190 housing units in 1990. About 26 percentwere vacant.Figure 3.11-7 illustrates the extent to which vacant housing is moreprevalent outside the established communities of Denali Borough.There are three schools in Denali Borough <strong>and</strong> two in Nenana. They havean aggregate roll of about 700 students. Denali Borough's schools arelocated in Anderson, Cantwell, <strong>and</strong> Healy.Health care in Denali Borough <strong>and</strong> Nenana is provided at clinics or on anauxiliary basis by one or other of the emergency services. The nearesthospital to Denali Borough is in Fairbanks (see section 3.11.1.3). Thereare clinics at Nenana, Anderson, Cantwell, <strong>and</strong> Healy. Clear AFS has aclinic that serves the Anderson community.Fiscal ConditionsIn 1997, Denali Borough raised almost $2.8 million of operating revenuesfrom various sources including taxes <strong>and</strong> external state funds. Animportant source of tax revenue was the 7 percent bed tax levied ontemporary accommodation within the borough. About 55 percent of theoperating revenue was applied to local education. The remaining 45percent of revenues was split among government administration (10percent), public safety (about 4 percent), public services (about 3percent), <strong>and</strong> surplus funds (28 percent).NMD Deployment Final EIS 3-315
Chapter 3—Affected EnvironmentFigure 3.11-7: The Ratio of Vacant to Occupied Housing in theCommunities of Denali Borough, 1990100%80%Percent60%40%OccupiedVacant20%0%AndersonCantwellFerryHealyLigniteMcKinley ParkEx-communitySource: Alaska Department of Community <strong>and</strong> Regional Affairs, 1998—Denali Borough, CommunityInformation Summary.Nenana raised almost $3.1 million in operating revenues in 1997, over 70percent of which was obtained from state <strong>and</strong> Federal sources. Nenanadoes not levy a bed tax. About 73 percent of revenues was spent onlocal education services.3.11.1.2 Eareckson AS—SocioeconomicsEareckson AS is an isolated self-contained military installation. It has nosurrounding communities. There is, therefore, no socioeconomicenvironment at Eareckson AS affected by this action.3.11.1.3 Eielson AFB—SocioeconomicsEielson AFB is in Fairbanks North Star Borough, where it is an importantcomponent of the local economy. Though unincorporated, thecommunity of Eielson AFB is one of the larger centers within a sparselypopulated region. Fairbanks North Star Borough is in the heart of InteriorAlaska <strong>and</strong> represents the second largest center of population in thestate. For the purposes of this analysis, Fairbanks North Star Borough<strong>and</strong> its constituent communities form the ROI for Eielson AFB. Theconstituent communities of Fairbanks North Star Borough include College,Eielson AFB, Ester, Fairbanks, Fox, Moose Creek, North Pole, PleasantValley, Salcha, <strong>and</strong> Two Rivers.3-316 NMD Deployment Final EIS
Chapter 3—Affected EnvironmentPopulationBy Alaskan st<strong>and</strong>ards, Fairbanks has been a long-established center ofpopulation within the state. About 20 percent of Alaska’s populationlived in the borough in 1960. Figure 3.11-8 illustrates the growth inpopulation of Fairbanks since 1960.Figure 3.11-8: Population Change in Fairbanks North Star Borough1960-1997People90,00080,00070,00060,00050,00040,00030,00020,00010,00001960 1970 1980 1990 1997FairbanksNorth StarBoroughSource: Alaska Department of Community <strong>and</strong> Regional Affairs, 1998—Fairbanks North Star Borough,Community Information Summary.An index was created to illustrate the rate at which Alaska has grown incomparison to Fairbanks North Star Borough, since 1960. The index wasset at 100 in 1960. By 1997 the rate of growth for Alaska had movedthe index to over 250, compared to Fairbanks North Star Borough, whichwas a little below 200 (figure 3.11-9).By 1997, about 13 percent of Alaska’s population lived in FairbanksNorth Star Borough.The proportion of the borough’s population living in the 10 communitieslisted above fell from 65.7 percent in 1990 to 63.6 percent in 1997. Allof the 10 communities experienced an increase in population with theexception of Eielson AFB, which lost almost 6 percent of its populationduring that period. Figure 3.11-10 illustrates the distribution ofpopulation among the 10 communities.Fairbanks North Star Borough, with 6.9 percent of its population beingAlaskan Natives, is considered primarily non-native. The largestconcentration of Alaskan Natives is in Fairbanks, where 9.2 percent of itspopulation have this ethnic origin.NMD Deployment Final EIS 3-317
Chapter 3—Affected EnvironmentFigure 3.11-9: Population Rate of Growth Index Comparing Alaska <strong>and</strong>Fairbanks North Star Borough 1960-1997300250Index200150100AlaskaFairbanks North StarBorough5001960 1970 1980 1990 1997Source: Alaska Department of Community <strong>and</strong> Regional Affairs, 1998—Fairbanks North StarBorough, Community Information Summary.Figure 3.11-10: Urban Distribution of the Population of Fairbanks NorthStar BoroughMoose Creek1%Fox1%Pleasant Valley1%North Pole3%Salcha1%Two Rivers1%College23%Eielson AFB9%Ester0%Fairbanks60%Source: Alaska Department of Community <strong>and</strong> Regional Affairs, 1998—Fairbanks North StarBorough, Community Information Summary.3-318 NMD Deployment Final EIS
Chapter 3—Affected EnvironmentEmploymentFairbanks is the largest employment center in Fairbanks North StarBorough, accounting for about 61 percent of the borough’s 39,160 jobsin 1990. These jobs reflect the role of Fairbanks as the service center forInterior Alaska, with jobs being concentrated in the various arms ofgovernment, communication, transportation, manufacturing, financial,<strong>and</strong> medical services.College, the borough’s second community (though in reality a suburb ofFairbanks), mostly supplies the workforce for the nearby University ofAlaska at Fairbanks. Eielson AFB is the third largest concentration ofemployment in the borough. About 50 percent of all the jobs inFairbanks <strong>and</strong> its surrounding communities—including Eielson AFB—are ingovernment services. Figure 3.11-11 shows the distribution of jobsthroughout the borough.Figure 3.11-11: Urban Distribution of Jobs in Fairbanks North StarBorough, 1990Moose Creek1%Fox0%Pleasant Valley1%North Pole3%Salcha1% Two Rivers1%College22%Eielson AFB10%Fairbanks61%Ester0%Source: Alaska Department of Community <strong>and</strong> Regional Affairs, 1998—Fairbanks North Star Borough,Community Information Summary.The overall unemployment rate in Fairbanks North Star Borough in 1990was 10.2 percent. Almost 30 percent of the population claimed, at thetime, to be economically inactive. Of the larger population centers,College had the lowest unemployment rate at 7.8 percent, while EielsonAFB had the highest at 13 percent.NMD Deployment Final EIS 3-319
Chapter 3—Affected EnvironmentRetail SalesFairbanks North Star Borough is an important retail center in the state,accounting for about 14 percent of Alaska’s annual retail sales <strong>and</strong>employing over 5,400 people. It is second only to Anchorage in thisrespect. Of the borough’s 432 retail establishments in 1992 (U.S.Bureau of the Census, 1998—1992 Census of Retail Trade, DenaliCounty Equivalent, Alaska), about 63 percent were located in Fairbanks.There were about $690 million of annual retail sales in Fairbanks NorthStar Borough in 1992.IncomeThe median income of the borough was $37,468 in 1990. Figure3.11-12 shows the variations in median household income among thevarious borough communities. Moose Creek had the lowest medianhousehold income in 1990, with Pleasant Valley having the lowestproportion of its population living beneath the poverty level (figure3.11-13).Figure 3.11-12: Median Household Income in Fairbanks North StarBorough <strong>and</strong> its Surrounding Communities, 1990$60,000$50,000$40,000$30,000$20,000$10,000$0FairbanksNorthStarCollegeEielsonAFBEsterFairbanksMedian Household Income($)FoxMooseCreekNorthPolePleasantValleySalchaTwoRiversSource: Alaska Department of Community <strong>and</strong> Regional Affairs, 1998—Fairbanks North Star Borough,Community Information Summary.Housing, Education, <strong>and</strong> HealthFairbanks North Star Borough had 31,823 housing units, according to the1990 census. About 16 percent, or 5,130, were vacant. Figure 3.11-14illustrates the distribution of the borough’s housing stock, with 37percent being outside the 10 communities that compose the borough.3-320 NMD Deployment Final EIS
Chapter 3—Affected EnvironmentFigure 3.11-13: Proportion of Residents Living Beneath the PovertyLevel, 199014.0%12.0%10.0%8.0%6.0%4.0%2.0%0.0%FairbanksNorthStarCollegeEielsonAFBEsterFairbanksFoxMooseCreekPercentNorthPolePleasantValleySalchaTwoRiversSource: Alaska Department of Community <strong>and</strong> Regional Affairs, 1998—Fairbanks North Star Borough,Community Information Summary.Figure 3.11-14: The Distribution of the Housing Stock of FairbanksNorth Star Borough, 1990North Pole2%Pleasant Valley1%Salcha1%Fox0%Moose Creek1%Two Rivers1%Ex-community37%Fairbanks40%Ester0%Eielson AFB4%College13%Source: Alaska Department of Community <strong>and</strong> Regional Affairs, 1998—Fairbanks North Star Borough,Community Information Summary.The lowest housing vacancy rates in 1990 were in the largestcommunities of Fairbanks, College, <strong>and</strong> Eielson AFB (figure 3.11-15).There are 32 schools of various sizes in Fairbanks North Star Borough.They had an aggregate student roll of 16,430 in 1997. About 65 percentof these students attended the 21 schools located in Fairbanks. Most ofthe remaining students in the borough attend school at either Eielson AFBor at the five schools located in North Pole. The schools in the FairbanksNorth Star Borough currently have sufficient student capacity (C. Henry,1999—comment provided at NMD Fairbanks Public Hearing).NMD Deployment Final EIS 3-321
Chapter 3—Affected EnvironmentFairbanks, with its three hospitals, provides the majority of health carefacilities in the borough. Currently, the Fairbanks Memorial Hospital isoperating at approximately 54 percent of capacity. In addition, 11 newmental heath beds along with an exp<strong>and</strong>ed mental health unit wereadded in November 1999. This hospital serves as the major provider forInterior Alaska (R. Solie, 1999—written comment provided during NMDDraft EIS comment period). Its only other significant facility is located atFort Wainwright, which operates Bassett Army Hospital. Eielson AFBoperates a clinic to serve its immediate community.Figure 3.11-15: The Ratio of Vacant to Occupied Housing in theCommunities of Fairbanks North Star Borough, 1990100%80%Percent60%40%20%OccupiedVacant0%Ex-communityCollegeEielson AFBEsterFairbanksFoxMoose CreekNorth PolePleasantValleySalchaTwo RiversSource: Alaska Department of Community <strong>and</strong> Regional Affairs, 1998—Fairbanks North Star Borough,Community Information Summary.Fiscal ConditionsIn 1997, Fairbanks North Star Borough raised almost $185.1 million inoperating revenues from various sources including an 8 percent bed tax.The largest borough expenditure was on education, which accounted for60 percent of the total operating <strong>and</strong> capital budget.The municipality of Fairbanks also collects <strong>and</strong> spends tax revenue. In1996, this amounted to a little over $81 million collected <strong>and</strong> $60.65million expended. Public services including electric, phone, <strong>and</strong> waterutilities represented the largest expenditures, along with public safety.Fairbanks levies an 8 percent bed tax, a 5 percent alcohol tax, <strong>and</strong> an 8percent tobacco tax.3-322 NMD Deployment Final EIS
Chapter 3—Affected Environment3.11.1.4 Fort Greely—SocioeconomicsFort Greely is in Interior Alaska, on the Richardson Highway. The nearestcity to Fort Greely is Delta Junction, about 16 kilometers (10 miles) northof the base. The area is sparsely populated with an economy dependenton Fort Greely, state employment, some agriculture <strong>and</strong> Alyeska PipelineServices.For the purpose of this analysis, the ROI is assumed to include FortGreely, Delta Junction, <strong>and</strong> Big Delta. Fort Greely was established in1942 at the same time that the Alaska Highway was being constructed.The Fort started arctic training towards the end of the decade <strong>and</strong> in sodoing became a major contributor to the local economy. In July 1995,the BRAC recommended realignment of Fort Greely with a scheduledcompletion by 2002.At the time of the realignment announcement, there were about 750 jobsat Fort Greely, representing more than half the total employment for thearea (Delta/Greely Community Coalition, 1998—Final Reuse Plan). Atpresent, Fort Greely supports two tenants: the Cold Regions Test Center<strong>and</strong> the Northern Warfare Training Center.A Reuse Plan, funded by Office of Economic Adjustment, Department of<strong>Defense</strong>, was produced in order to help the local community prepare forthe realignment of Fort Greely. The Plan identifies two alternatives forthe reuse of Fort Greely <strong>and</strong> builds on two previous planning studies.Alternative One (the preferred alternative) is characterized as a mixed useindustrial complex anchored by military, institutional, <strong>and</strong> industrial uses.The latter uses are considered the most compatible with a continuedmilitary presence at Fort Greely. The institutional use would be amedium security correctional facility. The Reuse Plan estimates that thepreferred alternative would generate between 490 <strong>and</strong> 600 jobs at FortGreely.The second alternative would represent a minimum threshold of postoperations at Fort Greely, without a major institutional facility acting asan anchor. This alternative would generate 30 to 66 jobs.PopulationThe ROI is part of a wider region known as the Southeast FairbanksCensus Area. In 1997, it was estimated that the Census Area had apopulation of 5,563. The population of the ROI at that time was 2,059,or 37 percent of the Census Area.Figure 3.11-16 shows an index of growth that compares the Census Areawith Alaska. Population growth in the Census Area was affected by thereduction in personnel at Fort Greely so that, unlike most of the rest of thestate, its population fell to pre-1980 levels between 1990 <strong>and</strong> 1997.NMD Deployment Final EIS 3-323
Chapter 3—Affected EnvironmentThe impact of the downsizing of Fort Greely on the region’s population isfurther emphasized in figures 3.11-17 <strong>and</strong> 3.11-18. Fort Greely’s shareof the Census Area population clearly falls between 1990 <strong>and</strong> 1997.The Alaska Native population of the ROI in 1990 was relatively small,with Fort Greely having the lowest density of the three communities at 1percent. Delta Junction <strong>and</strong> Big Delta had Alaska Native populations of4.4 percent <strong>and</strong> 4 percent respectively.Figure 3.11-16: Index of Population Growth, Alaska <strong>and</strong> SoutheastFairbanks Census Area, 1970-1997250200Index15010050Southeast FairbanksCensus AreaAlaska01970 1980 1990 1997Source: Alaska Department of Labor, 1998—Alaska Population OverviewFigure 3.11-17: Distribution of the Population of Southeast FairbanksCensus Area, 1990Delta Junction11%Rest of SEFairbanks CA60%Fort Greely22%Big Delta7%Sources: Alaska Department of Community <strong>and</strong> Regional Affairs, 1998—Fairbanks, CommunityInformation Summary.; U.S. Bureau of the Census, 1995—Alaska Population.3-324 NMD Deployment Final EIS
Chapter 3—Affected EnvironmentFigure 3.11-18: Distribution of the Population of Southeast FairbanksCensus Area, 1997Delta Junction16%Fort Greely12%Rest of SEFairbanks CA63%Big Delta9%Sources: Alaska Department of Community <strong>and</strong> Regional Affairs, 1998—Fairbanks, CommunityInformation Summary; U.S. Bureau of the Census, 1995—Alaska Population.EmploymentFort Greely is estimated to account for 50 percent of all the employmentin its surrounding communities, emphasizing the lack of diversity in theeconomy of the ROI. The School District is the second largestgovernment employer in the area, along with state <strong>and</strong> Federal highwaymaintenance services. The highway also provides some tourism-relatedemployment during the summer months. Figure 3.11-19 shows thedistribution of jobs among the three communities that compose the ROI.Unemployment in 1990 varied significantly among the three ROIcommunities. Figure 3.11-20 illustrates the difference.In the case of Big Delta, its extremely low unemployment rate wasparalleled by its comparatively high percentage of economically inactiveresidents; 54 percent of its 1990 population were characterized as such.Retail SalesRetailing within the ROI is limited to small convenience stores, usuallycombined with a gas station, <strong>and</strong> tourism-related retailing, including bars<strong>and</strong> restaurants. The nearest variety retailing center to the ROI isFairbanks.NMD Deployment Final EIS 3-325
Chapter 3—Affected EnvironmentFigure 3.11-19: Distribution of Jobs within the Urban CommunitiesSurrounding Fort Greely, 1990Big Delta13%Delta Junction31%Fort Greely56%Source: Alaska Department of Community <strong>and</strong> Regional Affairs, 1998—Fort Greely, Delta Junction,<strong>and</strong> Big Delta, Community Information Summaries.Figure 3.11-20: Unemployment Rates in the Communities Comprisingthe ROI, 199015.0%Percent10.0%5.0%0.0%Delta Junction Fort Greely Big DeltaAlaska Department of Community <strong>and</strong> Regional Affairs, 1998—Fort Greely, Delta Junction, <strong>and</strong> BigDelta, Community Information Summaries.IncomeBig Delta had the highest median income among the three communitiesthat are closest to Fort Greely. It also had the proportion of residents3-326 NMD Deployment Final EIS
Chapter 3—Affected Environmentliving below the poverty level. Figures 3.11-21 <strong>and</strong> 3.11-22 showmedian household income <strong>and</strong> the proportion of residents with householdincomes below the poverty level.Figure 3.11-21: Median Household Income in the CommunitiesSurrounding Fort Greely, 1990Median Household Income ($)$35,000$30,000$25,000$20,000$15,000$10,000$5,000$0Delta Junction Fort Greely Big DeltaSource: Alaska Department of Community <strong>and</strong> Regional Affairs, 1998—Fort Greely, Delta Junction,<strong>and</strong> Big Delta, Community Information Summaries.Figure 3.11-22: The Proportion of Residents Earning Below Poverty LevelIncomes in the Communities Surrounding Fort Greely, 199025.0%20.0%Percent15.0%10.0%5.0%0.0%Delta Junction Fort Greely Big DeltaSource: Alaska Department of Community <strong>and</strong> Regional Affairs, 1998—Fort Greely, Delta Junction,<strong>and</strong> Big Delta, Community Information Summaries.Housing, Education, <strong>and</strong> HealthThere were 956 homes in the three communities surrounding Fort Greelyin 1990. A little over 25 percent were vacant. This aggregate figure,however, masks a significant variation in housing stock <strong>and</strong> vacancyNMD Deployment Final EIS 3-327
Chapter 3—Affected Environmentrates among the three communities. Figures 3.11-23 <strong>and</strong> 3.11-24illustrate the variations.Figure 3.11-23: The Distribution of Housing Among the CommunitiesSurrounding Fort GreelyBig Delta19%Delta Junction43%Fort Greely38%Source: Alaska Department of Community <strong>and</strong> Regional Affairs, 1998—Fort Greely, Delta Junction,<strong>and</strong> Big Delta, Community Information Summaries.Figure 3.11-24: The Ratio of Vacant to Occupied Housing in theCommunities Surrounding Fort Greely, 1990100%80%Percent60%40%20%OccupiedVacant0%Delta Junction Fort Greely Big DeltaSource: Alaska Department of Community <strong>and</strong> Regional Affairs, 1998—Fort Greely, Delta Junction,<strong>and</strong> Big Delta, Community/Information Summaries.3-328 NMD Deployment Final EIS
Chapter 3—Affected EnvironmentThere are five schools in the ROI—four in Delta Junction, with a studentroll of 491, <strong>and</strong> one at Fort Greely, with 307 pupils.Delta Junction has a family medical center, <strong>and</strong> Fort Greely has a clinic.The nearest hospital is 153 kilometers (95 miles) away at Fairbanks.Fiscal ConditionDelta Junction raised $150,000 of revenue in 1997 from local servicecharges <strong>and</strong> external, state sources. It spent almost $184,000 in thesame year, the majority on public safety, roads, parks, <strong>and</strong> recreation.Delta Junction does not levy a bed tax on temporary accommodation.3.11.1.5 Yukon Training Area (Fort Wainwright)—SocioeconomicsThe socioeconomic affected environment for the Yukon Training Area isthe same as that of Eielson AFB, as outlined in 3.11.1.3.3.11.2 NORTH DAKOTA INSTALLATIONS3.11.2.1 Cavalier AFS—SocioeconomicsCavalier AFS is in Pembina County, in northeastern North Dakota,adjacent to the Canadian border. Cavalier AFS is in a rural region withscattered urban centers of population, where individuals will, typically,travel long distances to their workplace. This analysis, therefore, hasdefined an economic region—or ROI—that includes Cavalier, Pembina,Ramsey, <strong>and</strong> Walsh counties. This area also coincides broadly with thenorthernmost part of the United States Red River Basin economic region.It represents the primary drive-to-work area for Cavalier AFS, though it isacknowledged that, in this part of the United States, some employeesregularly drive to their workplace from farther afield. Figure 3.11-25illustrates the inter-relationship of the four counties. It uses 1990 censusdata to create a matrix of those employees resident <strong>and</strong> working withintheir county, those working outside their county, <strong>and</strong> those living outsidethe ROI who travel to it for work.The table shows that in the cases of Cavalier, Pembina, <strong>and</strong> Walshcounties, about the same number of workers traveled to work betweenthe counties (612) as traveled to them from counties outside the ROI(613). Ramsey County attracted 342 workers from other counties,compared to the 40 workers it attracted from within the ROI.PopulationLike much of North Dakota, the ROI is a sparsely inhabited rural areawhich, since the 1950s, has experienced a chronic decline in population.The total 1996 population of the four counties ROI was 39,265. Thisequaled 6.1 percent of the population of North Dakota for the same year.NMD Deployment Final EIS 3-329
Chapter 3—Affected EnvironmentThe largest centers of population in the ROI are Devils Lake in RamseyCounty <strong>and</strong> Grafton in Walsh County. These cities had populations in1995 of 7,687 <strong>and</strong> 5,323 respectively.Figure 3.11-25: Commuting Patterns in the ROIDestination of workerOrigin of workerCavalier Pembina Ramsey WalshOthercountiesTotalworkingoutsidecounty ofresidenceCavalier 2049 153 24 24 0 201Pembina 17 3560 0 266 59 342Ramsey 26 0 5239 39 327 5631Walsh 21 131 16 5563 187 355Othercounties42 260 342 311 955Total living outside theircounty of employment106 544 382 640 573 16411Source: Goodman, 1996—The Economic Health of North DakotaThe total population of North Dakota fell by 2.8 percent between the1980 <strong>and</strong> 1990 censuses. The population for the state in 1996,however, showed a reversal of this trend, with a small but perceptibleincrease of a little over 4,700 people. This increase was the result ofgrowth in the more urbanized counties of North Dakota.In contrast, the counties in the predominantly rural ROI experienced avaried, but continuous <strong>and</strong> disproportionately rapid rate of declinebetween 1980 <strong>and</strong> 1997. Figure 3.11-26 illustrates the long-term trendin population decline in the ROI. The change in population of CavalierCounty was the most precipitous, falling almost 33 percent between1980 <strong>and</strong> 1997. Pembina <strong>and</strong> Walsh counties fell by just over 17.1percent <strong>and</strong> 11 percent respectively, while Ramsey County declined by alittle over 5 percent. The differing rates of population decline areillustrated by creating an index of population change. Figure 3.11-27considers the state <strong>and</strong> each of the counties in the ROI, <strong>and</strong> takes 1980as the common starting point, with an index of 100. The index clearlyshows the faster population decline of Cavalier County, <strong>and</strong> the declineof the ROI as a whole, when compared to the State of North Dakota.The 1990 Census showed that North Dakota had a population density of3.6 people per square kilometer (9.3 people per square mile). See figure3.11-28. The least dense county within the ROI was Cavalier County,with 1.6 people per square kilometer (4.1 people per square mile).Ramsey <strong>and</strong> Walsh counties had population densities a little above the3-330 NMD Deployment Final EIS
Chapter 3—Affected Environmentstate average, <strong>and</strong> Pembina slightly below. In 1990, the United Stateshad a population density of 27.2 people per square kilometer (70.3people per square mile).Figure 3.11-26: Population Change in the Four-County ROI700006000050000People400003000020000Population Change1000001950 1960 1970 1980 1990 1996 2000 2005 2010Sources: Coon <strong>and</strong> Leistritz, 1998—The State of North Dakota: Economic, Demographic, PublicService, <strong>and</strong> Fiscal Conditions; U.S. Bureau of the Census, 1998—North Dakota PopulationEstimates.Figure 3.11-27: Population Index, Comparing the Four-County Regionwith North Dakota120100Index806040CavalierPembinaRamseyWalshNorth Dakota2001980 1990 1996 2000 2005 2010Sources: Coon <strong>and</strong> Leistritz, 1998—The State of North Dakota: Economic, Demographic, PublicService, <strong>and</strong> Fiscal Conditions; U.S. Bureau of the Census, 1998—North Dakota PopulationEstimates.NMD Deployment Final EIS 3-331
Chapter 3—Affected EnvironmentFigure 3.11-28: 1990 Population Density150130110People per Square Mile9070503010-10Cavalier Pembina Ramsey Walsh North Dakota United StatesSource: U.S. Bureau of the Census, 1996—L<strong>and</strong> Area, Population, <strong>and</strong> Density for States <strong>and</strong>Counties.In 1994, the labor force resident in the ROI was 20,222. Thisrepresented 6 percent of North Dakota’s labor force. Unemployment inthe ROI was 5.6 percent or 1,143 persons, compared to 3.9 percent forNorth Dakota.EmploymentThe number of jobs in the ROI rose from about 23,150 in 1970 to25,534 in 1993, an increase of a little over 10 percent. Figure 3.11-29shows, however, that this increase was neither consistent throughout theperiod nor experienced in equal measure in all of the counties thatcompose the ROI. Ramsey <strong>and</strong> Walsh counties accounted for themajority of jobs in the ROI, while Cavalier suffered the most significantlevel of decline. Figure 3.11-30, by indexing the job numbers, illustratesthese differences further. Significantly, not one of the counties in theROI was able to create jobs at the rate experienced in the state as awhole. In contrast, North Dakota’s main urban centers of populationwere able to post year-on-year increases in jobs.Apart from agriculture, the main sources of employment in the ROI wereretailing <strong>and</strong> services. In recent years agriculture has been declining <strong>and</strong>retailing <strong>and</strong> services have been increasing.3-332 NMD Deployment Final EIS
Chapter 3—Affected EnvironmentFigure 3.11-29: Jobs in the ROI900080007000Jobs6000500040003000CavalierPembinaRamseyWalsh2000100001970 1980 1990 1993Source: Goodman, 1996—The Economic Health of North DakotaFigure 3.11-30: Index of Job Change in the ROI160140120Index1008060CavalierPembinaRamseyWalshNorth Dakota402001970 1980 1990 1994Source: Goodman, 1996—The Economic Health of North DakotaNMD Deployment Final EIS 3-333
Chapter 3—Affected EnvironmentDespite its decline in recent decades, agriculture continues to maintain itsrole as a regional wealth-provider <strong>and</strong> economic engine. North Dakota isin the Northern Plains farm production region, as classified by the U.S.Department of Agriculture. The region is characterized by short growingseasons <strong>and</strong> the predominance of winter <strong>and</strong> spring wheat. In 1995,North Dakota ranked first among the top 10 wheat producing states, interms of cash receipts for that commodity. Approximately 41,000people were employed in agricultural production in North Dakota in 1993.The counties of the ROI accounted for 16.7 percent of that state’s farmearnings for 1990 (U.S. Bureau of the Census, 1995—County <strong>and</strong> CityData Book, 1994, North Dakota Counties). The dominance of agriculturewithin the ROI is further illustrated by the contribution of farm earningsto total earnings. In 1990, farm earnings were 12.4 percent of totalearnings in North Dakota. The equivalent statistic for agriculture’scontribution to earnings in Cavalier County was almost 52 percent, 34percent for Pembina County, 20 percent for Ramsey County, <strong>and</strong> 28percent for Walsh County.The outlook for agriculture in the ROI is mixed. On the one h<strong>and</strong>, farmslocated in the Red River Valley have access to some of the most fertilel<strong>and</strong> in the nation, allowing them to grow a diverse array of crops.Conversely, a greater need for mechanization, driven by diminishingFederal subsidies <strong>and</strong> increased competition, is accelerating the trend forlarger farms with fewer owners. While productivity per farmed acre maybe increasing in the ROI, the small, local communities that have alwaysdepended on the locally-spent farmer’s dollar are suffering from a declinein retail sales. This in turn has led to migration from the countryside tothe urban centers by younger people <strong>and</strong> those who have depended on avibrant, locally-based farming community for their livelihood.IncomeBetween 1970 <strong>and</strong> 1994, real per capita income in the ROI increased inline with that of North Dakota. Pembina County led the ROI in increasedper capita income, as illustrated by figure 3.11-31. However, it isimportant to point out that North Dakota ranks 48 th out of 50 states whencomparing average weekly wage for covered employment (Department ofEconomic Development <strong>and</strong> Finance, 1998—North Dakota Details forBusiness <strong>and</strong> Industry). While wages form one component of per capitaincome, wage comparisons are a useful economic indicator. OnlyPembina County, among those in the ROI, showed a higher than averagewage rate for 1995 (North Dakota State Data Center, 1998—AverageWage per Job in North Dakota, 1991-1996).3-334 NMD Deployment Final EIS
Chapter 3—Affected EnvironmentFigure 3.11-31: Per Capita Income, 1970-1994Income ($)1000090008000700060005000400030002000100001970 1980 1990 1994CavalierPembinaRamseyWalshNorth DakotaSource: Goodman, 1996—The Economic Health of North DakotaRetail SalesIn a sparsely populated rural area like the ROI, retailing is a fundamentalbuilding block of the local community, providing jobs, wealth, <strong>and</strong> a vitalservice to those unable or unwilling to travel long distances to shop. TheROI has experienced a trend consistent with other parts of North Dakota;a decline in its retail centers, as people have migrated from thecountryside to the cities. Devils Lake is the only surviving significantcomparative retail center in the ROI, with the smaller communities ofLangdon <strong>and</strong> Cavalier able to offer only limited shopping facilities. Figure3.11-32 illustrates the change in real retail expenditure in the ROI since1980. Figure 3.11-33 indexes retail sales in order to compare changeswith the state trend. Retail sales levels in the ROI have recovered sincethe recession of the early 1990s, but to varying extents. Figure 3.11-33shows that only Ramsey County, in which Devils Lake is situated, showssales growth greater than the state average.While the town of Devils Lake appears to exhibit healthy retail salesincreases, a significant proportion of recent growth has been attributed tothe indirect effects of the substantial flood remediation program beingcarried out around the lake itself. The importance of Devils Lake toretailing in Ramsey County <strong>and</strong> the ROI is further illustrated by figure3.11-34. Per capita retail sales are higher in Ramsey County than in thestate as a whole.NMD Deployment Final EIS 3-335
Chapter 3—Affected EnvironmentFigure 3.11-32: Retail Sales in the ROI, 1980-199480,000,00070,000,00060,000,000Sales ($)50,000,00040,000,00030,000,000CavalierPembinaRamseyWalsh20,000,00010,000,00001980 1985 1990 1994Source: Goodman, 1996—The Economic Health of North DakotaFigure 3.11-33: Index of Change in Real Retail Sales in the ROI,1980-1994120100Index806040CavalierPembinaRamseyWalshNorth Dakota2001980 1985 1990 1994Source: Goodman, 1996-The Economic Health of North Dakota3-336 NMD Deployment Final EIS
Chapter 3—Affected EnvironmentFigure 3.11-34: Per Capita Retail Sales in the ROI, 1980-199410,0009,0008,000Sales ($)7,0006,0005,0004,0003,0002,0001,000CavalierPembinaRamseyWalshNorth Dakota01980 1984 1990 1994Source: Goodman, 1996—The Economic Health of North DakotaHousing, Education, <strong>and</strong> HealthThe ROI experienced a substantial investment in housing, education, <strong>and</strong>healthcare facilities in preparation for the Anti-Ballistic <strong>Missile</strong> program ofthe early 1970s. Temporary <strong>and</strong> permanent housing was installed in thecommunities surrounding Cavalier AFS during that period. While much ofthe temporary accommodation has been cleared, trailer courts, concretepads, <strong>and</strong> capped services still exist in Langdon. At least one localmanufacturer of assembled homes has increased its productioncapabilities since the anti-ballistic missile program <strong>and</strong> is able to meet thesmall local dem<strong>and</strong> for housing construction with relative ease. Inaddition, the ROI’s stock of vacant housing has increased over the last 2decades as a result of the population migrating to major urban centerssuch as Gr<strong>and</strong> Forks <strong>and</strong> Fargo. The four-county ROI had a stock ofslightly over 19,000 housing units in 1990. Almost 3,000 were vacant.This represented a vacancy rate of about 15 percent, compared to theNorth Dakota rate of 12.8 percent. This is illustrated in figure 3.11-35.The Langdon public school district covers about 1,683 square kilometers(650 square miles) <strong>and</strong> includes facilities designed for a relatively largenumber of pupils. The schools in Langdon, which serve grades K-12,have a current roll of 650 pupils <strong>and</strong> capacity for approximately 1,000.Revenue per pupil in 1997 was $4,666, compared to a state average of$4,833 per pupil.NMD Deployment Final EIS 3-337
Chapter 3—Affected EnvironmentFigure 3.11-35: Housing Vacancy Rates in the ROI in 199070006000Housing Units5000400030002000OccupiedVacant10000Cavalier Pembina Ramsey WalshSource: Coon <strong>and</strong> Leistritz, 1998—The State of North Dakota: Economic, Demographic, PublicService, <strong>and</strong> Fiscal ConditionsThe local health facilities within the ROI support a provider ratio of 1 to1,500 people. Federal st<strong>and</strong>ards call for a ratio of 1 to 3,500. TheLangdon hospital is funded by its own foundation <strong>and</strong> was characterizedas well equipped for a rural facility. Langdon Hospital is about a 2-hourdrive from more extensive medical facilities in Gr<strong>and</strong> Forks.Fiscal ConditionsThe North Dakota system of local government has been described ascomplicated because it comprises "townships within counties, citieswithin counties, <strong>and</strong> special districts overlaying townships, cities <strong>and</strong>counties" (Coon <strong>and</strong> Leistritz, 1998—The State of North Dakota:Economic, Demographic, Public Service <strong>and</strong> Fiscal Conditions). Figure3.11-36 shows the taxable value of each of the four counties in the ROI.The 1996 taxable value of property in the ROI was $88,786,232, or 8percent, of the state’s total taxable value for that year. Localgovernment expenditure per head varied throughout the ROI, withCavalier County having the highest taxable value per capita (see figure3.11-37), but the lowest per capita local government expenditure (seefigure 3.11-38). These factors correlate strongly with Cavalier Countybeing the smallest <strong>and</strong> fastest shrinking in terms of population <strong>and</strong> havingthe highest proportion of taxable value in agricultural l<strong>and</strong> (see figure3.11-39).3-338 NMD Deployment Final EIS
Chapter 3—Affected EnvironmentFigure 3.11-36: Total Taxable Property Value in the ROI 199630,000,00025,000,000Property Value ($)20,000,00015,000,00010,000,0005,000,0000Cavalier Pembina Ramsey WalshSource: Coon <strong>and</strong> Leistritz, 1998—The State of North Dakota: Economic, Demographic, PublicService, <strong>and</strong> Fiscal Conditions.Figure 3.11-37: Per Capita Local Property Tax 1996350300Per Capita Tax ($)250200150100500Cavalier Pembina Ramsey Walsh North DakotaSource: Coon <strong>and</strong> Leistritz, 1998—The State of North Dakota: Economic, Demographic, PublicService, <strong>and</strong> Fiscal Conditions.NMD Deployment Final EIS 3-339
Chapter 3—Affected EnvironmentFigure 3.11-38: Per Capita Local Government Expenditure 19922500Per Capita Expenditures ($)2000150010005000Cavalier Pembina Ramsey Walsh North DakotaSource: Coon <strong>and</strong> Leistritz, 1998—The State of North Dakota: Economic, Demographic, PublicService, <strong>and</strong> Fiscal Conditions.Figure 3.11-39: Agriculture L<strong>and</strong> as a Percent of Total Taxable Value 1996Percent80706050403020100Cavalier Pembina Ramsey Walsh North DakotaSource: Coon <strong>and</strong> Leistritz, 1998—The State of North Dakota: Economic, Demographic, PublicService, <strong>and</strong> Fiscal Conditions.3.11.2.2 Gr<strong>and</strong> Forks AFB—SocioeconomicsGr<strong>and</strong> Forks AFB is about 24 kilometers (15 miles) west of the city ofGr<strong>and</strong> Forks, in Gr<strong>and</strong> Forks County, situated in the Red River Basin innortheast North Dakota. While the region as a whole is rural in character,the city of Gr<strong>and</strong> Forks is a relatively important urban population centerthat dominates the local economy. For the purposes of this analysis, a3-340 NMD Deployment Final EIS
Chapter 3—Affected Environmentwider economic region has been defined to include Gr<strong>and</strong> Forks, Nelson,Steele, Traill, <strong>and</strong> Walsh counties in the state of North Dakota. This ROIis the main drive-to-work area for Gr<strong>and</strong> Forks AFB, though it isrecognized that some base employees will travel from further afield.PopulationThe total estimated 1996 population of the five county ROI was 99,197.This was equivalent to 15.4 percent of the 1996 estimated population ofNorth Dakota. The largest center of population in the ROI is Gr<strong>and</strong> Forks,in Gr<strong>and</strong> Forks County, which in 1996 had an estimated population of50,675, or over half that of the ROI. The overwhelming influence ofGr<strong>and</strong> Forks as the major urban population center within the ROI isillustrated in figure 3.11-40.Figure 3.11-40: Population Change in the Five-County ROI900008000070000People600005000040000300002000010000Gr<strong>and</strong> ForksNelsonSteeleTraillWalsh01950 1960 1970 1980 1990 1996 2000 2005 2010Sources: Goodman, 1996—The Economic Health of North Dakota; U.S. Bureau of the Census, 1998—North Dakota Population Estimates.With the significant exception of Gr<strong>and</strong> Forks County, the North Dakotacounties in the predominantly rural ROI experienced a varied, butcontinuous <strong>and</strong> disproportionate rate of decline between 1980 <strong>and</strong> 1997.In contrast, Gr<strong>and</strong> Forks County had the third largest growth inpopulation in North Dakota between 1980 <strong>and</strong> 1990. Demographicforecasts for Gr<strong>and</strong> Forks County to 2010 show an average annualincrease in population of just over 400 persons. The historic changes inthe populations of Nelson <strong>and</strong> Steele counties were the greatest, bothfalling about 27 percent between 1980 <strong>and</strong> 1997. Traill <strong>and</strong> WalshNMD Deployment Final EIS 3-341
Chapter 3—Affected Environmentcounties declined by just over 10 percent <strong>and</strong> 11 percent respectively.These rates of decline are forecast to level off over the next 15 years.Figure 3.11-41 is a 1980-based index of the population of the countieswithin the ROI <strong>and</strong> the State of North Dakota. The disproportionatelyrapid rate of growth of Gr<strong>and</strong> Forks County when compared to NorthDakota is clearly illustrated. In contrast, the decline of the otherremaining counties within the ROI is also evident. The ROI, therefore, issubject to two significant trends—a chronic decline in its rural population,<strong>and</strong> the corollary, a growth or stabilization of the population in its mainurban center.Figure 3.11-41: Index of Population Change, Comparing the Five-CountyRegion with North Dakota140120Index100806040Gr<strong>and</strong> ForksNelsonSteeleTraillWalshNorth Dakota2001980 1990 1996 2000 2005 2010Source: Goodman, 1996—The Economic Health of North Dakota; U.S. Bureau of the Census, 1998—North Dakota Population Estimates.The 1990 Census revealed that North Dakota had a population density of3.6 people per square kilometer (9.3 people per square mile) as shown infigure 3.11-42. The least dense county within the ROI is Steele County,with 1.3 people per square kilometer (3.4 persons per square mile), whileTraill <strong>and</strong> Walsh counties had population densities a little above the stateaverage, <strong>and</strong> Nelson County slightly below. Gr<strong>and</strong> Forks County had apopulation density of 19 people per square kilometer (49.2 people persquare mile), substantially higher than the state average, but stillsignificantly lower than the average population density of the United3-342 NMD Deployment Final EIS
Chapter 3—Affected EnvironmentStates, which in 1990 was 27.1 people per square kilometer (70.3people per square mile).Figure 3.11-42: 1990 Population Density150130110People per Square Mile9070503010-10Gr<strong>and</strong> Forks Nelson Steele Traill Walsh NorthDakotaUnitedStatesSource: U.S. Bureau of the Census, 1996—L<strong>and</strong> Area, Population, <strong>and</strong> Density for States <strong>and</strong>Counties.EmploymentThe total employment for the ROI in 1993 was 62,952. Gr<strong>and</strong> ForksCounty had the largest number of employees, with 46,567 representingabout 74 percent of the ROI’s jobs. Figure 3.11-43 illustrates thedominance of Gr<strong>and</strong> Forks, since 1970, as a center of employment, aswell as the extent of its growth. Figure 3.11-44, an index ofemployment, shows that the rate of growth of employment in Gr<strong>and</strong>Forks County was slightly faster than the state’s. Employment growthwas relatively flat, or declined, in the remaining counties of the ROI.The three most important employment sources in the ROI have beenGovernment, Services, <strong>and</strong> Retail & Wholesale. Gr<strong>and</strong> Forks AFB hasbeen the main Federal employer in the region. In 1972, militaryemployment accounted for about 23 percent of all the nonfarm jobs inGr<strong>and</strong> Forks County. As the local economy <strong>and</strong> population of Gr<strong>and</strong>Forks has exp<strong>and</strong>ed <strong>and</strong> defense cutbacks have reduced military jobs,this proportion of nonfarm employment has fallen to about 12 percent.Nevertheless, military jobs amounted to over 5,400 in Gr<strong>and</strong> ForksCounty in 1993.NMD Deployment Final EIS 3-343
Chapter 3—Affected EnvironmentFigure 3.11-43: Jobs in the ROIJobs5000045000400003500030000250002000015000100005000Gr<strong>and</strong> ForksNelsonSteeleTraillWalsh01970 1980 1990 1993Source: Goodman, 1996—The Economic Health of North DakotaFigure 3.11-44: Index of Job Change in the ROI180160140Index1201008060Gr<strong>and</strong> ForksNelsonSteeleTraillWalshNorth Dakota402001970 1980 1990 1994Source: Goodman, 1996—The Economic Health of North Dakota3-344 NMD Deployment Final EIS
Chapter 3—Affected EnvironmentThe dominance of Services <strong>and</strong> Retail & Wholesale jobs typifies the roleof Gr<strong>and</strong> Forks as a regional center providing its surrounding communitieswith a wide range of shopping <strong>and</strong> professional <strong>and</strong> technical services.Although the ROI includes four rural counties, agriculture in 1993accounted for fewer than 10 percent of its jobs, further underlining thedominance of Gr<strong>and</strong> Forks in the local economy. The trends affectingfarming in North Dakota are likely to lead to a further decline in theimportance of the agriculture sector in the ROI. Farms in North Dakota<strong>and</strong> the ROI have been falling in number but increasing in size <strong>and</strong> in theirrequirement for costly capital equipment, as world agricultural marketshave become more competitive <strong>and</strong> the Federal government’s subsidy offarming has been reduced.The Impact of the Gr<strong>and</strong> Forks Flood on Employment <strong>and</strong> WagesA study by the North Dakota Job Service opens by stating that "The RedRiver flood of 1997 had a significant <strong>and</strong> widespread impact upon Gr<strong>and</strong>Forks County, <strong>and</strong> in particular the city of Gr<strong>and</strong> Forks, in terms ofemployment <strong>and</strong> wage levels" (Job Service North Dakota, 1998—Gr<strong>and</strong>Forks County Impact of Spring Flood Second Quarter 1997). The studygoes on to point out that actual employment <strong>and</strong> wages in the county fellshort of forecasts by 10.7 percent <strong>and</strong> 8.1 percent, respectively.The flood’s impact on each of the industrial sectors that composed thelocal economy varied substantially. The local construction industryexperienced above-forecast wage rates <strong>and</strong> an influx of employees fromother industries who were seeking higher wages. It is expected thatthese trends will continue for several years, as rebuilding projects end<strong>and</strong> new ones begin. Employment in the retail trade <strong>and</strong> serviceindustries was between 14.7 percent <strong>and</strong> 15.9 percent lower thanforecast. Lower paid jobs within these sectors have not been refilled,particularly in the eating <strong>and</strong> drinking sectors. The local wholesale sectorsuffered losses in wages <strong>and</strong> employment because its customers—theretailers—were hardest hit by the flood. Many manufacturing firms werelocated in flooded areas <strong>and</strong> as a result lost output, released employees,<strong>and</strong> lowered wages.IncomeFigure 3.11-45 shows the change in real per capita income in the ROI<strong>and</strong> in North Dakota. With the exception of Nelson <strong>and</strong> Steele counties,real per capita income in the ROI followed the state trend, increasingrapidly between 1970 <strong>and</strong> 1990 <strong>and</strong> then less rapidly between 1990 <strong>and</strong>1994. Nelson <strong>and</strong> Steele counties are the smallest within the ROI <strong>and</strong>have experienced the most rapid population decline since the 1950s. Itis likely, therefore, that the apparent volatility of real per capita income isNMD Deployment Final EIS 3-345
Chapter 3—Affected Environmenta reflection of this declining <strong>and</strong> aging population, rather than anincreasing level of average wealth.Figure 3.11-45: Per Capita Income, 1970-19941000090008000Income ($)7000600050004000300020001000Gr<strong>and</strong> ForksNelsonSteeleTraillWalshNorth Dakota01970 1980 1990 1994Source: Goodman, 1996—The Economic Health of North DakotaFigure 3.11-46 shows the components of Total Personal Income (TPI) foreach of the counties within the ROI in 1993. Gr<strong>and</strong> Forks County hasthe largest proportion of its TPI in the form of wages, unlike NelsonSteele, <strong>and</strong> Traill. Nelson <strong>and</strong> Steele counties have the highestproportion of transfer payments as a component of their TPI, supportingthe contention that wealth in these counties is concentrating among asmaller number of older people.Retail SalesFigure 3.11-47 <strong>and</strong> figure 3.11-48 illustrate the dominance of Gr<strong>and</strong> Forksas a retailing center within the ROI. While Walsh County reported realsales of a little over $44 million in 1994, Gr<strong>and</strong> Forks County had sales ofalmost $370 million, or 13.5 percent of all of North Dakota’s retail salesfor that year. The index of real retail sales shows clearly the year-on-yeargrowth generated by Gr<strong>and</strong> Forks, compared to a much smaller growth ratefor the state <strong>and</strong> a decline in the other counties within the ROI. Nelson<strong>and</strong> Steele experienced the most precipitous falls in real retail sales duringthe period, once again highlighting the sharp contrast between theexp<strong>and</strong>ing urban population centers of North Dakota <strong>and</strong> the chronicdecline being experienced in rural areas <strong>and</strong> their communities.3-346 NMD Deployment Final EIS
Chapter 3—Affected EnvironmentFigure 3.11-46: The Components of Total Personal IncomePercent of Total Income8070605040302010Earnings1993Dividends,Interest,Rent 1993TransferPayments19930Gr<strong>and</strong>ForksNelson Steele Traill Walsh NorthDakotaSource: Goodman, 1996—The Economic Health of North DakotaFigure 3.11-47: Index of the Change in Retail Sales in the ROI,1980-1994160140Index120100806040Gr<strong>and</strong> ForksNelsonSteeleTraillWalshNorth Dakota2001980 1985 1990 1994Source: Goodman, 1996—The Economic Health of North DakotaNMD Deployment Final EIS 3-347
Chapter 3—Affected EnvironmentFigure 3.11-48: Retail Sales in the ROI, 1980-199460,000,000400,000,000Retail Sales ($) Other Counties50,000,00040,000,00030,000,00020,000,00010,000,000350,000,000300,000,000250,000,000200,000,000150,000,000100,000,00050,000,000Retail Sales ($) Gr<strong>and</strong> Forks County01980 1985 1990 19940Nelson Steele Traill Walsh Gr<strong>and</strong> ForksSource: Goodman, 1996—The Economic Health of North DakotaHousing, Education <strong>and</strong> HealthHousing construction in Gr<strong>and</strong> Forks has been subject to several peaks<strong>and</strong> troughs since 1970. While single family homes constituted the mainbody of the housing stock before that date, apartments <strong>and</strong>condominiums have become increasingly prevalent in recent years. Muchof this latter trend has been attributed to the accommodation dem<strong>and</strong>s ofGr<strong>and</strong> Forks AFB between 1970 <strong>and</strong> 1980.There were 40,520 housing units in the ROI in 1990. The overallpercentage vacancy rate was 9.4 percent, or 3,793 units. Figure3.11-49 illustrates the dominance of Gr<strong>and</strong> Forks in the ROI’s housingmarket.The full impact of the Gr<strong>and</strong> Forks flood on the population <strong>and</strong> housing ofGr<strong>and</strong> Forks has yet to be determined. Many basement apartments havebeen removed from the housing stock because of flood damage, <strong>and</strong>many more are occupied by the transient population of constructionworkers. The immediate 4 percent drop in the post-flood school rolls (asa result of people moving away from the area) suggests that the supplyof housing units in Gr<strong>and</strong> Forks will exceed dem<strong>and</strong> for several years tocome. The true extent of permanent out-migration, however, will not beknown until the transient construction workers leave the area at the closeof their contracts.3-348 NMD Deployment Final EIS
Chapter 3—Affected EnvironmentFigure 3.11-49: Housing Vacancy Rates in the ROI in 19903000025000Housing Units200001500010000OccupiedVacant50000Gr<strong>and</strong> Forks Nelson Steele Traill WalshSource: Coon <strong>and</strong> Leistritz, 1998—The State of North Dakota: Economic, Demographic, PublicService, <strong>and</strong> Fiscal Conditions.Housing in other parts of the ROI is subject to the trend commonthroughout rural North Dakota—the migration of people away from thecountryside is leaving under-populated communities in which vacantproperty is readily available.The Metro Forks Community Profile (Metropolitan Planning Organization,1996) identified 13 elementary schools, 4 junior high schools, <strong>and</strong> 3 highschools with a combined enrollment of 9,670 pupils. In addition, Gr<strong>and</strong>Forks AFB provided on-base tertiary education facilities for about 1,070students per term at Lake Region Junior College, Park College, EmbryRiddle Aeronautical University, <strong>and</strong> Central Michigan University.The Red River flood closed 17 of Gr<strong>and</strong> Forks’ schools, with 7 requiringsubstantial refurbishment. It is expected that all will be reopened.Schools in the remainder of the ROI have been experiencing falling rolls<strong>and</strong> are therefore operating at below capacity.Health services in the ROI are centered in Gr<strong>and</strong> Forks, which has fiveclinics <strong>and</strong> two hospitals. There were 305 hospital beds, 140 medicaldoctors, <strong>and</strong> 8 independent medical practices serving the wider Gr<strong>and</strong>Forks region of 300,000 residents in December 1996 (Gr<strong>and</strong> ForksChamber of Commerce, 1996—Forks Facts). This region covered all ofthe ROI.NMD Deployment Final EIS 3-349
Chapter 3—Affected EnvironmentFiscal ConditionsFigure 3.11-50 shows the taxable value of each of the five counties inthe ROI. The 1996 taxable value of property in the ROI was$161,132,417, or 14.5 percent of the State of North Dakota’s totaltaxable value of property for that year. Nelson <strong>and</strong> Steele counties hadthe highest per capita local property taxes as well as the highestexpenditure per head as shown in figures 3.11-51 <strong>and</strong> 3.11-52. Thisphenomenon was a function of their decline in population <strong>and</strong> their highproportion of agricultural l<strong>and</strong> illustrated in figure 3.11-53.Figure 3.11-50: Total Taxable Property Value in the ROI 1996120,000,000100,000,000Property Value ($)80,000,00060,000,00040,000,00020,000,0000Gr<strong>and</strong> Forks Nelson Steele Traill WalshSource: Coon <strong>and</strong> Leistritz, 1998—The State of North Dakota: Economic, Demographic, PublicService, <strong>and</strong> Fiscal Conditions.3.11.2.3 <strong>Missile</strong> Site Radar—SocioeconomicsThe socioeconomic affected environment for <strong>Missile</strong> Site Radar is thesame as that described for Cavalier AFS in section 3.11.2.1.3.11.2.4 Remote Sprint Launch Site 1—SocioeconomicsThe socioeconomic affected environment for Remote Sprint Launch Site1 is the same as that described for Cavalier AFS in section 3.11.2.1.3.11.2.5 Remote Sprint Launch Site 2—SocioeconomicsThe socioeconomic affected environment for Remote Sprint Launch Site2 is the same as that described for Cavalier AFS in section 3.11.2.1.3-350 NMD Deployment Final EIS
Chapter 3—Affected EnvironmentFigure 3.11-51: Per Capita Local Property Tax 1996450400350Per Capita Tax ($)300250200150100500Gr<strong>and</strong> Forks Nelson Steele Traill WalshSource: Coon <strong>and</strong> Leistritz, 1998—The State of North Dakota: Economic, Demographic, PublicService, <strong>and</strong> Fiscal Conditions.Figure 3.11-52: Per Capita Local Government Expenditure 19922500Per Capita Expenditures ($)2000150010005000Gr<strong>and</strong> Forks Nelson Steele Traill WalshSource: Coon <strong>and</strong> Leistritz, 1998—The State of North Dakota: Economic, Demographic, PublicService, <strong>and</strong> Fiscal Conditions.NMD Deployment Final EIS 3-351
Chapter 3—Affected EnvironmentFigure 3.11-53: Agriculture L<strong>and</strong> as a Percent of TotalTaxable Value 199610090807060Percent50403020100Gr<strong>and</strong> Forks Nelson Steele Traill WalshSource: Coon <strong>and</strong> Leistritz, 1998—The State of North Dakota: Economic, Demographic, PublicService, <strong>and</strong> Fiscal Conditions.3.11.2.6 Remote Sprint Launch Site 4—SocioeconomicsThe socioeconomic affected environment for Remote Sprint Launch Site4 is the same as that described for Cavalier AFS in section 3.11.2.1.3-352 NMD Deployment Final EIS
Chapter 3—Affected Environment3.12 TRANSPORTATIONThe evaluation of existing roadway <strong>and</strong> airport conditions is based oncapacity, which reflects the ability of a given roadway or airport toaccommodate vehicular dem<strong>and</strong> <strong>and</strong> volume.Traffic volumes are typically reported in Annual Average Daily Traffic(AADT) counts, which is the total volume of vehicles per day averagedfor an entire year. These counts are provided upon request from theDepartment of Transportation. A comparison of a roadway’s volume toits capacity is expressed in terms of levels of service (LOS). There aresix levels of service, ranging from A to F, with LOS A representing thebest operating conditions <strong>and</strong> LOS F the worst (table 3.12-1).Table 3.12-1: Roadway Levels of ServiceLevel ofServiceDescriptionABCDEFPrimarily free flow operations with users almost completely unhindered intheir ability to maneuver within the traffic streamReasonably free flow operations with users' ability to maneuver within thetraffic stream only slightly restrictedStable flow with users' freedom to maneuver within the traffic streamnoticeably restricted; noticeable increase in driver tensionHigh density, but stable flow; speed <strong>and</strong> freedom to maneuver are morenoticeably limited; reduced level of driver comfort <strong>and</strong> convenienceUnstable flow; operating conditions at capacity, reduced speeds,maneuverability extremely limited, <strong>and</strong> extremely poor level of drivercomfort <strong>and</strong> convenienceBreakdown in vehicular flow with traffic dem<strong>and</strong> exceeding capacity;unstable stop-<strong>and</strong>-go trafficSource: Compiled from National Research Council, 1994—Highway Capacity Manual.3.12.1 ALASKA INSTALLATIONSRoadway travel in Alaska is limited, with the only highways being in thesoutheastern quarter of the state. Due to the limited amount of roadways,the traffic volume in sparsely populated areas tends to be greater thanexperienced in the lower 48 states. The summer months experience thehighest amount of traffic, due to tourism <strong>and</strong> good weather. When available,the summer average daily traffic counts were used to determine thelevel of service. Figure 3.12-1 shows the highways within central Alaska.Given the vast area of Alaska <strong>and</strong> limited road network, aircraft providean alternate means of transportation. This section addresses airportspotentially used by the NMD program. Issues related to airspace usearound potential NMD locations are discussed in section 3.3, Airspace.NMD Deployment Final EIS 3-353
Index MapArctic CircleJames Dalton Hwy.YukonRiverAlaskaCircle2LivengoodSteese Highway6ToftyFoxCollegeFairbanks3NenanaTananaNorth PoleYukon Training AreaEielson AFBAndersonClear AFSRiver2Delta Jct.Alaska HighwayFort GreelyDenaliNational ParkHwy.2Mt. McKinleyEXPLANATIONTransAlaska PipelineAlaska RailroadCityMilitary Installation3GeorgeParksTo AnchorageRichardson Hwy.To ValdezCentral AlaskaHighwaysAlaskaNORTHtp_fair_0013-354Not to ScaleNMD Deployment Final EISFigure 3.12-1
Chapter 3—Affected EnvironmentA discussion of the transportation resource area <strong>and</strong> the methodologyinvolved is found in section 3.12.3.12.1.1 Clear AFS—TransportationGround TransportationThe ROI for the transportation analysis includes the George ParksHighway in the vicinity of Clear AFS <strong>and</strong> the on-base roads expected tobe the roadway route used for construction <strong>and</strong> operation activities.Clear AFS is located in Interior Alaska approximately 126 kilometers (78miles) southwest of Fairbanks, near the community of Anderson. Themain base road provides access from the George Parks Highway to thebase main gate. The only off-base paved public road of any distinction inthe area is Anderson Road, which provides access to the community ofAnderson <strong>and</strong> to Clear Airport. The George Parks Highway is the primaryroad in the area, running north–south <strong>and</strong> connecting Anchorage <strong>and</strong>Fairbanks.The area surrounding Clear AFS is relatively remote, with a moderatetraffic volume. The summer average daily traffic for the George ParksHighway in the vicinity of Clear AFS is 2,011 (Alaska Department ofTransportation <strong>and</strong> Public Facilities, 1997—Annual Traffic VolumeReport). The highway operates at LOS B (see table 3.12-2). Vehiculartraffic on Clear AFS is accommodated by a 14-kilometer (8.7-mile)network of primary <strong>and</strong> secondary roads, with 5.5 kilometers (3.4 miles)of paved roads <strong>and</strong> 8.5 kilometers (5.3 miles) of unpaved roads (ClearAFS, 1993—Comprehensive Planning Framework). There is no trafficvolume information for Anderson Road or the main gate to Clear AFS.Table 3.12-2: Peak-Hour Traffic Volumes <strong>and</strong> Levels of ServiceRoadway Location AnnualAverage DailyTraffic (1)Capacity (2)Peak HourVolumeTraffic (2)Peak HourVolumeLevel ofServiceAlaska Highway Delta Junction 3,350 1,763 372 BGeorge Parks Highway Anderson Road 2,011 (3) 1,526 231 BRichardson Highway Eielson AFB 10,461 (3) 2,200 214 ARichardson Highway Fort Greely 1,750 1,763 204 B(1)Source: Alaska Department of Transportation <strong>and</strong> Public Facilities, 1997—Annual Traffic Volume Report.(2)For four-lane roadways, volumes <strong>and</strong> capacity are one-way, per lane.(3)Summer average daily traffic numbersNotes: Calculations performed using the National Research Council, 1994—Highway Capacity Manual.NMD Deployment Final EIS 3-355
Chapter 3—Affected EnvironmentAir TransportationThe ROI for the air transportation analysis includes the airports in thevicinity of Clear AFS. There is no runway at Clear AFS. The nearestairfield is Clear Airport, which is operated by the State of Alaska <strong>and</strong> islocated just outside the base boundary. The airfield provides an alternatemeans of transportation to <strong>and</strong> from Clear AFS <strong>and</strong> the community ofAnderson. It serves a vital role as a means of medivac service <strong>and</strong> isused by private pilots in the area. According to the FAA master record,annual operations at this facility total 2,000. The majority of theseinvolve private aircraft. At least 14 based aircraft are reported at theairport. In addition, it was reported that approximately 2,500 helicopteroperations associated with forest fire fighting have occurred on fivedifferent occasions over the past 10 years. The Clear Airport runway ispaved <strong>and</strong> is approximately 1,219 meters (4,000 feet) in length <strong>and</strong> 30meters (100 feet) wide (Alaska Department of Transportation <strong>and</strong> PublicFacilities, 1993—EA for Clear Airport Improvements).3.12.1.2 Eielson AFB—TransportationGround TransportationThe ROI for the transportation analysis includes the Richardson Highwayin the vicinity of the base <strong>and</strong> the on-base roads expected to be theroadway route used for construction <strong>and</strong> operation activities.Eielson AFB is located approximately 37 kilometers (23 miles) southeastof Fairbanks near the community of Moose Creek. The RichardsonHighway, a four-lane divided highway, provides access to the basethrough the Hursey Gate. This gate is the only operational gate atEielson allowing access to <strong>and</strong> from the installation (Pacific Air Forces,1998—Draft General Plan, Eielson AFB).The Richardson Highway is the primary road in the area <strong>and</strong> spanssoutheast Alaska, connecting Fairbanks with Valdez. The installation hasa network of roads <strong>and</strong> streets, which for the most part are laid-out on anorth–south grid (Pacific Air Forces, 1998—Draft General Plan, EielsonAFB). Most roads are two-lanes <strong>and</strong> paved; however, some are gravel.The area surrounding Eielson AFB is sparsely populated with a moderatetraffic volume. The summer average daily traffic for the RichardsonHighway in the vicinity of the base is 10,461 (Alaska Department ofTransportation <strong>and</strong> Public Facilities, 1997—Annual Traffic VolumeReport). The highway operates at LOS A (see table 3.12-2). There is notraffic volume information for the Hursey Gate, but it usually has notraffic problems (EDAW, Inc., 1998—Trip Report of visit to Alaska, July20–31).3-356 NMD Deployment Final EIS
Chapter 3—Affected EnvironmentAir TransportationThe ROI for the air transportation analysis includes the Eielson AFBairport. Eielson AFB is home to the 354 th Fighter Wing. The 354 th equips<strong>and</strong> trains its 18 th Fighter Squadron of F-16s, <strong>and</strong> the wing’s 355 thFighter Squadron flies the A-10 <strong>and</strong> OA-10 aircraft. The runway is4,420 meters (14,500 feet) in length <strong>and</strong> supports all aircraft in the AirForce inventory. Air traffic is all military-related, with no civilian aircraftusing the facility. Approximately 59,000 aircraft operations occur peryear at Eielson AFB.3.12.1.3 Fort Greely—TransportationGround TransportationThe ROI for the transportation analysis includes the Richardson Highwayin the vicinity of Fort Greely, the Alaska Highway at Delta Junction, <strong>and</strong>Fort Greely installations roads. These roadways are expected to be usedfor construction <strong>and</strong> operation activities.Fort Greely is located approximately 172 kilometers (107 miles)southeast of Fairbanks <strong>and</strong> just south of the community of DeltaJunction. The Richardson Highway provides access to the base. Theprimary roads in the area are the Richardson Highway, which runs north–south connecting Fairbanks <strong>and</strong> Valdez, <strong>and</strong> the Alaska Highway, whichruns east–west connecting Delta Junction with the Canadian-Americanborder. Fort Greely is located approximately 10 kilometers (6 miles)south of the junction of these two highways.Fort Greely consists of the Main Post, two large training areas (Fort GreelyManeuver Area <strong>and</strong> Fort Greely Air Drop Zone), <strong>and</strong> three outlying areas(Gerstle River Test Site, Black Rapids Training Site, <strong>and</strong> Whistler CreekRock Climbing Area). Roads serving the Main Post are generally paved<strong>and</strong> in good condition. Range roads are generally graded <strong>and</strong> in faircondition, with the exception of a few unmaintained roads. (U.S. ArmyAlaska, 1997—Draft Integrated Natural Resources Management Plan)The area surrounding Fort Greely is sparsely populated with a moderatetraffic flow. The Richardson Highway in the vicinity of Fort Greelyexperiences an AADT of 1,750. The Alaska Highway at the RichardsonHighway junction has an AADT of 3,350 (Alaska Department ofTransportation <strong>and</strong> Public Facilities, 1997—Annual Traffic VolumeReport). Both of these roads are two-lane in this area <strong>and</strong> operate at LOSB (see table 3.12-2). There is no traffic information for Fort Greelyinstallation roadways.NMD Deployment Final EIS 3-357
Chapter 3—Affected EnvironmentCurrently, Fort Greely is undergoing realignment, which is scheduled forcompletion by July 2001. This realignment will decrease personnel atFort Greely from approximately 750 in 1997 to 66 by 2001. Likewise,traffic volume in the area will also decrease.Air TransportationThe ROI for the air transportation analysis includes the Fort Greelyairport. Allen Army Airfield at Fort Greely provides general aviationsupport for the U.S. Army Garrison, Post Headquarters, Cold RegionsTest Center, the Northern Warfare Training Center, <strong>and</strong> U.S. ArmyAlaska. The Aviation Detachment at Allen Army Airfield also providessupport for visiting DOD units during training exercises. Allen ArmyAirfield has three runways. All of these runways are operational,although one is not plowed in the winter. The northeast/southwestrunway is 2,286 meters (7,500 feet) in length, <strong>and</strong> thenorthwest/southeast runway is 1,859 meters (6,100 feet) in length. Theairfield can support C5/C41 aircraft in the winter <strong>and</strong> C130 aircraft at alltimes of the year. Air traffic is mostly military-related, withapproximately 6,000 operations per year.3.12.1.4 Yukon Training Area (Fort Wainwright)—TransportationGround TransportationThe ROI for the transportation analysis includes the Richardson Highwayin the vicinity of the Eielson AFB <strong>and</strong> roadways within the Yukon TrainingArea that are expected to be used for construction <strong>and</strong> operationactivities.The Yukon Training Area is located approximately 40 kilometers (25miles) southeast of Fairbanks. Although the Yukon Training Area is partof Fort Wainwright, it is located about 24 kilometers (15 miles) southeastof the main post. Access into the area is gained from the RichardsonHighway at two points: through the main gate of Eielson AFB <strong>and</strong> viaJohnson Road, which intersects the highway about 16 kilometers (10miles) south of the Eielson AFB Hursey Gate. The Yukon Training Areaconsists of a network of unpaved roads <strong>and</strong> trails. There is no trafficinformation for the Yukon Training Area roadways.More information concerning the traffic volume of the RichardsonHighway <strong>and</strong> roadways associated with Eielson AFB can be found insection 3.12.1.2.Air TransportationThere are no airport facilities on the Yukon Training Area. The Armyuses Fort Wainwright in Fairbanks for their aviation support needs.3-358 NMD Deployment Final EIS
Chapter 3—Affected Environment3.12.2 NORTH DAKOTAThe existing roadways system in northeastern North Dakota includesFederal, state, <strong>and</strong> county roads. Because the topography of the area isbasically flat, the road network is essentially orthogonal in north–south<strong>and</strong> east–west directions. Most of this area of North Dakota is rural, <strong>and</strong>traffic volume is relatively low. Roadway capacity is not an issue in thisregion of the state. Figure 3.12-2 shows the roadways within northeastNorth Dakota.This section addresses the airports potentially used by the NMD program.Issues related to airspace use around potential NMD locations arediscussed in section 3.3, Airspace.A discussion of the transportation resource area <strong>and</strong> the methodologyinvolved is found in section 3.12.3.12.2.1 Cavalier AFS—TransportationGround TransportationThe ROI for the transportation analysis includes the installation roadways<strong>and</strong> roadways in the surrounding area of Cavalier AFS that are expectedto be utilized for construction <strong>and</strong> operation activities.Cavalier AFS is located on the western edge of Pembina County, NorthDakota, approximately 23 kilometers (14 miles) southwest of the town ofCavalier. Cavalier AFS is served by ND 5, 4 kilometers (2.5 miles) northof the station. CR 89 provides access to the station through the trafficcheckpoint/entry gate. (U.S. Air Force Space Comm<strong>and</strong>—ComprehensivePlanning Framework, Cavalier AS) The primary road network of the areaconsists mainly of state highways <strong>and</strong> county roads, which are all twolaneroads.ND 5 runs east–west connecting the towns of Cavalier <strong>and</strong> Langdon. ND32 runs north–south connecting Walhalla <strong>and</strong> the Canadian border to thecommunities of Mountain <strong>and</strong> Edinburg (see figure 3.12-2).The area surrounding Cavalier AFS is sparsely populated, <strong>and</strong> trafficvolume is low. ND 5 in the vicinity of the station has an AADT of 1,000,<strong>and</strong> ND 32 has an AADT of 550 (North Dakota Department ofTransportation, 1996—Traffic Volume Map, Pembina County). The trafficvolume of CR 89 at the ND 5 junction is AADT 300 (North DakotaDepartment of Transportation, 1996—Traffic Volume Map, PembinaCounty). The areas with the highest traffic volume are the cities ofCavalier (ND 5), Walhalla (ND 32), <strong>and</strong> Langdon (ND 5), which experiencean AADT of 3,500, 1,400, <strong>and</strong> 1,325, respectively (North DakotaDepartment of Transportation, 1996-Traffic Volume Map, Cavalier <strong>and</strong>Pembina County). As shown in table 3.12-3, all of these roadwaysNMD Deployment Final EIS 3-359
CANADA20Hampden17RSL 2566Nekoma1LangdonMSR55RSL 1 FairdaleRSL 4Edmore22Mountain9AdamsWalhalla32CavalierCavalierAFSEdinburg1817581662922033518Devils Lake8115Lakota1322183B33Gr<strong>and</strong> ForksAFBGr<strong>and</strong> Forks1545326545200 200Cooperstown2001820029MINNESOTAHope200A2693829Index Map19494Fargo3218North DakotaEXPLANATIONRoadsInterstate RoadsU.S. HighwaysState HighwaysCityMilitary InstallationMajor Roadways inNortheast NorthDakotaNORTHtp_mmf_0023-360County RoadsScale 1:1,500,0000 12 24 Miles0 19 39 MetersNMD Deployment Final EISNorth DakotaFigure 3.12-2
Chapter 3—Affected EnvironmentTable 3.12-3: Peak-Hour Traffic Volumes <strong>and</strong> Levels of ServiceRoadway Location Annual AverageDaily Traffic (1)Capacity (2)Peak Hour VolumeTraffic (2)Peak Hour VolumeLevel ofServiceCR 3CR 3BCR 9CR 22Remote Sprint LaunchSite 1Gr<strong>and</strong> Forks AFB maingateRemote Sprint LaunchSite 4Remote Sprint LaunchSite 4280 2,660 31 A7,000 2,580 778 C170 2,660 19 A200 2,660 22 ACR 26 <strong>Missile</strong> Site Radar 180 2,660 20 ACR 32CR 55CR 89Remote Sprint LaunchSite 1Remote Sprint LaunchSite 2ND 5 junctionCavalier AFS65 2,660 8 A150 2,660 17 A300 2,660 33 AND 1 <strong>Missile</strong> Site Radar 600 2,660 67 AND 1ND 1ND 1Remote Sprint LaunchSite 1Remote Sprint LaunchSite 2Remote Sprint LaunchSite 4510 2,660 57 A575 2,660 64 A490 2,660 54 AND 5 Cavalier 3,500 2,580 389 BND 5 Cavalier AFS 1,000 2,660 111 AND 5 Langdon 1,325 2,580 148 AND 17Remote Sprint LaunchSite 4450 2,660 50 AND 32 Cavalier AFS 550 2,660 61 AND 32 Walhalla 1,400 2,580 156 AND 66 <strong>Missile</strong> Site Radar 280 2,660 31 AU.S. 2 (2) CR 3B (main entrance) 10,500 2,200 315 AU.S. 2 (2) Secondary gate 5,900 2,200 177 A(1)Source: North Dakota Department of Transportation, 1996—Traffic Volume Map, Cavalier, Gr<strong>and</strong> Forks, Pembina,Ramsey, <strong>and</strong> Walsh Counties.(2)For 4-lane roadways, traffic volumes <strong>and</strong> capacity are one-way, per lane.Notes: Calculations performed using the National Research Council, 1994—Highway Capacity Manual.Level terrain, 5 percent truck traffic, 50/50 directional split, <strong>and</strong> peak hour factor of 0.9 were used in all capacitycalculations.CR = County Road, ND= North DakotaNMD Deployment Final EIS 3-361
Chapter 3—Affected Environmentoperate at LOS A, except ND 5 in the city limits of Cavalier, whichoperates at LOS B.Air TransportationGeneral aviation support for Cavalier AFS is provided by Gr<strong>and</strong> Forks AFB,discussed in section 3.12.2.2.3.12.2.2 Gr<strong>and</strong> Forks AFB—TransportationGround TransportationThe ROI for the transportation analysis includes the on-base roadways<strong>and</strong> roadways in the surrounding area of Gr<strong>and</strong> Forks AFB that areexpected to be utilized for construction <strong>and</strong> operation activities.The area surrounding Gr<strong>and</strong> Forks AFB is served by a network of U.S.,state, <strong>and</strong> county roads. The main gate is located off of CR 3B (twolane),approximately 1.6 kilometers (1 mile north) of U.S. 2, while thesecondary gate is located off of U.S. 2 (four-lane), approximately 1.2kilometers (0.75 mile) west of CR 3B (see figure 3.12-2). Traffic countsfor these gates are no longer compiled by the base (U.S. Department ofthe Air Force, 1999—Final EIS, Minuteman III <strong>Missile</strong> SystemDismantlement). U.S. 2 in the vicinity of the base has an AADT count of10,500 vehicles, while CR 3B between U.S. 2 <strong>and</strong> the main gate has anAADT of 7,000 vehicles (North Dakota Department of Transportation,1996—Traffic Volume Map, Gr<strong>and</strong> Forks County). Both of theseroadways operate at LOS A.Air TransportationThe ROI for the air transportation analysis includes the Gr<strong>and</strong> Forks AFBairport. Gr<strong>and</strong> Forks AFB is host to the 319 th Air Refueling Wing <strong>and</strong> the321 st <strong>Missile</strong> Group. The runway is approximately 3,764 meters (12,350feet) in length <strong>and</strong> is capable of accommodating most aircraft in the AirForce inventory. Air traffic is all military-related, with no civilian aircraftusing the facility. At Gr<strong>and</strong> Forks AFB, approximately 35,000 aircraftoperations occur per year.3.12.2.3 <strong>Missile</strong> Site Radar—TransportationGround TransportationThe ROI for the transportation analysis includes the roadways adjacent<strong>and</strong> in the surrounding area of the <strong>Missile</strong> Site Radar that are expected tobe utilized for construction <strong>and</strong> operation activities.The <strong>Missile</strong> Site Radar is located in Cavalier County, North Dakota,approximately 21 kilometers (13 miles) south of the town of Langdon,3-362 NMD Deployment Final EIS
Chapter 3—Affected Environment<strong>and</strong> just north of the town of Nekoma. The <strong>Missile</strong> Site Radar isaccessed by CR 26 via ND 1. The network of roadways in the vicinity ofthe site consists of state highways <strong>and</strong> county roads. ND 1 is theprimary road in the area, running north–south <strong>and</strong> connecting the town ofLangdon to Lakota. ND 66 runs east–west, <strong>and</strong> is approximately 5kilometers (3 miles) north of the site (see figure 3.12-2).Currently, the <strong>Missile</strong> Site Radar is inactive <strong>and</strong> the only traffic to the siteis from maintenance personnel. The area surrounding the <strong>Missile</strong> SiteRadar is remote, <strong>and</strong> traffic volume is low. ND 1 in the vicinity of thesite has an AADT of 600, <strong>and</strong> ND 66 has an AADT of 280 (North DakotaDepartment of Transportation, 1996—Traffic Volume Map, CavalierCounty). CR 26 experiences an AADT of 180 (North Dakota Departmentof Transportation, 1996—Traffic Volume Map, Cavalier County). All ofthese roads are two-lane <strong>and</strong> operate at LOS A (see table 3.12-3).Air TransportationThe <strong>Missile</strong> Site Radar is in caretaker status with minimal activities; thereare no airport facilities at this location.3.12.2.4 Remote Sprint Launch Site 1—TransportationGround TransportationThe ROI for the transportation analysis includes the roadways adjacent<strong>and</strong> in the surrounding area of Remote Sprint Launch 1 that are expectedto be utilized for construction <strong>and</strong> operation activities.Remote Sprint Launch Site 1 is located in northern Ramsey County,approximately 5 kilometers (3 miles) east of the town of Hampden. Thesite is served north–south by CR 3, connecting the towns of Hampden<strong>and</strong> Devils Lake, <strong>and</strong> east–west by CR 32. CR 32 provides access toRemote Sprint Launch 1. The primary roads in the area consist of ND 1,which connects Remote Sprint Launch 1 to Langdon <strong>and</strong> Lakota, CR 3,<strong>and</strong> CR 32 (see figure 3.12-2).Currently, Remote Sprint Launch Site 1 is inactive, <strong>and</strong> the only traffic tothe site is occasional maintenance visits. The traffic volumes on the arearoadways are low with ND 1, CR 3, <strong>and</strong> CR 32 experiencing AADTvalues of 510, 280, <strong>and</strong> 65, respectively (North Dakota Department ofTransportation, 1996—Traffic Volume Map, Ramsey County). All ofthese roadways are two-lane <strong>and</strong> operate at LOS A (table 3.12-3).Air TransportationRemote Sprint Launch Site 1 is in caretaker status with no activities;there are no airport facilities at this location.NMD Deployment Final EIS 3-363
Chapter 3—Affected Environment3.12.2.5 Remote Sprint Launch Site 2—TransportationGround TransportationThe ROI for the transportation analysis includes the roadways adjacent<strong>and</strong> in the surrounding area of Remote Sprint Launch 2 that are expectedto be utilized for construction <strong>and</strong> operation activities.Remote Sprint Launch Site 2 is located in Cavalier County, North Dakota,approximately 13 kilometers (8 miles) north–northwest of the town ofLangdon <strong>and</strong> 18 kilometers (11 miles) south of the Canadian border.Remote Sprint Launch Site 2 is served by ND 1, which runs north–southconnecting Langdon <strong>and</strong> the Canadian border. CR 55 is locatedapproximately 5 kilometers (3 miles) north of the site, <strong>and</strong> runs east–west connecting the site to the town of Walhalla. An unnamed countyroad provides access to the site via ND 1 (see figure 3.12-2).Remote Sprint Launch Site 2 is currently inactive, <strong>and</strong> the only traffic tothe site is for occasional maintenance visits. The site is located in aremote area, <strong>and</strong> traffic volume is low. ND 1 in the vicinity of the sitehas an AADT of 575, <strong>and</strong> CR 55 has an AADT of 150 (North DakotaDepartment of Transportation, 1996—Traffic Volume Map, CavalierCounty). Both of these roadways are two-lane <strong>and</strong> operate at LOS A.Traffic volume data for the unnamed county road providing access to thesite is not available.Air TransportationRemote Sprint Launch Site 2 is in caretaker status with no activities;there are no airport facilities at this location.3.12.2.6 Remote Sprint Launch Site 4—TransportationGround TransportationThe ROI for the transportation analysis includes the roadways adjacent<strong>and</strong> in the surrounding area of Remote Sprint Launch 4 that are expectedto be utilized for construction <strong>and</strong> operation activities.Remote Sprint Launch Site 4 is located in the northwest corner of WalshCounty, North Dakota, approximately 3 kilometers (2 miles) southwest ofthe town of Fairdale. The site is served north–south by CR 22 <strong>and</strong> east–west by CR 9. An unnamed county road provides access to RemoteSprint Launch Site 4. The primary roads in the area are ND 17connecting the towns of Edmore <strong>and</strong> Adams, <strong>and</strong> ND 1 connecting thetowns of Langdon <strong>and</strong> Lakota (see figure 3.12-2).3-364 NMD Deployment Final EIS
Chapter 3—Affected EnvironmentRemote Sprint Launch Site 4 is currently inactive, <strong>and</strong> the only traffic tothe site is for occasional maintenance visits. The area surrounding thesite is sparsely populated, <strong>and</strong> the traffic volume is low. CR 22 in thevicinity of the site has an AADT of 200, <strong>and</strong> CR 9 has an AADT of 170(North Dakota Department of Transportation, 1996—Traffic Volume Map,Walsh County). ND 17 has an AADT value of 450 (North DakotaDepartment of Transportation, 1996—Traffic Volume Map, WalshCounty), <strong>and</strong> ND 1 has an AADT of 490 (North Dakota Department ofTransportation, 1996—Traffic Volume Map, Ramsey County). All ofthese roadways are two-lane <strong>and</strong> operate at LOS A (see table 3.12-3).There is no traffic count data available for the unnamed CR providingaccess to the site.Air TransportationRemote Sprint Launch Site 4 is in caretaker status with no activities;there are no airport facilities at this location.NMD Deployment Final EIS 3-365
Chapter 3—Affected Environment3.13 UTILITIESThe major attributes of utility systems are processing, distribution, <strong>and</strong>storage capacities <strong>and</strong> related factors, such as average daily consumption<strong>and</strong> peak dem<strong>and</strong>, required in making a determination of adequacy of suchsystems to provide services in the future.The utility systems addressed in this analysis include the facilities <strong>and</strong>infrastructure used for: Potable water pumping, treatment, storage, <strong>and</strong> distribution Wastewater collection <strong>and</strong> treatment Solid <strong>waste</strong> collection <strong>and</strong> disposal Energy generation <strong>and</strong> distribution, including the provision ofelectricity <strong>and</strong> natural gas3.13.1 ALASKA INSTALLATIONS3.13.1.1 Clear AFS—UtilitiesThis section describes the utilities in the vicinity of Clear AFS. The ROIfor utilities is made up of the service areas of each utility providerservicing the air station <strong>and</strong> local community.Water SupplyOn-base. Clear AFS obtains its water from wells with a total capacity of55.15 million liters per day (14.57 million gallons per day), <strong>and</strong> averagedaily water consumption for industrial <strong>and</strong> domestic use was 35.5 millionliters per day (9.37 million gallons per day) in fiscal year 1995 (U.S.Department of the Air Force, 1997—EA for Radar Upgrade, Clear AS).Chlorination is provided for the potable water. (Clear AFS, 1993—Comprehensive Planning Framework)Five wells in the Technical Site supply water for the power plant turbinecondenser cooling, demineralization, <strong>and</strong> plant cooling. These wells havea combined capacity of 18.7 million liters per day (4.95 million gallonsper day). Average daily consumption in 1995 was 11 million liters perday (2.8 million gallons per day). Industrial water is cycled through a62.1-million-liter (16.4-million-gallon) cooling pond. Excess water isdischarged to Lake Sansing. Two of the industrial wells at the powerplant can also be used to supply potable water for domestic purposes.(U.S. Department of the Air Force, 1997—EA for Radar Upgrade, ClearAS)Seven wells in the Technical Site supply water to the radar facilities forcooling <strong>and</strong> to heat exchangers that cool radar equipment located in3-366 NMD Deployment Final EIS
Chapter 3—Affected EnvironmentBuildings 101 <strong>and</strong> 102. These wells have a combined capacity of 24.2million liters per day (6.38 million gallons per day). The heat exchangersystem contains a chromate solution that is circulated through a closedloopsystem to cool critical radar electronic components. (U.S.Department of the Air Force, 1997—Supplemental EA for Radar Upgrade,Clear AS)Water for domestic purposes is supplied from three wells with a totalcapacity of 12.3 million liters per day (3.24 million gallons per day).Water consumption for domestic purposes averaged 0.64 million litersper day (0.17 million gallons per day) in 1995. Water used for humanconsumption, food preparation, <strong>and</strong> fire protection is chlorinated. (U.S.Department of the Air Force, 1997—EA for Radar Upgrade, Clear AS)Off-base. Cities potentially impacted by activities at Clear AFS includeAnderson, Cantwell, Ferry, Healy, Lignite, McKinley Park, <strong>and</strong> Nenana.All these cities are located in Denali Borough. In all of these cities exceptfor Nenana, the large majority of homes have individual wells, septicsystems, <strong>and</strong> plumbing. (Alaska Department of Community <strong>and</strong> RegionalAffairs, 1998—DCRA Community Database)The Nenana water system is approximately 20 years old. It has twowells able to be used as potable water sources. The primary well is 61meters (200 feet) deep <strong>and</strong> has a pumping capacity of 0.545 million litersper day (0.144 million gallons per day). The secondary well is 21 meters(70 feet) deep <strong>and</strong> is rarely used. The system has a storage capacity ofapproximately 1.6 million liters (0.42 million gallons), <strong>and</strong> average usageis approximately 0.136 million liters per day (0.036 million gallons perday). (Knight, 1998—Personal communication)Approximately 75 percent of the city is served by the current system,<strong>and</strong> a study is underway to upgrade the design to incorporateapproximately 90 percent of the community. Those not on the citywater system have their own private wells. (Knight, 1998—Personalcommunication)WastewaterOn-base. Based on potable water pumping records from January 1996to February 1997, the average daily domestic <strong>waste</strong>water flow for ClearAFS is 0.87 million liters per day (0.23 million gallons per day) (Hardy,1998—Personal communication). Sanitary sewage from all Campfacilities with water service except Buildings 26 <strong>and</strong> 51 <strong>and</strong> theComposite Area is conveyed by gravity flow to an Imhoff tank, whichfunctions much like a septic tank. Sanitary sewage from the CompositeArea is conveyed to the Imhoff tank via a lift station. The Imhoff tank iscleaned by moving accumulated sludge into a drying bed <strong>and</strong> thentransferring the dried sludge to the base l<strong>and</strong>fill. The effluent from theNMD Deployment Final EIS 3-367
Chapter 3—Affected EnvironmentImhoff tank drains into a leach field. (Clear AFS, 1993—ComprehensivePlanning Framework)The new leach field that currently accepts the effluent from the Imhofftank was designed using performance data from the previous two leachfields. The new leach field has an area of approximately 2.4 thous<strong>and</strong>square meters (26 thous<strong>and</strong> square feet) <strong>and</strong> is estimated to be able toaccept the current load of 0.87 million liters per day (0.23 million gallonsper day) for from 10 to 20 years. (Meyer, 2000—Comments received byEDAW, Inc., regarding the NMD Deployment coordinating Final EIS)Sanitary sewage from the Technical Area flows into septic tanks withleaching wells or pits. Each of three Scanner buildings, the two Trackerbuildings, <strong>and</strong> the Power Plant has its own septic tank <strong>and</strong> leaching wellor pit. (Clear AFS, 1993—Comprehensive Planning Framework)Cooling water from the Clear AFS Power Plant is discharged to a ditch ata point 15 meters (50 feet) from where the ditch flow enters LakeSansing. This discharge is covered by State of Alaska WastewaterDisposal Permit number 9531-DB004. The permit requires the dischargeto be no more than 23 million liters per day (6.2 million gallons per day).(Alaska Department of Environmental Conservation, 1998—WastewaterDisposal Permit)Off-base. Wastewater treatment for the city of Anderson consists of asewage lagoon. The system has a capacity of approximately 2.2 millionliters per year (0.6 million gallons) with an average use of 1.5 millionliters per year (0.4 million gallons). Wastewater treatment for the city ofNenana consists of a piped gravity system that collects the sewage <strong>and</strong> asecondary rotating biological contactor treatment plant. Approximately75 percent of the city homes are connected to the sewer system, <strong>and</strong> astudy is underway to determine an efficient method of connecting up to90 percent of the community. No allowance is made for industrial <strong>waste</strong>treatment. The current system has a treatment capacity ofapproximately 0.227 million liters (0.06 million gallons) per day <strong>and</strong> isgenerally operated at or near capacity. (Knight, 1998—Personalcommunication)Solid WasteOn-base. The annual solid <strong>waste</strong> production on Clear AFS isapproximately 5,168 cubic meters (6,760 cubic yards) or about 1,533metric tons (1,690 tons). The break down of the <strong>waste</strong> stream is 20percent municipal <strong>waste</strong>, 16 percent construction <strong>waste</strong>, <strong>and</strong> 64 percentfly ash. The <strong>waste</strong> is collected from containers throughout Clear AFS<strong>and</strong> taken to the Clear AFS l<strong>and</strong>fill on a daily basis. The fly ash from thepower plant is used as cover at the l<strong>and</strong>fill. (Clear AS, 1998—Draft SolidWaste Management Plan)3-368 NMD Deployment Final EIS
Chapter 3—Affected EnvironmentThe Clear AFS l<strong>and</strong>fill began operations in 1975. The total capacity ofthe l<strong>and</strong>fill is estimated to be 191 thous<strong>and</strong> cubic meters (250 thous<strong>and</strong>cubic yards). Therefore, given the current <strong>waste</strong> to cover ratio, the totalnon-cover (i.e., non-fly ash) <strong>waste</strong> capacity of the l<strong>and</strong>fill is 63.1thous<strong>and</strong> cubic meters (82.5 thous<strong>and</strong> cubic yards). Using current rates,the l<strong>and</strong>fill is estimated to be full sometime between 2008 <strong>and</strong> 2013.(Clear AS, 1998—Draft Solid Waste Management Plan) Current plansare to close the Clear AFS l<strong>and</strong>fill in 2002 or 2003 <strong>and</strong> utilize the DenaliBorough l<strong>and</strong>fill, which was recently opened.Off-base. The Nenana l<strong>and</strong>fill was closed in July 1998. Solid <strong>waste</strong> inNenana <strong>and</strong> the area surrounding Clear AFS is collected by a private firm<strong>and</strong> delivered to the Denali Borough l<strong>and</strong>fill.EnergyElectricity—On-base. Electricity is generated onsite at the Clear AFSPower Plant by three General Electric, Class A, 7.5 megawatt generators.Each turbine generator is powered by steam from three coal-fired boilers.The combined electrical generating capacity of the three generators is22.5 megawatts. Average dem<strong>and</strong> is 9 megawatts, for an annualconsumption of 78.8 million kilowatt-hours. An emergency GeneralMotors, Class C, 1,400 horsepower, 1 megawatt diesel generator is alsoavailable. The Clear AFS electrical system is not connected to the publicgrid. (Clear AFS, 1993—Comprehensive Planning Framework; Graves,1998—Personal communication)Electricity—Off-base. The Golden Valley Electric Association is a nonprofit,member-owned cooperative that provides electrical service to theFairbanks North Star Borough, the Denali Borough, unincorporated areasbetween these two boroughs, <strong>and</strong> along the Richardson Highway to FortGreely. Clear AFS, Eielson AFB, Fort Wainwright, Fort Greely, Fort KnoxGold Mine, the University of Alaska Fairbanks, <strong>and</strong> the communities ofFairbanks, North Pole, Nenana, Delta Junction, <strong>and</strong> Healy are all locatedin Golden Valley Electric Association’s service area. Golden ValleyElectric Association provides electricity to approximately 90,000 peoplevia over 36,000 service locations (Golden Valley Electric Association,1998—History; U.S. Department of the Interior, 1998—Northern IntertieProject, Final EIS)The Golden Valley Electric Association has a generating capability of 224megawatts of power, with an additional 70 megawatts available throughthe existing Fairbanks/Anchorage intertie (Golden Valley ElectricAssociation, 1998—History). In 1996, they had a peak dem<strong>and</strong> of 134.1megawatts <strong>and</strong> total energy sales of 653 million kilowatt-hours (U.S.Department of the Interior, 1998—Northern Intertie Project, Final EIS). In1997 their peak dem<strong>and</strong> was 163 megawatts (Golden Valley ElectricAssociation, 1998—History).NMD Deployment Final EIS 3-369
Chapter 3—Affected Environment3.13.1.2 Eareckson AS—UtilitiesThis section describes the utilities in the vicinity of Eareckson AS. The ROIfor utilities is made up of the utilities servicing the air station.Water SupplyOn-base. Eareckson AS’s potable water system has 25 thous<strong>and</strong> meters(82 thous<strong>and</strong> feet) of water lines <strong>and</strong> a capacity to produce 1.5 millionliters per day (0.39 million gallons per day). On average there is a totalbase usage of 0.22 million liters per day (0.059 million gallons per day).(Domahoski, 1998—Personal communication)WastewaterOn-base. Eareckson AS’s sanitary sewage system has 24 thous<strong>and</strong>meters (79 thous<strong>and</strong> feet) of sewer lines <strong>and</strong> the capacity to treat 0.95million liters per day (0.25 million gallons per day) of <strong>waste</strong>water. Onaverage there is a total base dem<strong>and</strong> for treatment of 0.26 million litersper day (0.07 million gallons per day). The treatment plant providessecondary treatment before ocean out fall. (Domahoski, 1998—Personalcommunication)Solid WasteOn-base. The Air Force at Eareckson AS adopted a regulation in 1991that established policies <strong>and</strong> procedures for segregation of solid,non<strong>hazardous</strong> <strong>waste</strong> into two main categories <strong>and</strong> several subcategories.Junk metal <strong>and</strong> aluminum cans are categorized as recyclable <strong>and</strong> areretrograded off of the isl<strong>and</strong>. Large items such as automobiles, couches,<strong>and</strong> washing machines are also removed from the isl<strong>and</strong>. Heavy plastic,polyvinyl chloride, <strong>and</strong> all other municipal <strong>waste</strong>s are also disposed of inthe Eareckson AS l<strong>and</strong>fill. (U.S. Air Force, 1994—L<strong>and</strong>fill OperationsPlan Eareckson AFS)The Eareckson AS l<strong>and</strong>fill is located on the southeast point of the isl<strong>and</strong><strong>and</strong> has been in operation since 1944 (U.S. Air Force, 1994—L<strong>and</strong>fillClosure Plan, Eareckson AFS). The l<strong>and</strong>fill is currently operated underState of Alaska Solid Waste Disposal Permit number 9425-BA009, whichpermits the disposal of municipal solid <strong>waste</strong> at the l<strong>and</strong>fill (AlaskaDepartment of Environmental Conservation, 1994—Eareckson AFSL<strong>and</strong>fill, Shemya, Alaska, Solid Waste Disposal Facility Permit). TheEareckson AS l<strong>and</strong>fill permit expired December 1, 1999 but is underadministrative extension until the State of Alaska can complete its reviewof the permit renewal package. The permit is expected to be renewed ascurrently written. (Hostman, 2000—Personal communication) It isexpected that the l<strong>and</strong>fill will reach capacity in approximately 15 years.3-370 NMD Deployment Final EIS
Chapter 3—Affected EnvironmentEnergyElectricity—On-base. Eareckson AS has six 3-megawatt dieselgenerators, only two of which are operating at any one time. Undermost conditions, the two generators are run at 55 percent of theircapacity, for a total of 3.3 megawatts. Eareckson’s has an annual usageof 28 million kilowatt-hours. (Domahoski, 1998—Personalcommunication)By running all six generators simultaneously, a total power output of 18megawatts can be achieved, <strong>and</strong> thus a capacity for an annualproduction of more than 150 million kilowatt-hours of electricity.(Domahoski, 1998—Personal communication)3.13.1.3 Eielson AFB—UtilitiesThis section describes the utilities in the vicinity of Eielson AFB. The ROIfor utilities is made up of the service areas of each utility provider servicingthe base <strong>and</strong> local community.Water SupplyOn-base. Currently, five wells directly serve the Eielson AFB watertreatment <strong>and</strong> distribution system. Three of these wells are used tosupply raw water directly to the base’s water treatment plant. The othertwo wells are st<strong>and</strong>by wells designated to deliver untreated waterdirectly to the distribution system if necessary. In the event that thewater treatment plant requires bypassing, its three wells can be used toindividually supply water to the distribution system. Chlorinating of rawwell water is possible for these three wells any time they are bypassingthe plant. (Eielson AFB, 1998—Infrastructure Management Plan)A new water treatment plant has been in operation since April 1998.The water treatment plant has a capacity to treat up to 11 million litersper day (3 million gallons per day). With the new treatment plant, EielsonAFB's system now has a storage capacity of 4 million liters (1 milliongallons). Average water dem<strong>and</strong> at Eielson AFB is approximately 4million liters per day (1 million gallons per day). Peak dem<strong>and</strong>, whichoccurs during summer, can exceed 8 million liters per day (2 milliongallons per day).Off-base. Cities potentially impacted by activities at Eielson AFB includeEster, Fairbanks, Fox, Harding Lake, Moose Creek, North Pole, PleasantValley, Salcha, <strong>and</strong> Two Rivers. All these cities are located in FairbanksNorth Star Borough. In all of these cities except for Fairbanks <strong>and</strong> NorthPole, the large majority of homes have individual wells, septic systems,<strong>and</strong> plumbing. (Alaska Department of Community <strong>and</strong> Regional Affairs,1998—DCRA Community Database)NMD Deployment Final EIS 3-371
Chapter 3—Affected EnvironmentThe water supply at Fairbanks is pumped from four wells. Two have apumping capacity of 13 thous<strong>and</strong> liters per minute (3,400 gallons perminute) <strong>and</strong> the other two have a capacity of 9,800 liters per minute(2,600 gallons per minute). The system has a storage capacity ofapproximately 19 million liters (5 million gallons). On average, the cityuses 11 to 13 million liters per day (3 to 3.3 million gallons per day).Less than 1 percent of the city is still on private wells. There are noplans to exp<strong>and</strong> the water service beyond its current level. (Rogers,1998—Facsimile communication)The water supply at North Pole is provided through two ground wells (55meters <strong>and</strong> 49 meters [180 feet <strong>and</strong> 160 feet] deep respectively). Thereare three water reservoirs with a storage capacity of approximately 3.8million liters (1 million gallons) <strong>and</strong> a current recharge rate of up toapproximately 2.3 million liters per day (0.6 million gallons per day). Theplant is almost 13 years old, <strong>and</strong> is exp<strong>and</strong>able. However, since currentusage is limited to approximately 0.8 million liters per day (0.2 milliongallons per day), no plans have been made to exp<strong>and</strong> water servicebeyond the current amount. It is estimated that no more than 33 percentof the city is serviced by both the water <strong>and</strong> <strong>waste</strong>water systems.(Johnson, R., 1998—Personal communication, Nov 23)WastewaterOn-base. The <strong>waste</strong>water received at the Eielson AFB sewage treatmentplant includes sewage from the base collection system <strong>and</strong> septic tank<strong>waste</strong>s delivered by trucks. The treatment process includes pretreatment,primary treatment, <strong>and</strong> secondary treatment. Final dispositionis by percolation into an ab<strong>and</strong>oned gravel pit where additionalbiostabilization occurs in summer months. (Eielson AFB, 1998—Infrastructure Management Plan)The sewage treatment plant, which was originally constructed in 1952,has had extensive repairs <strong>and</strong> upgrades in the last 5 years.Consequently, it is in excellent condition. The plant treats an average of4 million liters per day (1 million gallons per day) <strong>and</strong> currently has amaximum permitted allowance of 6.0 million liters per day (1.6 milliongallons per day). (Eielson AFB, 1998—Infrastructure Management Plan)Off-base. The <strong>waste</strong>water treatment facility at Fairbanks is a boroughwideservice system that includes the city of Fairbanks, Fort Wainwright,College Utilities, <strong>and</strong> the University of Alaska Fairbanks. It is a pureoxygen activated sludge system with secondary clarifiers, aerobicdigestors, <strong>and</strong> bar screens. It was completed in 1977. (Rogers, 1998—Facsimile communication)The Fairbanks <strong>waste</strong>water treatment system serves approximately 55 to65 thous<strong>and</strong> people <strong>and</strong> has the capability to treat up to approximately3-372 NMD Deployment Final EIS
Chapter 3—Affected Environment30 million liters per day (8 million gallons per day). On average, thesystem operates at approximately two-thirds capacity <strong>and</strong> treatsapproximately 20 million liters per day (5.4 million gallons per day). Lessthan 1 percent of the population in Fairbanks is still on septic systems,<strong>and</strong> no plans have been made to exp<strong>and</strong> the current system. (Rogers,1998—Facsimile communication)The <strong>waste</strong>water treatment at North Pole consists of a city-owned aeratedlagoon system. The system is less than 10 years old <strong>and</strong> has thecapacity to treat approximately 1.9 million liters per day (0.5 milliongallons per day). Current usage averages approximately 0.8 to 1 millionliters per day (0.2 to 0.3 million gallons per day). (Lewis, 1998—Personal communication)Solid WasteOn-base. In 1998 Eielson AFB will produce an estimated 4.0 thous<strong>and</strong>metric tons (4.4 thous<strong>and</strong> tons) of solid <strong>waste</strong>. Of that, an estimated3.0 thous<strong>and</strong> metric tons (3.3 tons) will be transferred to the FairbanksNorth Star Borough l<strong>and</strong>fill, 0.76 thous<strong>and</strong> metric tons (0.83 tons) ofcombustible <strong>waste</strong> will be used as fuel at the Eielson AFB Refuse DerivedFuel facility, <strong>and</strong> the rest will be recycled or composted. (Eielson AFB,1998—Recyclable Materials, Capture Rates)Off-base. The Fairbanks North Star Borough L<strong>and</strong>fill has been inoperation for approximately 30 years. The newest cell is currently underconstruction <strong>and</strong> is anticipated to be in operation within the next year.The l<strong>and</strong>fill can accept asbestos-contaminated <strong>waste</strong>, household<strong>hazardous</strong> <strong>waste</strong>, <strong>and</strong> <strong>waste</strong> from conditionally exempt small quantity<strong>hazardous</strong> <strong>waste</strong> generators. No other <strong>hazardous</strong> or radioactive <strong>waste</strong>can be accepted at the l<strong>and</strong>fill. (Jordan, 1998—Personal communication)It is estimated that the l<strong>and</strong>fill accepts approximately 73 thous<strong>and</strong> metrictons (80 thous<strong>and</strong> tons) of <strong>waste</strong> annually, the majority of which comesfrom the Fairbanks North Star Borough (which includes both North Pole<strong>and</strong> Fairbanks). However, they do occasionally accept <strong>waste</strong> from otherboroughs. (Jordan, 1998—Personal communication)EnergyElectricity <strong>and</strong> Steam—On-base. The Central Heat & Power Plant is themost critical facility on Eielson AFB, as it is the base’s primary source forheating <strong>and</strong> electric power. Operating continuously, year round, it has anannual production of approximately 860 million kilograms (1.9 billionpounds) of steam <strong>and</strong> 89 million kilowatt-hours of electricity. With arctictemperatures dipping as low as -51°C (-60°F), reliable steam heat iscritical to operations at Eielson AFB. (Eielson AFB, 1998—InfrastructureManagement Plan)NMD Deployment Final EIS 3-373
Chapter 3—Affected EnvironmentElectrical power on Eielson AFB is generated by a series of steam turbinegenerators in the Central Heat & Power Plant. The base is electricallyself-sufficient, except for Charlie Battery, Pedro Dome, Birch Lake, <strong>and</strong>Flag Hill. All of these areas receive their electricity from Golden ValleyElectric Association. (Eielson AFB, 1998—Infrastructure ManagementPlan)The Central Heat & Power Plant is equipped with five steam turbinegenerators capable of producing 25 megawatts of electricity. EielsonAFB also has a contract with Golden Valley Electric Association thatallows the base to access 10 megawatts of power whenever needed.(Eielson AFB, 1998—Infrastructure Management Plan)Power dem<strong>and</strong> varies seasonally. Average summer dem<strong>and</strong> isapproximately 10 megawatts. Winter dem<strong>and</strong>s range from 11megawatts to 14 megawatts, with peak dem<strong>and</strong>s of approximately 17megawatts. In fiscal year 1997, Eielson AFB purchased 13.3 millionkilowatt-hours of electricity from Golden Valley Electric Association <strong>and</strong>produced approximately 89 million kilowatt-hours themselves. (EielsonAFB, 1998—Infrastructure Management Plan)The Central Heat & Power Plant has six spreader-stoker, traveling grate,coal-fired boilers. Each of the boilers has a maximum rating of 54thous<strong>and</strong> kilograms (120 thous<strong>and</strong> pounds) of steam per hour. Thenormal operating range for the boilers is between 27 thous<strong>and</strong> <strong>and</strong> 32thous<strong>and</strong> kilograms (60 thous<strong>and</strong> <strong>and</strong> 70 thous<strong>and</strong> pounds) of steam perhour. During the summer months, only two boilers are needed forelectrical generation. During winter operations, four to five boilers arerequired to meet the heating load. (Eielson AFB, 1998—InfrastructureManagement Plan)Electricity—Off-base. The Golden Valley Electric Association is a nonprofit,member-owned cooperative that provides electrical service to theFairbanks North Star Borough, the Denali Borough, unincorporated areasbetween these two boroughs, <strong>and</strong> along the Richardson Highway to FortGreely. The Golden Valley Electric Association is described in section3.13.1.1.3.13.1.4 Fort Greely—UtilitiesWaterOn-base. The water supply at Fort Greely is currently managed fromBuilding 606, the power plant. Two groundwater wells are utilized tosupply all of the existing building facilities <strong>and</strong> fire hydrants within themain cantonment. These two wells have a combined capacity of 4.2million liters per day (1.1 million gallons per day). A 712-thous<strong>and</strong>-liter(188-thous<strong>and</strong>-gallon) storage tank is located in Building 606 <strong>and</strong> feeds3-374 NMD Deployment Final EIS
Chapter 3—Affected Environmenttwo 76-thous<strong>and</strong>-liter (20-thous<strong>and</strong>-gallon) pressure tanks that pump intoa piped water system. The only water treatment performed is theaddition of chlorine <strong>and</strong> fluorine. The existing base water system, whenall buildings were in use, consumed roughly 1.19 million liters per day(0.315 million gallons per day). (Delta/Greely Community Coalition,1998—Final Reuse Plan, Fort Greely, Alaska; U.S. Army Corps ofEngineers, 1997—Environmental Baseline Survey Report for Fort Greely,Alaska)Off-base. Households in the Delta Junction area maintain individual wellswith depths ranging from 46 meters (150 feet) to 110 meters (350 feet).A community water purification plant is not feasible due to the dispersednature of the area’s populace <strong>and</strong> businesses. (Alaska Department ofCommunity <strong>and</strong> Regional Affairs, 1998—DCRA Community Database)WastewaterOn-base. The sewage system at Fort Greely conveys <strong>waste</strong>water to anImhoff tank inside Building 633. Sludge from the bottom of this tank ispumped to sludge drying beds. Once the sludge is dried, it is hauled tothe l<strong>and</strong>fill. Effluent from the Imhoff tank is conveyed to the sewagelagoon. The lagoon is aerated for further treatment. Effluent leaving thesewage lagoon is chlorinated <strong>and</strong> discharged to Jarvis Creek. (U.S. ArmyCorps of Engineers, 1997—Environmental Baseline Survey Report for FortGreely, Alaska)This system has a capacity of 1.7 million liters per day (0.46 milliongallons per day). (Delta/Greely Community Coalition, 1998—Final ReusePlan, Fort Greely, Alaska) Wastewater usage, when all buildings were inuse, was less than 1.2 million liters per day (0.32 million gallons perday).Wastewater from buildings in the Old Post <strong>and</strong> Mid Post area isdischarged to either a septic tank or a leach field (U.S. Army Corps ofEngineers, 1997—Environmental Baseline Survey Report for Fort Greely,Alaska).Off-base. Businesses <strong>and</strong> residences are dispersed over a large area, so acommunity <strong>waste</strong>water treatment system is not practical. Instead, eachhousehold maintains a septic system. (Alaska Department of Community<strong>and</strong> Regional Affairs, 1998—DCRA Community Database)Solid WasteOn-base. The base l<strong>and</strong>fill is a class 2 facility that is currently permittedto receive both sewage sludge <strong>and</strong> asbestos <strong>materials</strong>. The currentfacility is not lined, but does have groundwater monitoring tubes. Cellsat this facility are about 18 meters (60 feet) by 61 meters (200 feet) by6 meters (20 feet) deep <strong>and</strong> generally last 1.5 years under currentNMD Deployment Final EIS 3-375
Chapter 3—Affected Environmentconditions. The current ADEC solid <strong>waste</strong> disposal permit comes up forrenewal May 1, 1999. No determination has yet been made to close theexisting l<strong>and</strong>fill at Fort Greely because of BRAC. (Delta/GreelyCommunity Coalition, 1998—Final Reuse Plan, Fort Greely, Alaska)Off-base. The city-owned l<strong>and</strong>fill in the Delta Junction area is leased to aprivate collection company, Delta Sanitation. The current l<strong>and</strong>fill startedas a pit with an area of 37 square meters (400 square feet) <strong>and</strong> a depthof 4.6 meters (15 feet) that was dug in 1984. Delta Sanitation collectsup to approximately 76 cubic meters (100 cubic yards) of municipal<strong>waste</strong> per week from Delta Junction <strong>and</strong> the outlying areas. This <strong>waste</strong>is then burned in large "burn boxes" (large incinerators). The resultingash is then dumped into the l<strong>and</strong>fill pit. Large household <strong>waste</strong> is alsodisposed of at the l<strong>and</strong>fill pit. The pit is currently one-third full <strong>and</strong> hascapacity for another 12 to 15 years of use at the current rate. There isno provision for asbestos-contaminated <strong>materials</strong> or <strong>hazardous</strong> <strong>waste</strong> ofany sort. There is limited capacity for clean construction <strong>waste</strong>. (Peters,1998—Personal communication)The Alaska Department of Environmental Control, in coordination withthe city council <strong>and</strong> Delta Sanitation, is in the process of determiningwhat changes will be required to the current solid <strong>waste</strong> disposalprogram. No specific changes have been determined, <strong>and</strong> no specificdate of change has been established. However, since the <strong>waste</strong> disposalprogram now in effect is not st<strong>and</strong>ardized, it is likely that changes ofsome sort will be instituted. (Peters, 1998—Personal communication)EnergyElectricity <strong>and</strong> Steam—On-base. Electrical power requirements at FortGreely are currently met through a combination of power supplied fromFort Wainwright <strong>and</strong> on-post generators run by Fort Greely personnel.The electrical power from Fort Wainwright is "wheeled" over thecommercial electrical grid that exists between the two bases <strong>and</strong> iseventually supplied to Fort Greely through an existing 2.9-megawattsubstation. The U.S. Army Alaska pays Golden Valley ElectricalAssociation (which is described in section 3.13.1.1) for the use of itsgrid. The average electrical power dem<strong>and</strong> at Fort Greely wasapproximately 1.835 megawatts when all buildings were in use.However, peak dem<strong>and</strong>s of up to 3.3 megawatts sometimes occurredduring the winter. When the dem<strong>and</strong> at Fort Greely exceeded thecapacity of the substation, the additional power requirements were metby the three on-post diesel-powered generators, which together cangenerate up to 0.95 megawatt. (U.S. Department of the Army, 1997—Preliminary Draft EA for the Disposal <strong>and</strong> Reuse of Surplus Property atFort Greely, Alaska)3-376 NMD Deployment Final EIS
Chapter 3—Affected EnvironmentElectricity—Off-base. The Golden Valley Electric Association is a nonprofit,member-owned cooperative that provides electrical service to theFairbanks North Star Borough, the Denali Borough, unincorporated areasbetween these two boroughs, <strong>and</strong> along the Richardson Highway to FortGreely. The Golden Valley Electric Association is described in section3.1.3.1.1.3.13.1.5 Yukon Training Area (Fort Wainwright)—UtilitiesThere are no utilities at the current proposed NMD site on the YukonTraining Area. Potential support facilities for this site could be located onEielson AFB, as described in section 3.13.1.3.3.13.2 NORTH DAKOTA INSTALLATIONS3.13.2.1 Cavalier AFS—UtilitiesThis section describes the utilities in the vicinity of Cavalier AFS. TheROI for utilities is made up of the service areas of each utility providerservicing the air station <strong>and</strong> local community.Water SupplyOn-base. Cavalier AFS receives its water from the North Valley WaterAssociation. Under this arrangement, the North Valley Water Associationis under contract to supply Cavalier AFS with up to 1.09 million liters perday (0.29 million gallons per day) of water (Johnson, G., 1998—Personalcommunication, July 9). Current dem<strong>and</strong> is using approximately 0.45million liters per day (0.12 million gallons per day). Up to 0.4 millionliters per day (0.1 million gallons per day) of this amount is used in thetower <strong>and</strong> heat sink evaporative cooling system. (U.S. Air Force SpaceComm<strong>and</strong>, undated—Comprehensive Planning Framework, Cavalier AS)Off-base. North Valley Water Association, Inc. gets their water fromwells approximately 10 kilometers (6 miles) west of Cavalier AFS. In1997, they sold approximately 624 million liters (165 million gallons) ofwater. They expect this to increase to 1.00 to 1.14 billion liters (265 to300 million gallons) per year in the next few years. They have a totalstorage capacity of 5.7 million liters (1.5 million gallons) of water, whichis stored in a number of reservoirs. They have two treatment plants, <strong>and</strong>the one that will be providing water to Cavalier AFS has a capacity of 9.5million liters per day (2.5 million gallons per day). Their service areaincludes almost all of Pembina County <strong>and</strong> some of Cavalier County.They have approximately 1,300 customers, 8 of which are bulkwholesalers. These eight are cities <strong>and</strong> Cavalier AFS. (Johnson, G.,1998—Personal communication, July 9)NMD Deployment Final EIS 3-377
Chapter 3—Affected EnvironmentWastewaterOn-base. Cavalier AFS’s sanitary sewer system is composed of <strong>waste</strong>water treatment lagoons. The <strong>waste</strong>water treatment lagoons consist oftwo cells with a total capacity of approximately 83.3 million liters (22.0million gallons) (U.S. Air Force Space Comm<strong>and</strong>, undated—Comprehensive Planning Framework, Cavalier AS). There is also a thirdcell that is not currently in use, <strong>and</strong> that would need repairs to be used(Greenwood, 1998—Electronic communication, June 8).Site operations currently require full time use of the primary cell <strong>and</strong>periodic use of the secondary cell. The secondary cell is never used tocapacity. Capacity significantly exceeds current requirements.(Greenwood, 1998—Electronic communication, June 8)Off-base. The city of Cavalier's <strong>waste</strong>water treatment plant consists ofthree 3.34-hectare (8.25-acre) lagoons. Based on the system’s pumpingcapacity, it has a capacity of 2.7 million liters per day (0.72 milliongallons per day). The current average usage is 0.662 million liters perday (0.175 million gallons per day). This system serves the city ofCavalier. (Sagert, 1998—Personal communication) Most of the areasurrounding Cavalier AFS is rural, <strong>and</strong> most households are notconnected to public sewage systems.Solid WasteOn-base. Cavalier AFS’s solid <strong>waste</strong> is disposed of through a contractorto the city of Gr<strong>and</strong> Forks l<strong>and</strong>fill. For fiscal year 1998, Cavalier AFStypically disposed of less than 5 cubic meters (6 cubic yards) of solid<strong>waste</strong> per month. (Fors, 1998—Personal communication, July 14)The refuse contractor for Cavalier AFS maintains recycling bins in thePerimeter Acquisition Radar building parking lot for glass, paper,cardboard, metal, <strong>and</strong> plastics. Under a local initiative, Cavalier AFS alsosegregates <strong>and</strong> recycles computer, bond, <strong>and</strong> newspapers even thoughthey are not revenue-generating recyclables. (U.S. Air Force SpaceComm<strong>and</strong>, undated—Comprehensive Planning Framework, Cavalier AS)Off-base. The city of Gr<strong>and</strong> Forks l<strong>and</strong>fill was scheduled to close in thefall of 1999. Due to the floods in the spring of 1998, there is anextension of operations through the fall of 2000. Even after that time, itis planned that the current l<strong>and</strong>fill will be used as an inert l<strong>and</strong>fill, <strong>and</strong>thus will be able to accept demolition <strong>and</strong> construction <strong>waste</strong>s. (Kingery,1998—Personal communication)Under normal conditions, the current l<strong>and</strong>fill can receive 318 metric tons(350 tons) per day of municipal solid <strong>waste</strong>. Inert <strong>waste</strong> is not includedin that amount. As much construction <strong>waste</strong> as there is room for can be3-378 NMD Deployment Final EIS
Chapter 3—Affected Environmentaccepted, <strong>and</strong> it is reported on a quarterly basis. (Kingery, 1998—Personal communication)A new municipal <strong>waste</strong> l<strong>and</strong>fill for Gr<strong>and</strong> Forks is planned. Four potentialsites are currently being considered. The intent is to purchase a parcel ofapproximately 260 hectares (640 acres) in size <strong>and</strong> for construction tobegin in the spring of 1999. The new l<strong>and</strong>fill has been designed to beable to accept up to 454 metric tons (500 tons) per day of municipalsolid <strong>waste</strong> <strong>and</strong> have a life span of 40 years. (Kingery, 1998—Personalcommunication)EnergyElectricity—On-baseCommercial Power. Electricity is provided to Cavalier AFS by MinnkotaPower Cooperative, Inc., <strong>and</strong> Nodak Electric Cooperative, Inc. (U.S. AirForce Space Comm<strong>and</strong>, undated—Comprehensive Planning Framework,Cavalier AS; Greenwood, 1998—Electronic communication). Peak powerdem<strong>and</strong> for Cavalier AFS is approximately 7 megawatts, <strong>and</strong> annualenergy use is approximately 47 million kilowatt-hours (Greenwood,1998—Electronic communication, June 8).Backup Power. Cavalier AFS is capable of generating primary power forthe entire installation using the generators in the underground powerplant facility (Building 820), <strong>and</strong> these generators supply primary powerto critical operations when commercial service is interrupted (U.S. AirForce Space Comm<strong>and</strong>, undated—Comprehensive Planning Framework,Cavalier AS).The onsite power plant has a total capacity of 15 megawatts(Greenwood, 1998—Electronic communication, June 8).Electricity—Off-base. Nodak Electric Cooperative is one of 12 memberownercooperative <strong>and</strong> 12 municipal utilities that are served by theMinnkota Power Cooperative, Inc. (Minnkota Power Cooperative, Inc.,1998—Homepage). Nodak Electric Cooperative provides electricity to aportion of the northwestern part of North Dakota, <strong>and</strong> servesapproximately 12,000 people (Rodgers, 1998—Personal communication).Nodak’s peak dem<strong>and</strong> is approximately 130 megawatts, <strong>and</strong> in 1997 itpurchased approximately 561 million kilowatt-hours of electricity fromMinnkota (Rodgers, 1998—Personal communication).The Minnkota Power Cooperative is a regional generation <strong>and</strong>transmission company that obtains its electricity from the power plantsof the Milton R. Young Station. (Minnkota Power Cooperative, Inc.,1998—Homepage)NMD Deployment Final EIS 3-379
Chapter 3—Affected EnvironmentNatural GasOn-base. The natural gas system for Cavalier AFS was constructed as acooperative effort among Cavalier AFS <strong>and</strong> five local communities.Under the SAFEGUARD program, <strong>and</strong> with the combined efforts of thelocal communities, Montana–Dakota Utilities Company (MDU)constructed approximately 110 kilometers (70 miles) of 15- <strong>and</strong> 20-centimeter (6- <strong>and</strong> 8-inch) lines to connect the installation, <strong>and</strong> the localcommunities, to the existing natural gas system near Devils Lake, NorthDakota. (U.S. Air Force Space Comm<strong>and</strong>, undated—ComprehensivePlanning Framework, Cavalier AS)Natural gas is used for heating as well as to drive the power plantgenerators. Annual use is approximately 3 million cubic meters (107million cubic feet). (Greenwood, 1998—Electronic communication,June 8)Off-base. MDU distributes natural gas <strong>and</strong> propane <strong>and</strong> operates electricpower generation, transmission, <strong>and</strong> distribution facilities in NorthDakota, South Dakota, Montana, <strong>and</strong> Wyoming. MDU’s pipeline supplier,Williston Basin Interstate Pipeline Company, owns three large storagefields. Combined, the three storage fields have a capacity of almost 5.7billion cubic meters (200 billion cubic feet) of natural gas. As theaverage home in MDU’s service area uses 3.1 thous<strong>and</strong> cubic meters(110 thous<strong>and</strong> cubic feet) of gas a year, this storage capacity equals theannual needs of 1.8 million homes. Since summer gas dem<strong>and</strong> is onlyabout one-fourth of the daily amount produced from wells <strong>and</strong> processingplants, MDU diverts the remainder into the storage fields for use duringthe winter. During the winter, on a peak usage day, roughly two-thirdsof MDU’s gas supply comes from the Williston Basin’s storage fields.(Montana–Dakota Utilities Company, 1998—Utility Operations)3.13.2.2 Gr<strong>and</strong> Forks AFB—UtilitiesThis section describes the utilities in the vicinity of Gr<strong>and</strong> Forks AFB.Section 3.13 contains an overview of the utilities resource.Water SupplyOn-base. Gr<strong>and</strong> Forks AFB obtains water for domestic <strong>and</strong> industrialuses from the city of Gr<strong>and</strong> Forks <strong>and</strong> Gr<strong>and</strong> Forks–Traill Water Users,Inc., <strong>and</strong> during the 12-month period from May 1997 to May 1998 thebase used 2.13 billion liters (562 million gallons) of water (Arp, 1998—Personal communication, July 8 <strong>and</strong> Aug 27), or an average of 5.83million liters per day (1.54 million gallons per day). The city of Gr<strong>and</strong>Forks is the primary supplier, typically providing approximately 75percent of the water used, with approximately 25 percent provided bythe base’s secondary source, Gr<strong>and</strong> Forks—Traill Users, Inc. (U.S.3-380 NMD Deployment Final EIS
Chapter 3—Affected EnvironmentDepartment of the Air Force, 1997—Gr<strong>and</strong> Forks AFB General Plan).However, during the recent floods Gr<strong>and</strong> Forks—Traill Water Userssupplied all the base’s water for 44 days, due to the city of Gr<strong>and</strong> Forks’water system being disabled.The base provides no treatment of the water but maintains the basedistribution system. Four elevated tanks provide a water storagecapacity of 7.2 million liters (1.9 million gallons). In addition, there is a1.34-million-liter (355-thous<strong>and</strong>-gallon) reinforced concrete ground tank.(U.S. Department of the Air Force, 1997—Gr<strong>and</strong> Forks AFB General Plan)Off-base. The city of Gr<strong>and</strong> Forks obtains its water from two rivers, theRed River <strong>and</strong> the Red Lake River. They have a treatment capacity of62.5 million liters per day (16.5 million gallons per day). In 1997 theyproduced an average of 30.2 million liters per day (7.97 million gallonsper day) of water with a 15 percent loss. The city of Gr<strong>and</strong> Forks has astorage capacity of 51.1 million liters (13.5 million gallons) of waterwithin their system. (Sletten, 1998—Personal communication)Traill Water Users, Inc. obtains its water from 13 wells that have anormal pumping capacity of 8 thous<strong>and</strong> liters (2 thous<strong>and</strong> gallons) perminute <strong>and</strong> an emergency capacity of 10 thous<strong>and</strong> liters (2.7 thous<strong>and</strong>gallons) per minute. Their treatment capacity is 6.51 million liters perday (1.72 million gallons per day) of soft water or 15 million liters perday (4 million gallons per day) of hard water. They have 2 million liters(0.5 million gallons) of storage at the wells <strong>and</strong> 5.7 million liters (1.5million gallons) of storage in their service area. Their service area has nospecific boundaries, but tends to be limited by the other rural watercompanies that are located to their north, south, <strong>and</strong> west. (Loeslie,1998—Personal communication)Traill Water Users, Inc. sold 1.64 billion liters (433 million gallons) ofwater in fiscal year 1997. In a typical year they sell approximately 320million liters (85 million gallons) of water to Gr<strong>and</strong> Forks AFB. (Loeslie,1998—Personal communication)WastewaterOn-base. The Gr<strong>and</strong> Forks AFB sewage treatment system is operated bythe base <strong>and</strong> is located on base property less than 2 kilometers (1 mile)east of the main base. The treatment system consists of six lift stations,four treatment cells, <strong>and</strong> one tertiary cell. The lift stations are fordischarge into the primary lagoon cell. (U.S. Department of the AirForce, 1997—Gr<strong>and</strong> Forks AFB General Plan)The water is discharged in accordance with a National PollutantDischarge Elimination System (NPDES) permit (Permit No. ND0020621)from the state of North Dakota. The discharge from the lagoon flowsNMD Deployment Final EIS 3-381
Chapter 3—Affected Environmentinto a drainageway of Kelly’s Slough. In 1997 Gr<strong>and</strong> Forks AFBgenerated an average of 3.6 million liters per day (0.96 million gallons perday) of <strong>waste</strong>water. The system’s capacity is approximately 20 millionliters per day (5 million gallons per day). (Arp, 1998—Personalcommunication, July 8 <strong>and</strong> August 27)Off-base. The city of Gr<strong>and</strong> Fork’s <strong>waste</strong>water treatment facility is alagoon system. The system has a capacity of 39.7 million liters per day(10.5 million gallons per day). The average usage is 26 million liters perday (7 million gallons per day). A new activated sludge treatment facilityis currently in planning. This system is expected to come online the earlypart of 2001 <strong>and</strong> have a capacity of 114 million liters per day (30 milliongallons per day). (Goetz, 1998—Personal communication) Much of thearea surrounding Gr<strong>and</strong> Forks AFB is rural, <strong>and</strong> many households are notconnected to public sewage systems. Of the 27,085 households countedwithin Gr<strong>and</strong> Forks County in the 1990 census, 2,790 households (10.3percent) were not connected to a public sewage system (U.S. Bureau ofthe Census, 1995—County & City Data Book 1994, Gr<strong>and</strong> Forks AFB).Solid WasteOn-base. Hardfill, construction debris, <strong>and</strong> inert <strong>waste</strong> generated byactivities at Gr<strong>and</strong> Forks AFB are disposed of at a special use l<strong>and</strong>filllocated on-base. The l<strong>and</strong>fill is permitted by the North DakotaDepartment of Health as a “Special Use Disposal Site.” All on-basemunicipal <strong>and</strong> industrial solid <strong>waste</strong>s are collected by a contractor <strong>and</strong>deposited in the Gr<strong>and</strong> Forks County L<strong>and</strong>fill. (U.S. Department of theAir Force, 1997—Gr<strong>and</strong> Forks AFB General Plan)During the 12-month period from June 1997 to May 1998 approximately3,056 metric tons (3,369 tons) of municipal solid <strong>waste</strong> were generatedat Gr<strong>and</strong> Forks AFB <strong>and</strong> subsequently removed to the Gr<strong>and</strong> ForksCounty l<strong>and</strong>fill (Braun, 1998—Personal communication).The new on-base special use <strong>and</strong> inert solid <strong>waste</strong> l<strong>and</strong>fill <strong>and</strong> l<strong>and</strong>recycling farm is located near the OT-5 area (EDAW, Inc., 1998—TripReport of Visit to North Dakota, June 16-18). The special-use on-basel<strong>and</strong>fill (for construction debris only) occupies 2.6 hectares (6.5 acres)(Koop, 1998—Personal communication) <strong>and</strong> has a capacity ofapproximately 54 thous<strong>and</strong> cubic meters (70 thous<strong>and</strong> cubic yards)(Braun, 1998—Personal communication). The total area of thel<strong>and</strong>fill/l<strong>and</strong> treatment area is approximately 9.7 hectares (24 acres)(EDAW, Inc., 1998—Trip Report of visit to North Dakota, June 16–18).Off-base. Section 3.13.2.1 contains a description of the city of Gr<strong>and</strong>Forks l<strong>and</strong>fill.3-382 NMD Deployment Final EIS
Chapter 3—Affected EnvironmentEnergyElectricity—On-baseCommercial Power. Electricity is provided to Gr<strong>and</strong> Forks AFB by NodakElectric Cooperative. In fiscal year 1997, Gr<strong>and</strong> Forks AFB used 88.6million kilowatt-hours of electricity. Gr<strong>and</strong> Forks AFB’s peak usage ofelectricity is in the winter due to large heating requirements because ofthe cold weather (Anderson, M. 1998—Personal communication).Electrical power purchased from Nodak Electrical Cooperative arrives viatwo 69-kilovolt feeders. (U.S. Department of the Air Force, 1997—Gr<strong>and</strong> Forks AFB General Plan)Backup Power. To provide electrical power to critical facilities on-base incase of emergency, 25 backup generators are installed in or adjoiningbuildings housing airfield control <strong>and</strong> instrumentation, emergencyorganizations, <strong>and</strong> utility services. (U.S. Department of the Air Force,1997—Gr<strong>and</strong> Forks AFB General Plan)Off-base. Nodak Electric Cooperative is one of 12 member-ownercooperative <strong>and</strong> 12 municipal utilities that are served by the MinnkotaPower Cooperative, Inc. (Minnkota Power Cooperative, Inc., 1998—Homepage). Nodak Electric Cooperative <strong>and</strong> the Minnkota PowerCooperative are described in section 3.13.2.1.Natural GasOn-base. Gr<strong>and</strong> Forks AFB purchases natural gas from Northern StatesPower Company, a local distributing company (Arp, 1998—Personalcommunication, July 8 <strong>and</strong> August 27). Annual gas usage at Gr<strong>and</strong>Forks AFB was approximately 271.5 thous<strong>and</strong> decatherms at the mainmeter <strong>and</strong> 459.7 thous<strong>and</strong> decatherms at the central heating plant, for atotal of 731.2 thous<strong>and</strong> decatherms (Arp, 1998—Personalcommunication, July 14). This is the amount of energy in approximately1 billion cubic meters (38 billion cubic feet) of natural gas.The on-base gas distribution system begins at the metering station nearthe main gate entrance (U.S. Department of the Air Force, 1997—Gr<strong>and</strong>Forks AFB General Plan).Off-base. Northern States Power Company, headquartered inMinneapolis, Minnesota, <strong>and</strong> its wholly owned subsidiary, NorthernStates Power Company–Wisconsin, operate generation, transmission,<strong>and</strong> distribution facilities providing electricity to about 1.4 millioncustomers in Minnesota, Wisconsin, North Dakota, South Dakota, <strong>and</strong>Michigan. (Northern States Power Company, 1998—About NSP)NMD Deployment Final EIS 3-383
Chapter 3—Affected EnvironmentIn North Dakota, Northern States Power Company provides natural gas tomore than 30,000 customers in the communities of Buffalo, Casselton,Emerado, Fargo, Gr<strong>and</strong> Forks, Horace, Mapleton, Oriska, Thompson,Tower City, <strong>and</strong> West Fargo (Northern States Power Company, 1999—Service Area in North Dakota). Northern States Power Company’s 1997annual sales for the Gr<strong>and</strong> Forks area was 4.36 million decatherms (Arp,1998—Personal communication, July 14), which is the amount of energyin approximately 117 million cubic meters (4.14 billion cubic feet) ofnatural gas.3.13.2.3 <strong>Missile</strong> Site Radar—UtilitiesThis section describes the utilities in the vicinity of the <strong>Missile</strong> Site Radar.Section 3.13.2 contains an overview of the utilities resource.Because the <strong>Missile</strong> Site Radar is in caretaker status, there is currentlylittle to no utility usage at the site.Water SupplyOn-base. The original onsite water distribution system that served thesite is still in place <strong>and</strong> substantially intact. This system is currentlygovernment owned, but privatization efforts are being made. Thegovernment owned, onsite pumphouse was refurbished <strong>and</strong> canpressurize the distribution system. The four pumps currently in thepumphouse are in good condition. Two of the pumps are electric motordriven <strong>and</strong> are rated at 810 liters (214 gallons) per minute. The othertwo pumps may be driven by either electric motor or internal combustionengine. They are rated at <strong>3.7</strong> thous<strong>and</strong> liters (1.0 thous<strong>and</strong> gallons) perminute with electric motor <strong>and</strong> 5.7 thous<strong>and</strong> liters (1.5 thous<strong>and</strong> gallons)per minute with engine drive. A 1.5-million-liter (400-thous<strong>and</strong>-gallon)reservoir is onsite that can be filled by the government-owned distributionsystem or a commercial water system connection. <strong>Missile</strong> Site Radar hasrecently switched the source of its water supply to Langdon Rural WaterUsers, a commercial water supplier. (Greenwood, 1998—Electroniccommunication, July 13)Off-base. Langdon Rural Water Users is a rural water distributor thatobtains all its water from the city of Langdon Water Department.Langdon Rural Water Users purchases only treated water. They provided217 thous<strong>and</strong> liters (57.5 thous<strong>and</strong> gallons) of water to their customersin calendar year 1997. Langdon Rural Water Users services the ruralareas around the city of Langdon, North Dakota. (Wenzel, 1998—Personal communication)The Water Department of the city of Langdon obtains its raw water fromMount Carmel Dam <strong>and</strong> Mulberry Creek. They have a treatment capacityof 3.54 million liters (935 thous<strong>and</strong> gallons) per day <strong>and</strong> produced3-384 NMD Deployment Final EIS
Chapter 3—Affected Environmentapproximately 477 million liters (126 million gallons) of treated water in1997. They have a storage capacity of approximately 4 million liters (1million gallons). Their service area is the city of Langdon. (Anderson, R.1998—Personal communication)WastewaterOn-base. The onsite sewage treatment system consists of a two-cellevaporative sewage lagoon, sewage collection piping to existing facilities,<strong>and</strong> a lift station. Currently there is no measurable sewage discharge tothe lagoon. The only use of the system during caretaker operation hasbeen to manage groundwater on the site to keep lower levels of thefacilities from flooding. The force main from the lift station to the lagooncurrently requires repair <strong>and</strong> the lagoon, although functional, wouldrequire repairs if the site were reactivated. The lagoon capacity isapproximately 130 million liters (34 million gallons). Pumping capacity ofthe lift station is nominally 1,900 liters (500 gallons) per minute at 26meters (85 feet) total head. There are two pumps. (Greenwood, 1998—Electronic communication, July 13)Off-base. Approximately 21 kilometers (13 miles) of <strong>waste</strong>watercollection sewers serve the city of Langdon. Six sanitary lift stationspump <strong>waste</strong>water through forcemains to approximately 20.8 hectares(51.3 acres) of facultative treatment lagoons. The city of Langdon isnearing completion of a phased pump <strong>and</strong> control replacement project foreach of the lift stations. The lagoons are typically discharged semiannuallyto a stream that flows northwesterly away from the city.(Cavalier County Job Authority, 1998—Building Our County’s Future)Solid WasteOn-base. Current average solid <strong>waste</strong> generated at the <strong>Missile</strong> Site Radaris estimated at 3 cubic meters (4 cubic yards) per month. This iscaretaker operation usage. Capacity is mainly limited by requirements.There is no government owned l<strong>and</strong>fill. All <strong>waste</strong> is disposed of offsite ina commercial l<strong>and</strong>fill. (Greenwood, 1998—Electronic communication,July 13)Off-base. Section 3.13.2.1 contains a description of the city of Gr<strong>and</strong>Forks l<strong>and</strong>fill.EnergyElectricity—On-base. Electricity is provided to the <strong>Missile</strong> Site Radar byCavalier Rural Electric Cooperative, which is headquartered in Langdon,North Dakota. Consumption for fiscal year 1997 was 272.4 thous<strong>and</strong>kilowatt-hours, which represents use during caretaker operations. Theexisting service from Cavalier Rural Electric Cooperative provides single<strong>and</strong> 3-phase power. The onsite distribution serves all existing facilities inNMD Deployment Final EIS 3-385
Chapter 3—Affected Environmentthe non-tactical area <strong>and</strong> the radar building in the tactical area <strong>and</strong> isgovernment owned. (Greenwood, 1998—Electronic communication,June 8)Electricity—Off-base. Cavalier Rural Electric Cooperative provideselectricity to Cavalier County <strong>and</strong> a portion of Ramsey County. It servesapproximately 1,500 accounts, which includes approximately 1,200families. Its latest peak <strong>and</strong> low dem<strong>and</strong>s were 8,242 kilowatt-hours inJanuary <strong>and</strong> 3,468 kilowatt-hours in July. In 1997 Cavalier Rural Electricpurchased approximately 37 million kilowatt-hours of electricity fromMinnkota. (Otto, 1998—Personal communication)Cavalier Rural Electric Cooperative, Inc. is one of 12 member-ownercooperative <strong>and</strong> 12 municipal utilities that are served by the MinnkotaPower Cooperative, Inc. (Minnkota Power Cooperative, Inc., 1998—Homepage). Minnkota Power Cooperative is described in section 3.12.2.1.Natural Gas—On-base. The original onsite, government owned naturalgas distribution system is still in place. Leak tests are performed eachyear <strong>and</strong> indicate the system is tight. Cathodic protection on the systemis due to be upgraded in 1998. Service is provided by Montana–DakotaUtilities. (Greenwood, 1998—Electronic communication, July 13)Consumption of natural gas in fiscal year 1997 represents caretakerstatus, <strong>and</strong> was 794.3 decatherms (Greenwood, 1998—Electroniccommunication, July 13). This is the amount of energy in approximately21.4 thous<strong>and</strong> cubic meters (756 thous<strong>and</strong> cubic feet) of natural gas.Natural Gas—Off-base. Montana–Dakota Utilities is described in section3.13.2.1.3.13.2.4 Remote Sprint Launch Site 1—UtilitiesThis section describes the utilities in the vicinity of Remote Sprint LaunchSite 1. Section 3.13.2 contains an overview of the utilities resource.Water SupplyPotable water is not currently available at Remote Sprint Launch Site 1.When it was operational, it was necessary to haul in potable water. Theunderground water tanks are still in place, but the condition of the tanks<strong>and</strong> associated piping <strong>and</strong> pumping systems is assumed to be poor.(Greenwood, 1998—Electronic communication, July 13)WastewaterThere is an existing 2-cell evaporative lagoon at each of the Remote SprintLaunch Sites, which are intact but not used. They could be made3-386 NMD Deployment Final EIS
Chapter 3—Affected Environmentfunctional if necessary. (Greenwood, 1998—Electronic communication,July 13)The system was designed for 100 percent loss of <strong>waste</strong> throughevaporation <strong>and</strong> seepage of up to 7.6 thous<strong>and</strong> liters (2.0 thous<strong>and</strong>gallons) per day (U.S. Army Corp of Engineers, 1974—Analysis of ExistingFacilities at SRMSC).Solid WasteOn-base. There is currently no solid <strong>waste</strong> generated or collected atRemote Sprint Launch Site 1. If needed, refuse collection could beobtained by commercial contract with local service agencies.(Greenwood, 1998—Electronic communication, July 13)Off-base. Section 3.13.2.1 contains a description of the city of Gr<strong>and</strong>Forks l<strong>and</strong>fill.EnergyElectricity—On-base. Electricity is not currently available at RemoteSprint Launch Site 1. Commercial power could be provided to RemoteSprint Launch Site 1 from nearby sources if required. (Greenwood,1998—Electronic communication, July 13)Electricity—Off-base. Electricity in the areas surrounding the RemoteSprint Launch Sites is provided by Minnkota Power Cooperative, Inc.through one of its 12 member-owner cooperatives (Minnkota PowerCooperative, Inc., 1998—Homepage). Minnkota Power Cooperative isdescribed in section 3.13.2.1.Natural Gas—On-base. Natural gas service is not currently available atRemote Sprint Launch Site 1 (Greenwood, 1998—Electroniccommunication, July 13).3.13.2.5 Remote Sprint Launch Site 2—UtilitiesThe utilities that service Remote Sprint Launch Site 2 are the same asdescribed for Remote Sprint Launch Site 1.3.13.2.6 Remote Sprint Launch Site 4—UtilitiesThe utilities that service Remote Sprint Launch Site 4 are the same asdescribed for Remote Sprint Launch Site 1.NMD Deployment Final EIS 3-387
Chapter 3—Affected Environment3.14 WATER RESOURCESThis section describes the existing water resource conditions at each ofthe proposed sites. Water resources include surface water, groundwater,water quality, <strong>and</strong> flood hazard areas. Marine water resources are alsodiscussed for the proposed fiber optic cable lines in Alaska. See section<strong>3.7</strong>, Hazardous Materials <strong>and</strong> Hazardous Waste Management, for existingwater contamination, <strong>and</strong> section 3.13, Utilities, for a discussion ofwater-related utilities.The Federal Water Control Amendments of 1972, commonly known asthe Clean Water Act (CWA), established a national strategy to restore<strong>and</strong> maintain the chemical, physical, <strong>and</strong> biological integrity of thenation’s water. Under the CWA, the U.S. EPA is the principal permitting<strong>and</strong> enforcement agency. The CWA functions primarily by requiringpermits for activities that result in the discharge of water pollutants fromboth point sources (i.e., discharge pipes, ditches, etc.) <strong>and</strong> non-pointsources (i.e., agricultural l<strong>and</strong>s, construction sites, <strong>and</strong> dredge <strong>and</strong> filloperations).The 1987 amendments to the CWA required the U.S. EPA to establish anNPDES permit program for storm water discharges associated withindustrial activities. Industrial operations that result in the discharge ofstorm water are permitted under an individual or multi-sector industrialpermit. The U.S. EPA renewed the NPDES Storm Water ConstructionGeneral Permit on February 17, 1998 <strong>and</strong> amended the Multi-SectorIndustrial Permit on September 30, 1998. The amended Multi-Sectorpermit covers those industries previously covered under the expiredBaseline General Permit. A Notice of Intent to Obtain Coverage under anNPDES Storm Water Construction General Permit must be filed with theU.S. EPA or appropriate state agency for construction activities thatresult in the disturbance of 2 hectares (5 acres) or more in area. Thepreparation of an SWPPP is also required.Section 404 of the CWA established the Federal program that regulatesactivities in the nation’s wetl<strong>and</strong>s. Specifically, Section 404 of the CWAestablished a program to regulate the discharge of dredged <strong>and</strong> fillmaterial into waters of the United States, including wetl<strong>and</strong>s. Refer tosection 3.4, Biological Resources, for a discussion of wetl<strong>and</strong>s.Executive Order 11988, Floodplain Management, was established in1977 “to avoid to the extent possible the long <strong>and</strong> short term adverseimpacts associated with the occupancy <strong>and</strong> modification of floodplains<strong>and</strong> to avoid direct or indirect support of floodplain developmentwherever there is a practicable alternative.” All Federal <strong>and</strong> Federallysupported activities are required to comply with Executive Order 11988.3-388 NMD Deployment Final EIS
Chapter 3—Affected Environment3.14.1 ALASKA INSTALLATIONSStorm water management activities within the State of Alaska aregoverned by Title 18 Environmental Conservation, Chapter 60, Article 2of the Alaska Administrative Code in accordance with 40 CFR 122.26.Other applicable codes include Title 18 Environmental Conservation,Chapter 70 Water Quality St<strong>and</strong>ards; Title 11 Natural Resources, Part 6L<strong>and</strong>s, Chapter 93 Water Management; <strong>and</strong> Title 46 Water, Air, Energy,<strong>and</strong> Environmental Conservation. For construction projects, a copy of theNotice of Intent <strong>and</strong> SWPPP prepared for the U.S. EPA must be providedto the Alaska Department of Environmental Conservation.3.14.1.1 Clear AFS—Water ResourcesThe water resources ROI includes all surface water features, drainageareas, <strong>and</strong> underlying aquifers that could be affected by construction oroperations. This area includes Clear AFS <strong>and</strong> an area withinapproximately 2 kilometers (1 mile) of the base boundary (figure 3.14-1).Surface WaterClear AFS is located in the Nenana River watershed, USGS CatalogingUnit 19040508 (U.S. EPA, 1998—Surf Your Watershed). Surface waterflow on Clear AFS follows the topography in a northeasterly direction.Runoff follows several small creeks north of the station that flow into theNenana River (U.S. Department of the Air Force, 1997—Supplemental EAfor Radar Upgrade, Clear AS). Due to the low mean annual precipitationfor the area of 33 centimeters (13 inches), very little overl<strong>and</strong> flowoccurs other than at spring breakup (Clear AS, 1998—Draft Solid WasteManagement Plan). The 100-year floodplain of the Nenana River isrestricted to the westernmost portion of the installation (U.S. Departmentof the Air Force, 1997—Supplemental EA for Radar Upgrade, Clear AS).There are four primary bodies of water contained on or bordering ClearAFS. The largest of these bodies of water is the Nenana River, whichruns along the entire west boundary of Clear AFS. The other waterbodies, Lake Sansing, the power plant cooling ponds, <strong>and</strong> the radarcooling water reject ditch, are man-made. There are approximately 1.6kilometers (1 mile) of relatively undisturbed wilderness between theNenana River <strong>and</strong> any developed area on Clear AFS. Lake Sansing is agroundwater infiltration area (approximately 5 hectares [12 acres])contained in an old gravel borrow pit, <strong>and</strong> is fed by the radar operationscooling pond overflow via the reject ditch <strong>and</strong> by rainfall. The coolingpond is an unlined reservoir (approximately 3 hectares [8 acres]) thatreceives water via underground pipe from the power plant. (U.S.Department of the Air Force, 1997—Supplemental EA for Radar Upgrade,Clear AS)NMD Deployment Final EIS 3-389
Index MapAnderson RoadClear AFSAlaskaNenana River100 Year FloodplainPhased-Array RadarLake SansingCooling Water DitchFish HatcheryCoolingPondTech SiteComposite AreaCampSiteClear AirportRadio RelayStationClear Air Force StationAlaska RailroadParks HighwayEXPLANATIONRoadsNORTHwr_clas_0013-390L<strong>and</strong> AreaWater Area100 Year FloodplainInstallation BoundaryRailroadsScale0 2,500 5,000 Feet0 762 1,524 MetersNMD Deployment Final EISWater Resources,Clear Air Force StationAlaskaFigure 3.14-1
Chapter 3—Affected EnvironmentOn the developed section of the installation, manmade features have inmany cases altered normal overl<strong>and</strong> flow paths. In all cases, the stormwater is redirected into manmade features or into the surrounding forestto infiltrate into the groundwater or to evaporate. (U.S. Department ofthe Air Force, 1997—Supplemental EA for Radar Upgrade, Clear AS)Clear AFS does not discharge storm water into any waters of the UnitedStates, <strong>and</strong> is currently not required to have an NPDES Multi-SectorIndustrial Storm Water Permit. However, Clear AFS has prepared anSWPPP to establish a system <strong>and</strong> guidelines to reduce or eliminatepotential storm water pollution. (Clear AS, 1998—Draft Storm WaterPollution Prevention Plan)GroundwaterThe groundwater within the ROI occurs in an unconfined aquifer composedof unconsolidated s<strong>and</strong> <strong>and</strong> gravel. Depth to water ranges fromapproximately 17 to 20 meters (55 to 65 feet) below the surface, <strong>and</strong>tends to flow north at a gradient of about 1 meter (3 feet) per mile. Thegroundwater receives its recharge from the infiltration from the NenanaRiver, surface water features, <strong>and</strong> precipitation. The groundwaterdischarges about 8 kilometers (5 miles) north of Clear AFS into JuliusCreek <strong>and</strong> Clear Creek. (Clear AS, 1998—Draft Solid Waste ManagementPlan)Water for domestic <strong>and</strong> industrial use at Clear AFS is obtained from 15wells completed to depths of approximately 46 meters (150 feet) (U.S.Department of the Air Force, 1997—Supplemental EA for Radar Upgrade,Clear AS).Water QualityWater quality is subject to seasonal variations, but all within establishedU.S. EPA drinking water st<strong>and</strong>ards (water resources appendix). There areseveral water supply wells down gradient from the l<strong>and</strong>fill that arechecked for water quality on a regular basis. No contaminates weredetected in monitoring wells installed around the site l<strong>and</strong>fill during theprevious monitoring of groundwater at the l<strong>and</strong>fill. (Clear AS, 1998—Draft Solid Waste Management Plan)3.14.1.2 Eareckson AS—Water ResourcesThe water resources ROI includes all surface water features, drainageareas, <strong>and</strong> underlying aquifers that could be affected by construction oroperations. This area includes all of Shemya Isl<strong>and</strong> (figure 3.14-2).NMD Deployment Final EIS 3-391
Index MapEarecksonASAlaskaShemya PassBering SeaRUNWAY "C" - Ab<strong>and</strong>onedRUNWAY "B" - Ab<strong>and</strong>oned10,000' RUNWAY - ActiveFoxBeachPacific OceanEXPLANATIONRoadsNORTHwr_eas_0013-392L<strong>and</strong> AreaWater AreaWatershed AreaWater GalleryScale0 1,738 3,475 feet0 530 1,059 metersNMD Deployment Final EISWater Resources,Eareckson Air StationAlaskaFigure 3.14-2
Chapter 3—Affected EnvironmentSurface WaterEareckson AS is located in the Shemya Isl<strong>and</strong> watershed. Surface waterflow on Eareckson AS follows the topography in a south–southwestdirection, although the east <strong>and</strong> west halves of the isl<strong>and</strong> are distinctdrainage systems. Drainage is generally poor in the interior of the isl<strong>and</strong>,resulting in st<strong>and</strong>ing water. There is no record of either rainfall inducedor coastal flooding on Shemya Isl<strong>and</strong>. The small drainage area of theinterior is not likely to result in flooding, <strong>and</strong> the coastline is sufficientlyhigh such that 100-year storm waves would not top the beach crest.However, a tsunami line has been established at the 30-meter (100-foot)elevation mark (U.S. Department of the Air Force, 1997-Final Installation-Wide Environmental Baseline Survey; U.S. Air Force, 1995—NaturalResources Plan; U.S. Department of the Air Force, undated—EA ShemyaBorrow Pit <strong>and</strong> Rock Quarry Plan).Numerous lakes <strong>and</strong> ponds exist on the isl<strong>and</strong>, generally in the northern<strong>and</strong> western one thirds. Except for the western Lake Complex, most ofthe lakes <strong>and</strong> ponds have poorly defined drainage basins. Frost ponds,open pits, <strong>and</strong> st<strong>and</strong>ing water are a result of the poor drainage on theisl<strong>and</strong>. Many of the lakes <strong>and</strong> ponds are situated near surface waterdivides or high points, <strong>and</strong> a significant portion of the availableprecipitation is absorbed by surficial <strong>and</strong> near-surface deposits. Theremaining water is discharged by streams or springs on the southerncoastline. There is not a large runoff on the northern coast of the isl<strong>and</strong>due to the increasing northern elevation. (U.S. Department of the AirForce, undated—EA Shemya Borrow Pit <strong>and</strong> Rock Quarry Plan; U.S. AirForce, 1995—Eareckson AS, Draft Management Action Plan; U.S. AirForce, 1995—Natural Resources Plan)A small watershed located in the eastern part of the isl<strong>and</strong> that covers anarea of approximately 103 hectares (255 acres) is the recharge area forpotable water at Eareckson AS (U.S. Air Force, 1994—Eareckson AFSStorm Water Pollution Prevention Plan). Within this area, surface waterinfiltrates into a shallow unconfined aquifer.Storm water flows overl<strong>and</strong> <strong>and</strong> through culverts, eventually reachingoutfall locations at the ocean. Outfalls usually discharge storm watermixed with groundwater that seeps into the drainage channels.Eareckson AS has an NPDES Multi-Sector Industrial Storm Water Permit<strong>and</strong> SWPPP that document existing conditions <strong>and</strong> establish practices forprevention of storm water pollution. (U.S. Air Force, 1994—EarecksonAFS Storm Water Pollution Prevention Plan; Shoviak, 1999—Personalcommunication)NMD Deployment Final EIS 3-393
Chapter 3—Affected EnvironmentGroundwaterThe varying lithology <strong>and</strong> structural influences found on the isl<strong>and</strong> createa relatively complex hydrogeological environment. Both confined <strong>and</strong>unconfined aquifers occur on the isl<strong>and</strong>, with some areas having multiplezones of saturation. Groundwater can be encountered either in thesurface peat layer that occurs over much of the isl<strong>and</strong>, or in theunconsolidated s<strong>and</strong> <strong>and</strong> gravel that occurs primarily in the southerncoastal area, or in the fractured bedrock in the central portion of theisl<strong>and</strong>. The general trend for the isl<strong>and</strong> is that groundwater depthincreases with an increase in surface elevation. Depth to water variesfrom approximately 3 meters (10 feet) to more than 60 meters (200 feet)below ground surface. (U.S. Department of the Air Force, undated—EAShemya Borrow Pit <strong>and</strong> Rock Quarry Plan; U.S. Air Force, 1995—DraftManagement Action Plan)Groundwater flow within the unconsolidated deposits closely follows thesurface topography. Most water finds its way into the fractures in thebedrock where it is stored. General direction of water flow within thebedrock follows surface topography also, suggesting that gravity is moredominant than fracture flow. An east–west trending groundwater divideoccurs somewhere within the northern one third of the isl<strong>and</strong>. To thesouth of this divide, groundwater flow is predominantly to thesouth/southwest. To the north of this divide, groundwater flow ispredominantly to the north/northeast. All of the potential aquifers on theisl<strong>and</strong> are either quite thin, have low porosity, or have low permeability.(U.S. Department of the Air Force, undated—EA Shemya Borrow Pit <strong>and</strong>Rock Quarry Plan; U.S. Air Force, 1995—Draft Management Action Plan)Potable water is collected through an infiltration gallery system installedin the 1950s. Four horizontal infiltration collectors are installed belowthe peat layer of the shallow unconfined aquifer. Groundwater from thepeat layer enters the collectors <strong>and</strong> flows to a central holding tank. Thewater is pumped to the water treatment plant, where it is treated fordomestic use, chlorinated, <strong>and</strong> then pumped into three water storagereservoirs for domestic <strong>and</strong> construction uses. Two wells provide up to416 liters (110 gallons) per minute of water as a backup to the watergallery system. (U.S. Department of the Air Force, undated—EA ShemyaBorrow Pit <strong>and</strong> Rock Quarry Plan)Water QualitySurface water <strong>and</strong> groundwater quality is generally good except inisolated areas of known contamination. Water pumped from the watergallery is treated in the water treatment plant before domestic use.Drinking water quality is subject to seasonal variations but is generallywithin established U.S. EPA drinking water st<strong>and</strong>ards (U.S. Departmentof the Air Force, undated—EA Shemya Borrow Pit <strong>and</strong> Rock Quarry Plan).3-394 NMD Deployment Final EIS
Chapter 3—Affected EnvironmentHowever, drinking water samples have exceeded the 1993 action levelsfor lead <strong>and</strong> copper (U.S. Department of the Air Force, 1997—FinalInstallation-Wide Environmental Baseline Survey).3.14.1.3 Eielson AFB—Water ResourcesThe water resources ROI includes all surface water features, drainageareas, <strong>and</strong> underlying aquifers that could be affected by construction oroperations. The ROI includes all of Eielson AFB <strong>and</strong> a buffer area ofapproximately 3 kilometers (2 miles) that includes proposed action areason the Yukon Training Area (figure 3.14-3).Surface WaterThe Eielson ROI is located primarily in the Tanana Flats watershed, USGSCataloging Unit 19040507 <strong>and</strong> also extends into the Chena Riverwatershed, USGS Cataloging Unit 19040506 (U.S. EPA, 1998—SurfYour Watershed). Surface water bodies near Eielson AFB include rivers,creeks, sloughs, lakes, <strong>and</strong> ponds. Surface drainage at Eielson AFB isgenerally north–northwest, parallel to the Tanana River. Several smallsloughs or creeks pass through the ROI <strong>and</strong> discharge into the TananaRiver. Moose Creek is the main receiving stream for small local drainagesaround the base. French Creek, along the eastern side of the base,discharges into Moose Creek. Garrison Slough also discharges intoMoose Creek. Garrison Slough passes directly through the developedportion of the base <strong>and</strong> consists primarily of engineered drainagechannels. Moose Creek discharges into Piledriver Slough just above theconfluence with the Tanana River. With the exception of a short periodduring spring, the surface water elevation in Garrison Slough is lowerthan the groundwater elevations. This indicates the Garrison Slough is againing stream that receives its recharge from the groundwater duringmost of the year. (U.S. Air Force, 1995—Final Environmental RestorationProgram, Eielson AFB, Operable Units 3, 4, <strong>and</strong> 5; U.S. Department ofthe Air Force, 1998—Draft 1997 Sitewide Monitoring Program Report)Approximately 34 percent of Eielson AFB is within the 100-yearfloodplain (U.S. Air Force, 1997—EA Gravel Borrow Pit in the North Areaof Eielson AFB). The Winter Camp site on the Yukon Training Area is notwithin a floodplain.Eielson AFB operates under an NPDES Multi-Sector Industrial StormWater Permit <strong>and</strong> SWPPP. The SWPPP identifies existing <strong>and</strong> potentialsources of storm water pollution at Eielson AFB <strong>and</strong> defines BestManagement Practices to reduce potential pollution <strong>and</strong> ensurecompliance with permit requirements.NMD Deployment Final EIS 3-395
Index Map(1904506)EielsonAFBRichardson HighwayThe Alaska RailroadTransmitter Rd.Moose CreekAlaskaGarrison SloughManchu TrailFrench CreekQuarry Rd.(1904507)Piledriver SloughTanana River2EXPLANATIONNORTHwr_eafb_0023-396Water Area100 Year FloodplainDrainageRoadsWatershed Boundary(EPA Watershed ID Number)Scale 1:101,0000 .8 1.6 Miles0 1.25 2.5 KilometersRailroadsRoadsInstallation BoundaryBuildingNMD Deployment Final EISWater Resources,Eielson Air Force BaseAlaskaFigure 3.14-3
Chapter 3—Affected EnvironmentGroundwaterGroundwater on the developed part of the base occurs at depths of 2 to3 meters (6 to 10 feet) below ground surface. This is an unconfinedaquifer associated with the Tanana River floodplain. The aquifer is 61 to91 meters (200 to 300 feet) thick <strong>and</strong> overlies the Birch Creek Schist.Flow directions are usually to the north–northwest <strong>and</strong> parallel the flowof the Tanana River. Local variations in flow directions occur on EielsonAFB near surface water bodies, Power Plant pumping supply wells, <strong>and</strong>near melting piles of stored snow that create a source of recharge waterduring breakup.Groundwater elevations in the unconfined aquifer are subject to seasonalfluctuations, with the highest elevation occurring during <strong>and</strong> immediatelyfollowing snowpack melting. The lowest elevations are expected duringthe fall. During winter, a slow rise in water levels is normal. Themagnitude of fluctuations varies from year to year, but generally is in therange of 0.5 to 0.6 meter (1.5 to 2.0 feet). (U.S. Air Force, 1995—FinalEnvironmental Restoration Program, Eielson AFB, Operable Units 3, 4,<strong>and</strong> 5; U.S. Department of the Air Force, 1998—Draft 1997 SitewideMonitoring Program Report)Groundwater in the upl<strong>and</strong> portion of the base occurs at depths ofapproximately 15 to 91 meters (50 to 300 feet) in a fractured bedrockaquifer. Downgradient flowpaths are not well defined in this aquifer.Groundwater flow in the bedrock aquifer is controlled largely by theheterogeneities in the bedrock such as fractures or relatively permeablelenses <strong>and</strong> layers. (U.S. Air Force, 1995—Final EnvironmentalRestoration Program, Eielson AFB, Operable Units 3, 4, <strong>and</strong> 5)Groundwater is the only source of potable water used at Eielson AFB.Additional private <strong>and</strong> agricultural wells are located within a 5-kilometer(3-mile) radius of the base. These wells are located downgradient,north–northwest, <strong>and</strong> to the west of the base. The community of MooseCreek depends upon a public water system (groundwater) <strong>and</strong> on privatewells. Groundwater is also utilized for emergency <strong>and</strong> fire fightingpurposes on Eielson AFB. (U.S. Air Force, 1995—Final EnvironmentalRestoration Program, Eielson AFB, Operable Units 3, 4, <strong>and</strong> 5)Water QualityGroundwater is the principal source for industrial, domestic, agricultural,<strong>and</strong> fire-fighting purposes (U.S. Air Force, 1995—Final EnvironmentalRestoration Program, Eielson AFB, Operable Units 3, 4, <strong>and</strong> 5).Background groundwater quality analyses have shown that the averageiron <strong>and</strong> manganese concentrations typically exceed the secondarymaximum contaminant levels for drinking water. Arsenic has beenidentified as a constituent of concern at Eielson AFB, <strong>and</strong> oneNMD Deployment Final EIS 3-397
Chapter 3—Affected Environmentbackground sample exceeded the primary drinking water st<strong>and</strong>ard of 50micrograms per liter (U.S. Air Force, 1993—Environmental RestorationProgram, Eielson AFB, Background Ground—Water Quality; U.S.Department of the Air Force, 1998—Draft 1997 Sitewide MonitoringProgram Report).Surface water is not utilized for drinking water in the Eielson AFB area.(U.S. Air Force, 1995—Final Environmental Restoration Program, EielsonAFB, Operable Units 3, 4, <strong>and</strong> 5). Water sampling of Garrison Sloughhas identified volatile organic compounds at levels below the U.S. EPAdrinking water maximum contaminant levels. Low levels of pesticideswere detected in 1993; however, no pesticides were detected in 1994.(U.S. Department of the Air Force, 1998—Draft 1997 SitewideMonitoring Program Report)3.14.1.4 Fort Greely —Water ResourcesThe water resources ROI includes all surface water features, drainageareas, <strong>and</strong> underlying aquifers that could be affected by construction oroperations. This includes the cantonment area <strong>and</strong> an adjacent areaseveral miles south from the cantonment boundary (figure 3.14-4).Surface WaterFort Greely is in the Delta River watershed, USGS Cataloging Unit19040504 (U.S. EPA, 1998—Surf Your Watershed). The Delta River tothe west <strong>and</strong> Jarvis Creek immediately east are the two primarydrainages for the Fort Greely ROI. Both are glacier-fed <strong>and</strong> silt-laden.The peak flow in these water systems is reached in late summer, whensnow <strong>and</strong> ice melt is augmented by rainfall. Minimum flow occurs inwinter when precipitation occurs as snow. (Alaskan Air Comm<strong>and</strong>,1990—Installation Restoration Program, Site 3, Fort Wainwright L<strong>and</strong>fill)Other surface water bodies within the ROI are intermittent, unnamedcreeks, <strong>and</strong> lakes. Jarvis Creek <strong>and</strong> Delta River are generally frozen solidduring the winter, but discharges from springs at the mouth of the riverhave been measured at about 0.8 cubic meter (30 cubic feet) per second.Discharges measured on the Delta River 3 kilometers (1.8 miles) south ofBig Delta range from nearly 283 cubic meters (10,000 cubic feet) persecond in July to 0.7 cubic meter (24 cubic feet) per second in October.Similar discharge measurements for Jarvis Creek at the RichardsonHighway range from 25 cubic meters (880 cubic feet) per second in Julyto no flow from November to March. (U.S. Army Corps of Engineers,1996—Final Report, Postwide Site Investigation, Fort Greely)3-398 NMD Deployment Final EIS
Allen ArmyAirfieldIndex MapFt. GreelyDelta River2AlaskaCantonmentArea1Main Post33 Mile LoopMeadowsRoadRichardson HighwayPumpingStationJarvis CreekOld Richardson HwyEXPLANATIONNORTHwr_fge_001Fort GreelyRoadsDrainageRunways12Scale 1:80,0000 3,334 6,667 feet0 1,016 2,032 metersInstallation BoundaryTrans-Alaska PipelineMain Post BoundaryCantonment Area BoundaryOutfall1-StormwaterOutfall2-StormwaterNMD Deployment Final EISWater Resources,Fort GreelyAlaskaFigure 3.14-43-399
Chapter 3—Affected EnvironmentAlthough floodplain boundaries have not been developed for the ROI,there is a low probability of flooding. High flows in the Delta Riveroverflow to the west rather than toward the ROI. Jarvis Creekoverflowed into an old channel during a 1967 flood. Since a barrier wasplaced at the overflow location, flooding along the old channel has notoccurred. (U.S. Department of the Army, 1999—Alaska Army L<strong>and</strong>sWithdrawal Renewal Final Legislative EIS)Due to the relatively flat terrain <strong>and</strong> permeable soils within the ROI, muchof the storm water runoff infiltrates before it reaches a water body. FortGreely operates under an NPDES Multi-Sector Industrial Storm WaterPermit <strong>and</strong> SWPPP (Johnson, D., 1999—Personal communication, March24). The SWPPP identifies two outfalls from the main cantonment area.One discharges into Jarvis Creek, <strong>and</strong> the other discharges within 183 to213 meters (600 to 700 feet) of Jarvis Creek (U.S. Army Corps ofEngineers, 1996—Final Report, Storm Water Pollution Prevention Plan,Fort Greely).GroundwaterOne unnamed water-bearing unit has been described in the ROI. Thisunit consists of a lower stratified gravel layer extending at least 52meters (170 feet) below ground surface. One boring completed at FortGreely penetrated the alluvium to depths of 122 meters (400 feet) belowground surface. The lower stratified gravel aquifer has been reported tobe overlain by low-permeability lenses <strong>and</strong> seams that may result in theformation of perched water zones. Although the water table is usuallyreported to lie below the permafrost, the presence of perched water hasbeen documented within the fort boundaries. (U.S. Army Corps ofEngineers, 1996—Final Report, Postwide Site Investigation, Fort Greely)The groundwater flows in a northeasterly direction at a gradient rangingfrom approximately 1.5 to 6 meters (5 to 21 feet) per mile. Groundwaterin the area is recharged continuously by the Delta River <strong>and</strong> by infiltrationof meltwater from the Alaska Range in the late spring <strong>and</strong> early summer.The depth to groundwater ranges from 53 meters (175 feet) to at least91 meters (300 feet) below ground surface, <strong>and</strong> fluctuates in response toseasonal recharge. As of 1983, there were five usable wells, locatednear the north end of the existing post, with an estimated combinedcapacity in excess of 15 million liters (4 million gallons) per day. (U.S.Army Corps of Engineers, 1996—Final Report, Postwide SiteInvestigation, Fort Greely)Water QualitySurface water quality samples meet the primary drinking waterst<strong>and</strong>ards; however, the concentrations of aluminum, iron, <strong>and</strong>manganese were higher than the secondary st<strong>and</strong>ards. Measurements of3-400 NMD Deployment Final EIS
Chapter 3—Affected EnvironmentpH on Fort Greely were within the state st<strong>and</strong>ards. The average annualsediment yield for the Delta River is 420 metric tons per square kilometer(1,200 tons per square mile), most of which is transported during thesummer. (U.S. Department of the Army, 1999—Alaska Army L<strong>and</strong>sWithdrawal Renewal Final Legislative EIS)Groundwater quality in the vicinity of Fort Greely is considered good for apotable water supply (U.S. Army Corps of Engineers, 1996—Final Report,Postwide Site Investigation, Fort Greely). In a recent study, all of thewater quality parameters were within the state drinking water st<strong>and</strong>ards(U.S. Department of the Army, 1999—Alaska Army L<strong>and</strong>s WithdrawalRenewal Final Legislative EIS).3.14.1.5 Yukon Training Area (Fort Wainwright)—Water ResourcesThe water resources ROI is described under Eielson AFB, section3.14.1.3, <strong>and</strong> includes all surface water features, drainage areas, <strong>and</strong>underlying aquifers that could be affected by construction or operations.The ROI includes all of Eielson AFB <strong>and</strong> a buffer area of several milesaround the proposed GBI site.Surface WaterSee section 3.14.1.3. The Yukon Training Area operates under the FortWainwright NPDES Multi-Sector Storm Water Permit <strong>and</strong> SWPPP.GroundwaterSee section 3.14.1.3.Water QualitySee section 3.14.1.3.3.14.1.6 Alaska—Fiber Optic Cable Line—Water ResourcesThis section describes the water resources <strong>and</strong> water quality for the fiberoptic cable line ROI. The potential fiber optic cable line would beinstalled to connect Eareckson AS to existing fiber optic cables at Sewardor Whittier as shown in figure 2.4.5-1. The fiber optic cable line routewould cross approximately 4,000 kilometers [2,500 miles)] of oceanfloor. The route would start in either Whittier, in Prince William Sound,or Seward, adjacent to the Gulf of Alaska. It would then cross the Gulfof Alaska <strong>and</strong> the Bering Sea.In addition to this route, a second redundant route may be required. Theexact alignment of this route has not been identified but could be northof the Aleutian Isl<strong>and</strong>s or connect to existing fiber optic cable in thecentral Pacific. Provided below is a description of the known fiber opticNMD Deployment Final EIS 3-401
Chapter 3—Affected Environmentcable route starting in either Whittier or Seward. Once the second routeis identified, additional environmental analysis would be conducted.Prince William SoundPrince William Sound is a semi-enclosed 100-by-160-kilometer (60-by-100-mile) body of seawater in Southcentral Alaska that is bounded onthe north <strong>and</strong> west by the south-central coastline <strong>and</strong> on the east <strong>and</strong>south by isl<strong>and</strong>s that separate it from the Gulf of Alaska. The greatestdepths in Prince William Sound are close to 3,650 meters (12,000 feet)deep. The deepest water is found in a series of basins west of NakedIsl<strong>and</strong>. Typically, however, water depths throughout the sound rangefrom 200 to 400 meters (650 feet to 1,300 feet). Hinchinbrook Entranceis 140 meters (460 feet) deep, <strong>and</strong> Montague Strait is 265 meters (875feet) deep. Shallow sills at these entrances restrict the movement ofwater between the gulf <strong>and</strong> the sound.Surficial sediments in much of Prince William Sound are fine glacial clay<strong>and</strong> silt overlaying graywacke or shale (Sharma, 1979—The AlaskanShelf). Depth of the fine sediment layer is greater in the deeper areasfurther from the glacial sources of much of the sediment input. Softsediments are composed of 30 to 40 percent silt <strong>and</strong> 60 to 70 percentclay. Graywacke, shale, <strong>and</strong> scattered igneous extrusions are exposedthroughout the sound.Prince William Sound tidal currents flood <strong>and</strong> ebb through the entrances tothe sound. Predicted velocities are not available for any of thesechannels. However, the sound contains a large volume of water <strong>and</strong> ishighly affected by tidal variations. Since shallow sills limit the flow intothe passes, flood <strong>and</strong> ebb velocities can be assumed to be over 5kilometers per hour (3 miles per hour) at maximum flow. Net circulationof seawater in the sound is in from the east <strong>and</strong> out to the south; watersenter through Hinchinbrook Entrance, flow to the southwest aroundKnight Isl<strong>and</strong>, <strong>and</strong> then flow out through the sound’s southwest passages.Waves in Prince William Sound seldom reach heights over 2 meters (6feet), <strong>and</strong> then only in the open areas of the eastern sound. Tidal rangein the sound is typically 4 to 5 meters (12 to 15 feet).The North Pacific Basin, including the Gulf of Alaska <strong>and</strong> Prince WilliamSound, is subject to tsunamis, or seismic ocean waves. Eighty percentof tsunamis reported between 1928 <strong>and</strong> 1963 occurred in this region.These are very long period waves generated by earthquakes. Underwaterl<strong>and</strong>slides set off by an earthquake may be the direct cause, as largevolumes of water may be displaced very quickly by such events. Thelength between crests may be several hundred kilometers, <strong>and</strong> they travelat speeds up to 900 kilometers per hour (560 miles per hour). In thedeep ocean the wave height may be under 1 meter (3.3 feet). The3-402 NMD Deployment Final EIS
Chapter 3—Affected Environmentwavelength shortens <strong>and</strong> the height increases as a tsunami approachesshallow water. When it hits a coastline, a tsunami pushes a tremendousvolume of water up the shoreline, which then drains back down rapidly.The tremendous volume washing up the shoreline at high speed, ratherthan wave height, does the damage. (U.S. Department of the Interior,1974—The Western Gulf of Alaska)Water temperatures in the sound range from just above freezing duringthe winter <strong>and</strong> spring to as high as 15°C (60°F) during August. Salinityof surface water in the sound ranges from 30.5 parts per thous<strong>and</strong> in latewinter to a high of about 32.5 parts per thous<strong>and</strong> in the central sound insummer. Temperature <strong>and</strong> salinity variations are the result freshwaterinputs from streams mixing with the offshore oceanic water massentering through Hinchinbrook Entrance (Sharma, 1979—The AlaskanShelf).Information on turbidity is not available for the deep waters of PrinceWilliam Sound. However, turbidity values are generally low for most ofthe year, with the exception of spring, when plankton blooms. Turbidityis higher near the mainl<strong>and</strong> shore.Gulf of AlaskaThe Gulf of Alaska is bounded on the north by the shoreline of southcentralAlaska <strong>and</strong> extends from southeast Alaska westerly to UnimakPass near the tip of the Alaska Peninsula (Sharma, 1979—The AlaskanShelf). It is bounded on the south by the eastward flowing sub-arcticcurrent in the North Pacific Ocean. It is the terminus of one of theworld’s largest storm tracks, resulting in weather conditions in the gulfthat tend toward the extreme, especially during the winter.The Gulf of Alaska has several bathymetric regions (Sharma, 1979—TheAlaskan Shelf). The continental shelf east of Kodiak Isl<strong>and</strong> is a relativelyshallow, flat shelf environment. The greatest depths in this area areabout 275 meters (900 feet) deep. The shelf extends up to 250kilometers (150 miles) offshore. To the south <strong>and</strong> west of Kodiak Isl<strong>and</strong>the continental shelf is narrower. This area is characterized by shoals,isl<strong>and</strong>s, <strong>and</strong> undersea canyons that break up the smooth shelfenvironment. Ocean depths of 3,700 meters (12,000 feet) can be foundwithin 50 kilometers (30 miles) of the coast. Approximately 140kilometers (85 miles) south of the shoreline at Nikolski, ocean depthsdrop to over 7,200 meters (23,500 feet).Sediments underlying the Gulf of Alaska are a mixture of glacial fines,silt, s<strong>and</strong>, gravel, boulders, <strong>and</strong> rock outcrops (Sharma, 1979—TheAlaskan Shelf). Nearshore areas are often covered with fine sedimentsoverlying relict glacial moraines. Soft sediment depths are greater indepressions <strong>and</strong> valleys, <strong>and</strong> shallower along ridgelines. Fine sedimentsNMD Deployment Final EIS 3-403
Chapter 3—Affected Environmentare common near the coast; currents flush the exposed ridges clear ofthe finer sediments. Further offshore, the seabed is dominated by relictglacial moraine.As the eastward flowing Subarctic Current approaches the coastline ofNorth America (the Alaska Current), it flows counterclockwise to thenorth <strong>and</strong> then runs westerly along the Alaska coastline (figure 3.14-5).The U.S. Department of the Interior (1974) reported a net velocity of 0.5kilometer per hour (0.3 knot) across the central Gulf of Alaska.Tidal currents in the Gulf of Alaska run from zero at slack tide to as highas 16 kilometers per hour (9 knots) or even higher through the passes inthe Aleutians Isl<strong>and</strong>s. Storm driven tides may even run over 20kilometers per hour (11 knots).The Alaska Current narrows <strong>and</strong> becomes the Alaska Stream as it moveswest past Kodiak Isl<strong>and</strong>, the Alaska Peninsula, <strong>and</strong> along the AleutianRange. Near 175 degrees west longitude, south of the Aleutian Chain,the Alaska Stream slows <strong>and</strong> splits. Part of the stream turns southerly<strong>and</strong> rejoins the eastbound Subarctic Current, <strong>and</strong> part, assisted by theCoriolis effect, flows north into the Bering Sea. Tidal activity is moderatein the Gulf of Alaska; the typical tidal range is about 2.75 meters (9 feet)at Kodiak.During storms, seas in the Gulf of Alaska are heavy <strong>and</strong> chaotic. Thechaotic wave action results from the short fetch in the gulf (the distancewinds blow unobstructed over water). Maximum unsubstantiated waveheight calculated for the Gulf of Alaska is 15 meters (50 feet) (U.S.Department of the Interior 1974—The Western Gulf of Alaska). Reliableestimates put maximum wave height closer to 9 meters (30 feet). Oceanswells in the open North Pacific have been measured at a height of 34meters (110 feet) (Gross, 1987—Oceanography). The Gulf of Alaska isalso subject to tsunamis.Winter surface seawater temperatures in the Gulf of Alaska ranges from0 to 1°C (32 to 34°F) near shore to offshore temperatures of 2.2 to3.3°C (36 to 38°F). Offshore surface temperatures can reach 11 to12°C (52 to 54 °F) during the summer. Water temperatures below 100meters (330 feet) average 4 to 5°C (39 to 41°F) year-round.Salinity at the surface over the continental shelf ranges from 32.0 to32.2 parts per thous<strong>and</strong> in summer <strong>and</strong> 32.4 to 32.6 parts per thous<strong>and</strong>in winter. Bottom water over the continental shelf is close to 33.0 partsper thous<strong>and</strong> year-round. This is the same salinity as in the NorthPacific, indicating uniformity of subsurface conditions in the Gulf ofAlaska with the North Pacific. (U.S. Department of the Interior 1974—The Western Gulf of Alaska)3-404 NMD Deployment Final EIS
180 o 170 o 160 o 150 o 140 o 130 o 120 o60 o 60oWestBeringSea2 Miles per Day5-10 Miles per DayAlaska StreamSubartic Current1-2 Milesper DayGulf of AlaskaAlaskanGyre50 o 50 oAlaska Current8 Miles per DayWindTransition ZoneDriftSubtropic Region40 oCalifornia Current40 o 180 o 170 o 160 o 150 o 140 o 130 o 120 o4 Miles per DayGeneral Circulation,North Pacific OceanAlaskaNORTHwr_ak_foc_002Not to ScaleNMD Deployment Final EISFigure 3.14-53-405
Chapter 3—Affected EnvironmentTurbidity information is unavailable for the deep waters of the Gulf ofAlaska. However, turbidity values are generally low during winter.During summer, turbidity increases near the surface from planktonblooms. Nearshore turbidity increases from fine-grained glacial sedimentas stream flows increase during summer.Bering SeaThe Bering Sea is bounded by the Comm<strong>and</strong>er <strong>and</strong> Aleutian Isl<strong>and</strong>s onthe south, by Western Alaska on the east, by the Bering Straits on thenorth, <strong>and</strong> by Russia on the west <strong>and</strong> northwest.The Bering Sea is generally shallow, especially over the continental shelfin the eastern <strong>and</strong> northern portions of the sea. It is ice-free for about 6months of the year; maximum winter ice typically covers approximatelyhalf to three-quarters of the Bering Sea (McRoy <strong>and</strong> Goering, 1974—TheInfluence of Ice on the Primary Productivity of the Bering Sea). The floorof the southwestern Bering Sea is typically a smooth abyssal plainsurrounded by steep walls of the continental slope. The abyssal plaincovers approximately 43 percent of the sea floor; the continental shelfcovers approximately 43 percent of the bed; <strong>and</strong> the continental slope,nearly 13 percent of the floor. Depths of 1,900 meters (6,300 feet) arefound within 32 kilometers (20 miles) of the eastern Aleutian coast.Depths above the abyssal plain generally range from 2,500 meters(8,200 feet) to 3,500 meters (11,500 feet). Bower’s Ridge rises fromthe bed of abyssal plain <strong>and</strong> runs north <strong>and</strong> then west from a point twothirds out along the Aleutian Chain. The ridge rises to the surface atSemisopochnoi Isl<strong>and</strong> <strong>and</strong> is about 600 kilometers (375 miles) long.The deeper portions of the Bering Sea have a thick layer of fine sedimentthat was deposited by the Kuskokwim <strong>and</strong> Yukon Rivers when theyflowed south during the last ice age (Sharma, 1979—The Alaskan Shelf).Rocky substrates are found in the Aleutian Chain <strong>and</strong> along Bower’sRidge. The continental shelf in the Bering Sea varies from fine sedimentsnear the rivers in Bristol Bay to coarse s<strong>and</strong> further offshore. There islittle rocky substrate on the continental shelf within the Bering Sea.The general circulation pattern in the Bering Sea flows in acounterclockwise direction (figure 3.14-5). Part of the water masspasses north through the Bering Straits, <strong>and</strong> the balance of the watermass flows west <strong>and</strong> back south, thus continuing the counterclockwiseBering Sea Gyre. The average velocity of the northward flowing currentalong the eastern boundary of the Bering Sea is 0.13 kilometer per hour(0.07 knots).Over half of the Bering Sea is shallow, <strong>and</strong> the fetch is short. Stormscreate chaotic <strong>and</strong> heavy seas. Tidal activity along the southern edge ofthe Bering Sea is the same as that in the adjoining western Gulf of Alaska.3-406 NMD Deployment Final EIS
Chapter 3—Affected EnvironmentIn the central Bering Sea, winter surface water temperatures range from0 to 3°C (32 to 37°F). Surface water temperature in the northern BeringSea is typically at the freezing point, <strong>and</strong> sea ice covers the northerntwo-thirds of the sea. For most of the Bering Sea, summer temperaturesrise to 7 to 8°C (44 to 46°F).Salinity in the Bering Sea is 33 to 34 parts per thous<strong>and</strong> (Favorite, 1974;—Flow Into the Bering Sea through the Aleutian Isl<strong>and</strong> Passes; McAlister<strong>and</strong> Favorite, 1977—Oceanography). Salinity drops near rivers such asthe Yukon River <strong>and</strong> the rivers that drain into Bristol Bay.Turbidity information is unavailable for the waters of the Bering Sea.However, turbidity values are generally low during winter. Duringsummer, turbidity increases from plankton blooms in near-surface waters.Turbidity is higher near the shorelines <strong>and</strong> lower in the offshore areas.Turbidity is expected to be low in the deeper waters below the photiczone.3.14.2 NORTH DAKOTA INSTALLATIONSPotentially applicable North Dakota Administrative Code includes:St<strong>and</strong>ards of Water Quality for the State of North Dakota (Chapters 33-16-02); North Dakota Century Code Section 61-28-01; The Departmentof Health <strong>and</strong> Consolidated Laboratories, North Dakota Title 33, Articles16 <strong>and</strong> 17; <strong>and</strong> North Dakota Water Pollution Control Act (Title 61).For construction projects, a Notice of Intent to Obtain Coverage underNorth Dakota Pollutant Discharge Elimination System General Permit forStorm Water Discharge Associated with Construction Activity must befiled with the North Dakota Department of Health, Division of WaterResources.3.14.2.1 Cavalier AFS—Water ResourcesThe water resources ROI includes all surface water features, drainageareas, <strong>and</strong> underlying aquifers that could be affected by construction oroperations. This area includes Cavalier AFS <strong>and</strong> an area withinapproximately 3 kilometers (2 miles) of the base boundary (figure3.14-6).Surface WaterThe Cavalier AFS ROI includes the Pembina <strong>and</strong> Park watersheds, USGSCataloging Units 09020313 <strong>and</strong> 09020310 (U.S. EPA, 1998—Surf YourWatershed). The Tongue River is located to the north of the CavalierAFS <strong>and</strong> flows to the northeast <strong>and</strong> drains into the Pembina River. TheTongue River has an annual average discharge of 0.63 cubic meter (22.4cubic feet) per second. The Pembina River drains into the Red River justsouth of Pembina. Runoff from the Cavalier AFS flows to theNMD Deployment Final EIS 3-407
Index MapCavalier AFSNorth Dakota(9020313)Tongue River(9020310)Willow CreekEXPLANATIONDrainageRoadsWatershed Boundary (EPA Watershed ID Number)Water Resources,Cavalier Air ForceStationNORTHwr_cas_0013-408Scale 1:40,0000 1,667 3,333 feet0 508 1,016 metersNMD Deployment Final EISNorth DakotaFigure 3.14-6
Chapter 3—Affected Environmentsouth of the site into Willow Creek, a tributary of the Park River. ThePark River travels southeast away from the Cavalier AFS <strong>and</strong> emptiesinto the Red River. Cavalier AFS is not in a 100-year floodplain (CavalierAFS, 1993—Natural Resources Management Plan).Cavalier AFS operates under an NPDES General Permit for Storm WaterDischarges Associated with Industrial Activities. The permit setsst<strong>and</strong>ards for pollutants in storm water discharges, <strong>and</strong> Cavalier AFSmeets the requirements of its permits (U.S. Air Force Space Comm<strong>and</strong>,undated—Comprehensive Planning Framework).GroundwaterGroundwater in the ROI is found in three major aquifers, the PembinaDelta Aquifer, Dakota Aquifer, <strong>and</strong> Icel<strong>and</strong>ic Aquifer. The Pembina DeltaAquifer is approximately 3 kilometers (2 miles) north of Cavalier AFS <strong>and</strong>covers an area of 184 square kilometers (71 square miles). The PembinaDelta Aquifer is a glacial deposit consisting of clay, silt, s<strong>and</strong>, <strong>and</strong> gravel<strong>and</strong> is approximately 30 meters (100 feet) thick.The Dakota Aquifer underlies Cavalier AFS. Groundwater in the CavalierAFS area is found less than 3 meters (10 feet) below ground surface.Recharge for the Dakota Aquifer occurs through precipitation, infiltration,snowmelt, <strong>and</strong> prairie potholes (seasonal water bodies). The Dakotaaquifer is an artesian aquifer <strong>and</strong> has a pump rate ranging from 4 liters (1gallon) per minute to 378 liters (100 gallons) per minute.Cavalier AFS receives its water from the North Valley Water Association,which taps the glacial drift Icel<strong>and</strong>ic Aquifer 9.6 kilometers (6 miles) westof Cavalier AFS. North Valley is under contract to provide 1.09 millionliters (0.29 million gallons) per day to Cavalier AFS. The Icel<strong>and</strong>icAquifer, which serves the region around the city of Cavalier, has notshown any noticeable yield declines (Patch, 1998—Personalcommunication). The water usage for Cavalier AFS is approximately0.45 million liters (0.12 million gallons) per day, of which 0.4 millionliters (0.1 million gallons) per day is used for the existing radar coolingtower.Water QualityGroundwater <strong>and</strong> surface water vary in quality depending upon thegeology, topography, <strong>and</strong> quantity of flow. Surface water quality isjudged by rate of flow. Low flow rates usually result in higher dissolvedmineral concentrations because of the longer exposure time to leachableminerals. Most streams in the area have a dissolved solids concentrationof less than 500 milligrams per liter at high flow rate, which is marginallyacceptable for irrigation uses. (North Dakota Geological Survey, 1973—Mineral <strong>and</strong> Water Resources of North Dakota)NMD Deployment Final EIS 3-409
Chapter 3—Affected EnvironmentGroundwater in the Pembina Delta Aquifer is considered very hard, with ahigh dissolved calcium <strong>and</strong> magnesium content. Iron in the groundwateroften exceeds drinking water st<strong>and</strong>ards. The Pembina Delta Aquifer isutilized in the Cavalier AFS region for livestock, irrigation, <strong>and</strong> somedomestic use. The groundwater from the Dakota <strong>and</strong> Icel<strong>and</strong>ic aquifersis utilized for industrial, domestic, <strong>and</strong> rural resident purposes. The wateris very hard with a calcium magnesium bicarbonate (North DakotaGeological Survey, 1973—Mineral <strong>and</strong> Water Resources of NorthDakota).3.14.2.2 Gr<strong>and</strong> Forks AFB—Water ResourcesThe water resources ROI includes all surface water features, drainageareas, <strong>and</strong> underlying aquifers that could be affected by construction oroperations. This area includes Gr<strong>and</strong> Forks AFB <strong>and</strong> an area withinapproximately 3 kilometers (2 miles) of the base boundary (figure3.14-7).Surface WaterThe Gr<strong>and</strong> Forks AFB ROI is in the Turtle River watershed, USGSCataloging Unit 09020307 (U.S. EPA, 1998—Surf Your Watershed).The Turtle River <strong>and</strong> Kelly’s Slough are the major bodies of movingsurface water in the Gr<strong>and</strong> Forks AFB area. Kelly’s Slough, locatedapproximately 3 kilometers (2 miles) east of Gr<strong>and</strong> Forks AFB, flows in anorth–northeast direction in a marshy floodplain with a poorly definedstream channel. Kelly’s Slough empties into the Turtle River to the eastof the Gr<strong>and</strong> Forks AFB. The Turtle River intersects Gr<strong>and</strong> Forks AFB atthe northwest corner <strong>and</strong> flows in a generally northeast direction to theRed River. There are no lakes or ponds in the Gr<strong>and</strong> Forks AFB area(U.S. Department of the Air Force, 1997—Integrated Natural ResourcesManagement Plan). Water for domestic <strong>and</strong> industrial use from the cityof Gr<strong>and</strong> Forks (75 percent of Gr<strong>and</strong> Forks AFB total) is obtained fromthe Red River <strong>and</strong> the Red Lake River (U.S. Department of the Air Force,1999—Final EIS, Minuteman III <strong>Missile</strong> System Dismantlement).Prairie potholes tend to be seasonal water bodies closely associated withwetl<strong>and</strong>s (See biological resources). Numerous prairie potholes existthroughout northeastern North Dakota, including several small prairiepotholes that exist on Gr<strong>and</strong> Forks AFB. Prairie potholes consist ofsurface water that generally is not large enough or deep enough tomaintain fish populations. Prairie potholes are typically filled following thespring snowmelt, although many potholes are situated within a surficialaquifer <strong>and</strong> retain water throughout the year. Prairie potholes are primewaterfowl production areas, <strong>and</strong> also provide habitat for waterfowl <strong>and</strong>other species during migratory seasons (U.S. Department of the Air Force,1999—Final EIS, Minuteman III <strong>Missile</strong> System Dismantlement).3-410 NMD Deployment Final EIS
Index MapGr<strong>and</strong> Forks AFBNorth Dakota1Turtle River243EXPLANATIONInstallation BoundaryDrainageRoadsStormwater Outfall1234Northwest DitchWest DitchSouth DitchNorth DitchWater Resources,Gr<strong>and</strong> Forks AirForce BaseNORTHwr_gfafb_001Scale 1:70,0000 .6 1.1 miles0 .9 1.8 kilometersNMD Deployment Final EISNorth DakotaFigure 3.14-73-411
Chapter 3—Affected EnvironmentStorm water runoff leaves the Gr<strong>and</strong> Forks AFB from four identifiabledrainage locations. Runoff flows to specific drainageways in the north(north ditch), northwest (northwest ditch), west (west ditch) <strong>and</strong> south(south ditch) at Gr<strong>and</strong> Forks AFB. The northwest ditch collects runofffrom the northern part of the base. The west ditch collects runoff fromthe west side of the base, to include the west runways. The south ditchcollects runoff from the southern part of the base, to include the vehiclemaintenance <strong>and</strong> fuel storage areas. The north ditch collects runoff fromthe northern part of the base, to include the hanger <strong>and</strong> aircraftmaintenance areas. The northwest <strong>and</strong> west ditches drain into the TurtleRiver. The east <strong>and</strong> south ditches drain to Kelly’s Slough. All drainageultimately flows to the Red River. The base storm water runoff plan wasapproved by the North Dakota Department of Health <strong>and</strong> listed in theGr<strong>and</strong> Forks AFB storm water runoff permit. Under the base NPDESpermit, storm water exiting west to Turtle Creek <strong>and</strong> east to Kelly'sSlough are monitored twice annually. The base permit does not containspecific contaminant limits for discharges. Discharge points that serviceareas with higher risk of oil or fuel product spill flow through oil/waterseparators. (U.S. Department of the Air Force, 1997—Integrated NaturalResources Management Plan)The 100-year floodplain on Gr<strong>and</strong> Forks AFB is limited to an area of 76meters (250 feet) on either side of Turtle Creek in the northwest cornerof the base (about 19 hectares [46 acres]) (U.S. Department of the AirForce, 1997—Integrated Natural Resources Management Plan).GroundwaterWater for domestic <strong>and</strong> industrial use from the Gr<strong>and</strong> Forks–Traill WaterUsers, Inc. (25 percent of the Gr<strong>and</strong> Forks AFB total) is obtained from 13wells. Groundwater in the Gr<strong>and</strong> Forks AFB ROI is found in the bedrockaquifers <strong>and</strong> the glacial drift aquifers. The Dakota Aquifer is the majorbedrock aquifer. Limited quantities of water are also found in PierreShale. (U.S. Department of the Air Force, 1999—Final EIS, MinutemanIII <strong>Missile</strong> System Dismantlement)The Dakota Aquifer is in the Dakota Shale <strong>and</strong> S<strong>and</strong>stone <strong>and</strong> iscomposed of quartzose, s<strong>and</strong>stone, <strong>and</strong> shale. Recharge of the DakotaAquifer is to the west of the ROI (U.S. Department of the Air Force,1999—Final EIS, Minuteman III <strong>Missile</strong> System Dismantlement). Theprimary use for water from the Dakota Aquifer is livestock watering.Many wells in this aquifer have experienced reduced flows due toregional decline caused by long-term groundwater withdrawals. Thesewithdrawals have resulted in a 6-meter (20-foot) drop in the aquifer overthe past several years. (U.S. Department of the Air Force, 1997—Integrated Natural Resources Management Plan)3-412 NMD Deployment Final EIS
Chapter 3—Affected EnvironmentThe Pierre Aquifer consists of shale, marlstone, <strong>and</strong> claystone, <strong>and</strong> isfound throughout much of the deployment area. Recharge occursthroughout much of the deployment area from precipitation, snowmelt,<strong>and</strong> prairie potholes. This aquifer is used by some farms <strong>and</strong>municipalities, but is not a major groundwater source in the region (U.S.Department of the Air Force, 1999—Final EIS, Minuteman III <strong>Missile</strong>System Dismantlement).Water QualityGroundwater <strong>and</strong> surface water vary in quality depending upon thegeology, topography, water usage, <strong>and</strong> quantity of flow. Calciummagnesium bicarbonate is the prevalent dissolved constituent of concernin the ROI. High concentrations of sodium <strong>and</strong> magnesium are also foundin the local area aquifers. Surface water quality is judged by rate of flow.Low flow rates usually result in higher dissolved mineral concentrationsbecause of the longer exposure time to leachable minerals. Most streamsin the area have a dissolved solids concentration of less than 500milligrams per liter at high flow rates. These levels are consideredacceptable for domestic use. Surface water salinity concentrations aretypically too high during periods of low flow to be considered acceptablefor possible potable domestic use (North Dakota Geological Survey,1973—Mineral <strong>and</strong> Water Resources of North Dakota; U.S. Department ofthe Air Force, 1997—Integrated Natural Resources Management Plan).According to the National Water Quality Report, North Dakota reports that78 percent of its surveyed river <strong>and</strong> streams have good water quality.The major sources of contaminated waters are agriculture, the removal ofstream side vegetation, which increases siltation, <strong>and</strong> municipal sewagetreatment plants. Natural conditions, such as low flows, also contribute toviolations of st<strong>and</strong>ards. Good water quality is found in 95 percent of thelakes surveyed. The leading sources of pollution in lakes are agriculturalactivities, municipal sewage treatment, <strong>and</strong> urban runoff/storm sewers.The Turtle River near Gr<strong>and</strong> Forks AFB has a Class II stream designationfrom the North Dakota Department of Health, which means that it maybe intermittent, but when flowing, it meets the chemical, physical, <strong>and</strong>bacteriologic requirements for municipal use. The designation alsoindicates that the river’s water is of sufficient quality to use for irrigation,propagation of resident fish species, swimming, <strong>and</strong> other water-basedrecreation (U.S. Department of the Air Force, 1997—Integrated NaturalResources Management Plan).3.14.2.3 <strong>Missile</strong> Site Radar—Water ResourcesThis section describes the water resources <strong>and</strong> water quality of the <strong>Missile</strong>Site Radar complex. The water resources ROI includes all waterways,potential drainage areas, still waters, <strong>and</strong> shallow <strong>and</strong> deep aquifers thatcould be affected by construction or operations (figure 3.14-8).NMD Deployment Final EIS 3-413
Index MapMSR(9020313)North Dakota(9020310)Roaring Nancy Creek(9020201)EXPLANATIONWater Area (Intermittent)DrainageRoadsWatershed Boundary (EPA Watershed ID Number)Water Resources,<strong>Missile</strong> Site RadarNORTHwr_msr_0013-414Scale 1:40,0000 1,667 3,333 feet0 508 1,016 metersNMD Deployment Final EISNorth DakotaFigure 3.14-8
Chapter 3—Affected EnvironmentSurface WaterThe <strong>Missile</strong> Site Radar complex ROI is in the Devils Lake, Pembina, <strong>and</strong>Park watersheds, USGS Cataloging Units 09020201, 09020313, <strong>and</strong>09020310 (U.S. EPA, 1998—Surf Your Watershed). There are nosignificant rivers or bodies of surface water in the ROI. The ROI isaffected by the soils' ability to hold water (soils are clay <strong>and</strong> silt, lowpermeability). The <strong>Missile</strong> Site Radar is not within a 100-year floodplain(Greenwood, 1998—Electronic communication, June 5.)Due to the slow infiltration rate, heavy rains often result in surface waterbeing retained in depressions. The only natural surface water body onthe site is a small intermittent stream, Roaring Nancy Creek, that crossesthe western side of the site. This creek has been classified as a wetl<strong>and</strong>by the Corps of Engineers. Storm water at the site flows through twodrainage swales into the creek, <strong>and</strong> is carried northwest to a pondapproximately 8 kilometers (5 miles) away (U.S. Army Center for HealthPromotion <strong>and</strong> Preventive Medicine, 1995—Final Report, Site Inspection,SRMSC). Additionally, water from the site's sewage lagoons areperiodically lowered by discharging to Roaring Nancy Creek when thelagoons fill from heavy rains. This discharge is regulated under anNPDES permit issued by the state of North Dakota. The permit requiresperiodic monitoring of surface water runoff.GroundwaterGroundwater in the <strong>Missile</strong> Site Radar area is found in the Pierre Aquifer,which consists of fractured light to dark gray shale. Groundwater in theaquifer ranges in depth from 5 to 8 meters (15 to 25 feet) with pumprates ranging from 20 to 1,130 liters (5 to 300 gallons) per minute.Recharge for the Pierre Aquifer occurs through precipitation, snowmelt,<strong>and</strong> infiltration from prairie potholes (seasonal water bodies). The PierreAquifer is not a major groundwater source in the region.The <strong>Missile</strong> Site Radar did receive its potable water from the municipalFordville Well Field, in the south-central part of Walsh County. However,in 1996 the <strong>Missile</strong> Site Radar was connected to the town of Langdon’swater supply, a surface water source northeast of Langdon (U.S. ArmyCenter for Health Promotion <strong>and</strong> Preventive Medicine, 1995—FinalReport, Site Inspection, SRMSC). The <strong>Missile</strong> Site Radar is stillconnected to the Fordville Well Field <strong>and</strong> occasionally uses the water fornon-potable uses. Pump rates for the Fordville Well Field are up to 1,136liters (300 gallons) per minute. Cavalier AFS, east of the <strong>Missile</strong> SiteRadar, withdrew approximately 185,022 cubic meters (150-acre feet) peryear before changing water supplies. In addition, other users in theregion are withdrawing another 740,089 cubic meters (600-acre feet)from the Fordville Aquifer. No noticeable yield decline trends or changesNMD Deployment Final EIS 3-415
Chapter 3—Affected Environmentin the aquifer have been noted from past use (Patch, 1998—Personalcommunication).Water QualityGroundwater <strong>and</strong> surface water vary in quality depending upon thegeology, topography, water usage, <strong>and</strong> quantity of flow. Groundwater inthe <strong>Missile</strong> Site Radar area has a high salinity content. Water in the PierreAquifer is considered toxic to plants because of the high sodium content.Sodium-bicarbonate-sulfate is the prevalent dissolved constituent ofconcern in the ROI. This groundwater is used for industrial <strong>and</strong> livestockpurposes <strong>and</strong> often exceeds the drinking water st<strong>and</strong>ard for iron, chloride,<strong>and</strong> sulfate. Surface water low flow rates usually result in higherdissolved mineral concentrations because of the longer exposure time toleachable minerals. Most surface water in the area has a dissolved solidsconcentration of less than 500 milligrams per liter at high flow rate, whichis marginally acceptable for irrigational uses (North Dakota GeologicalSurvey, 1973—Mineral <strong>and</strong> Water Resources of North Dakota).3.14.2.4 Remote Sprint Launch Site 1—Water ResourcesThe water resources ROI includes all surface water features, drainageareas, <strong>and</strong> underlying aquifers that could be affected by construction oroperations. This area includes an area within approximately 2 kilometers(1 mile) of Remote Sprint Launch Site 1 (figure 3.14-9).Surface WaterThe Remote Sprint Launch Site 1 ROI is in the Devils Lake watershed,USGS Cataloging Unit 09020201 (U.S. EPA, 1998—Surf YourWatershed). There are no major bodies of surface water in the RemoteSprint Launch Site 1 area. Storm water runoff from the Remote SprintLaunch Site 1 <strong>and</strong> area drains into local surface depressions. The runofffollows no specific drainage pattern. Remote Sprint Launch Site 1 is notsituated in a floodplain region. The site is currently inactive <strong>and</strong> does nothave a storm water permit.GroundwaterThe groundwater at this site is similar to that described for the <strong>Missile</strong>Site Radar. There are no groundwater wells at Remote Sprint LaunchSite 1.3-416 NMD Deployment Final EIS
Index MapRSL-1North DakotaEXPLANATIONWater Area (Intermittent)RoadsWater Resources,Remote Sprint LaunchSite 1NORTHwr_rsl1_001Scale 1:40,0000 1,667 3,333 feet0 508 1,016 metersNMD Deployment Final EISNorth DakotaFigure 3.14-93-417
Chapter 3—Affected Environment3.14.2.5 Remote Sprint Launch Site 2—Water ResourcesThe water resources ROI includes all surface water features, drainageareas, <strong>and</strong> underlying aquifers that could be affected by construction oroperations. This area includes an area within approximately 2 kilometers(1 mile) of Remote Sprint Launch Site 2 (figure 3.14-10).Surface WaterThe Remote Sprint Launch Site 2 ROI is in the Pembina River watershed,USGS Cataloging Unit 09020313 (U.S. EPA, 1998—Surf YourWatershed). Storm water runoff drains in two directions from RemoteSprint Launch Site 2. The northwest portion of the site drains to localsurface depressions. The southwest portion drains to the southeast ofthe Remote Sprint Launch Site 2 area. Surface water runs into the LittleSouth Pembina River approximately 1 kilometer (0.5 mile) to the south ofthe Remote Sprint Launch Site 2 area. The site is currently inactive <strong>and</strong>does not have a storm water permit.GroundwaterThe groundwater at this site is similar to that described for the <strong>Missile</strong>Site Radar. There are no groundwater wells at Remote Sprint LaunchSite 2.Water QualityThe surface <strong>and</strong> groundwater quality at this site is similar to thatdescribed for the <strong>Missile</strong> Site Radar.3.14.2.6 Remote Sprint Launch Site 4—Water ResourcesThe water resources ROI includes all surface water features, drainageareas, <strong>and</strong> underlying aquifers that could be affected by construction oroperations. This area includes an area within approximately 2 kilometers(1 mile) of Remote Sprint Launch Site 4 (figure 3.14-11).Surface WaterThe Remote Sprint Launch Site 4 ROI is in the Devils Lake <strong>and</strong> forestwatersheds, USGS Cataloging Units 09020201 <strong>and</strong> 09020308 (U.S.EPA, 1998—Surf Your Watershed).Storm water runoff from Remote Sprint Launch Site 4 drains intointermittent tributaries of the Edmore Coulee. The Edmore Coulee flowsinto Sweetwater Lake. Remote Sprint Launch Site 4 is not situated in afloodplain region (North Dakota Parks <strong>and</strong> Recreation, 1987—NorthDakota Rivers Study). The site is currently inactive <strong>and</strong> does not have astorm water permit.3-418 NMD Deployment Final EIS
Index MapRSL-2North DakotaSouth Pembina RiverLittleEXPLANATIONWater Area (Intermittent)DrainageRoadsWater Resources,Remote Sprint LaunchSite 2NORTHwr_rsl2_001Scale 1:40,0000 1,667 3,333 feet0 508 1,016 metersNMD Deployment Final EISNorth DakotaFigure 3.14-103-419
Index MapRSL-4(9020310)North Dakota(9020201)(9020308)EXPLANATIONWater Area (Intermittent)DrainageRoadsWatershed Boundary (EPA Watershed ID Number)Water Resources,Remote Sprint LaunchSite 4NORTHwr_rsl4_0013-420Scale 1:40,0000 1,667 3,333 feet0 508 1,016 metersNMD Deployment Final EISNorth DakotaFigure 3.14-11
Chapter 3—Affected EnvironmentGroundwaterThe groundwater at this site is similar to that described for the <strong>Missile</strong>Site Radar. There are no groundwater wells at Remote Sprint LaunchSite 4.Water QualityThe surface <strong>and</strong> groundwater quality at this site is similar to thatdescribed for the <strong>Missile</strong> Site Radar.3.14.2.7 North Dakota—Fiber Optic Cable Line—Water ResourcesThis section describes the water resources <strong>and</strong> water quality for the fiberoptic cable line ROI. The ROI for water resources includes the waterways,potential drainage areas, still waters, <strong>and</strong> shallow <strong>and</strong> deep aquifers thatcould be affected by construction. The potential fiber optic cable linewould be installed to connect the selected NMD sites in North Dakota.Surface WaterIt is anticipated that the fiber optic cable line would follow along existingutility <strong>and</strong> road corridors. Surface water along the route would bedependent on the specific route <strong>and</strong> terrain where the cable is installed.Surface water along the roadways <strong>and</strong> utility corridors could consist ofboth seasonal <strong>and</strong> year round streams, ponds, wetl<strong>and</strong>s, <strong>and</strong> floodplains,although the cable would most likely be in proximity to the roadway <strong>and</strong>not within water areas. Stream flow rates <strong>and</strong> flooding for this regionare highest during snowmelt <strong>and</strong> early summer conditions, coincidingwith precipitation patterns.GroundwaterThe regional groundwater in the fiber optic cable line ROI is similar to thatdescribed above for the potential NMD North Dakota deployment sites.Water QualityGroundwater <strong>and</strong> surface water quality in the ROI would be similar tothat described above for the potential NMD North Dakota deploymentsites. In general, groundwater in North Dakota is hard <strong>and</strong> has chemicalconstituents that minimize potential use.According to the National Water Quality Report, North Dakota reportsthat 78 percent of its surveyed river <strong>and</strong> streams have good waterquality. The major sources of contaminated waters are agriculture, theremoval of streamside vegetation, which increases siltation, <strong>and</strong>municipal sewage treatment plants. Natural conditions, such as lowflows, also contribute to violations of st<strong>and</strong>ards. Good water quality isNMD Deployment Final EIS 3-421
Chapter 3—Affected Environmentfound in 95 percent of the lakes surveyed. The leading sources ofpollution in lakes are agricultural activities, municipal sewage treatment,<strong>and</strong> urban runoff/storm sewers.Most of the rivers in North Dakota have average dissolved solids of lessthan 500 milligrams per liter during medium to high flows, with watersuitable for domestic use. During low flow periods, the rivers aregenerally too saline for domestic use.3-422 NMD Deployment Final EIS
Chapter 3—Affected Environment3.15 ENVIRONMENTAL JUSTICEExecutive Order 12898, Federal Actions to Address EnvironmentalJustice in Minority Populations <strong>and</strong> Low-Income Populations, was issuedby the President on February 11, 1994. Objectives of the ExecutiveOrder as it pertains to this EIS include development of Federal agencyimplementation strategies, identification of minority <strong>and</strong> low-incomepopulations where proposed Federal actions have disproportionately high<strong>and</strong> adverse human health <strong>and</strong> environmental effects, <strong>and</strong> participation ofminority <strong>and</strong> low-income populations. Accompanying Executive Order12898 was a Presidential Transmittal Memor<strong>and</strong>um, which referencedexisting Federal statutes <strong>and</strong> regulations to be used in conjunction withExecutive Order 12898. The memor<strong>and</strong>um addressed the use of thepolicies <strong>and</strong> procedures of NEPA. Specifically, the memor<strong>and</strong>umindicates that, "Each Federal agency shall analyze the environmentaleffects, including human health, economic <strong>and</strong> social effects, of Federalactions, including effects on minority communities <strong>and</strong> low-incomecommunities, when such analysis is required by the NEPA 42 U.S.C.section 4321 et. seq." Although an environmental justice analysis is notm<strong>and</strong>ated by NEPA, DOD has directed that NEPA will be used as theprimary approach to implement the provision of the Executive Order.Although Executive Order 12898 provides no guidelines as to how todetermine concentrations of minority or low-income populations, thedemographic analysis provides information on the approximate locationsof minority <strong>and</strong> low-income populations potentially affected by the NMDprogram.The 1990 Census of Population <strong>and</strong> Housing reports numbers of bothminority <strong>and</strong> poverty residents. Minority populations included in thecensus are identified as Black; American Indian, Eskimo or Aleut; Asian orPacific Isl<strong>and</strong>er; Hispanic; or other. Poverty status (used in this EIS todefine low-income status) is reported as the number of families withincome below poverty level ($12,764 for a family of four in 1989, asreported in the 1990 Census of Population <strong>and</strong> Housing).3.15.1 ALASKA INSTALLATIONSMost of the environmental effects from the Proposed Action would beexpected to occur at one or more of the five installations that are beingconsidered depending on the site(s) selected. Therefore, the ROI forenvironmental justice is the Census Area where each of the installationsis located. Alaska’s Census Areas are not broken down into tracts;however, there are cities <strong>and</strong> Census Designated Places (CDPs)breakdowns that help provide a better underst<strong>and</strong>ing of what is occurringin these census areas. The CDPs <strong>and</strong> cities that were in close proximityto the installations were investigated. The potential sites are located infour different census areas, as shown in figure 3.15-1.NMD Deployment Final EIS 3-423
Index MapAlaskaYukon-KoyukukCensus AreaFairbanks NorthStar BoroughFoxTwoRiversPleasantValleyNenanaFairbanksNorthPoleEielsonAFBSalchaMooseCreekYukon TrainingAreaHardingLakeSoutheast FairbanksCensus AreaAndersonClear AFSDeltaJunctionBigDeltaFerryDenali Borough*FortGreelyLigniteHealyEXPLANATIONNORTHej_cdp_0013-424CityCensus Designated Place (CDP)CDP BoundaryInstallation BoundaryBorough BoundaryScale0 12 24 Miles0 19 38 Kilometers* Note in 1990 Denali Borough waspart of Yukon-Koyukuk Census AreaNMD Deployment Final EISCensus Areas Withinthe Installation'sRegion of InfluenceAlaskaFigure 3.15-1
Chapter 3—Affected EnvironmentThe Census Areas, as well as the CDPs <strong>and</strong> cities that are in closeproximity to the potential sites, are shown in table 3.15-1. This tableshows total population, percent minority, percent low-income, <strong>and</strong> whatinstallation is located in that Census Area.Table 3.15-1: Minority <strong>and</strong> Low Income Populations for Potential Sites in AlaskaPopulation1990PercentMinorityPercent LowIncomeUnited States 248,709,873 24.24 13.12Installation ROIAlaska 550,043 26.03 9.00Aleutians West Census9,478 35.63 8.95 Eareckson ASAreaFairbanks North StarBorough77,720 19.63 7.58 Eielson AFB, YukonTraining Area (FortWainwright)Eielson CDP 5,251 21.22 2.87Fairbanks City 30,843 29.79 10.39Fox CDP 259 5.02 9.27Harding Lake CDP 25 0.00 0.00Moose Creek CDP 626 20.29 9.42North Pole City 1,456 16.14 5.09Pleasant Valley CDP 277 0.00 0.00Salcha CDP 303 9.90 8.08Two Rivers CDP 483 13.25 0.00Southeast Fairbanks5,913 22.07 14.19 Fort GreelyCensus AreaBig Delta CDP 400 6.75 23.21Delta Junction City 651 9.37 8.45Fort Greely CDP 1,147 31.04 6.36Yukon-Koyukuk Census8,478 58.47 26.05 Clear AFSAreaAnderson City 644 15.68 <strong>3.7</strong>1Ferry CDP 58 17.24 15.52Healy CDP 494 5.06 3.85Lignite CDP 102 0.00 1.96Nenana City 377 46.95 10.40Source: U.S. Department of Commerce, 1998—The Official Statistics.CDP = Census Designated PlaceNMD Deployment Final EIS 3-425
Chapter 3—Affected Environment3.15.1.1 Clear AFS—Environmental JusticeMost environmental impacts resulting from the No-action Alternative <strong>and</strong>Proposed Action at the Clear AFS site are anticipated to occur in theDenali Borough (formerly the Yukon–Koyukuk Census Area), which is theROI for the environmental justice analysis. This borough during the 1990Census was the Yukon–Koyukuk Census Area. Since then it has beendivided, <strong>and</strong> Clear AFS now falls into the Denali Borough. This study willrefer to data from the 1990 Census <strong>and</strong> will refer to the ROI as theYukon–Koyukuk Census Area. Based upon the 1990 Census ofPopulation <strong>and</strong> Housing, the Yukon–Koyukuk Census Area had apopulation of 8,478. Of that total, 2,208 persons, or 26.05 percent,were low-income, <strong>and</strong> 4,957 persons, or 58.47 percent, were minority.However, this borough covers a broad area. In close proximity to ClearAFS there are several small communities <strong>and</strong> cities that more accuratelyreflect the populations of the area around Clear AFS. These are shown intable 3.15-1.3.15.1.2 Eareckson AS—Environmental JusticeMost environmental impacts resulting from the No-action Alternative <strong>and</strong>Proposed Action at the Eareckson AS site are anticipated to occur in theAleutians West Census Area, which is the ROI for the environmentaljustice analysis. Based upon the 1990 Census of Population <strong>and</strong>Housing, the Aleutians West Census Area had a population of 9,478. Ofthat total, 848 persons, or 8.95 percent, were low-income; 3,377persons, or 35.63 percent, were minority. This is shown in table 3.15-1.3.15.1.3 Eielson AFB—Environmental JusticeMost environmental impacts resulting from the No-action Alternative <strong>and</strong>Proposed Action at Eielson AFB are anticipated to occur in the FairbanksNorth Star Borough, which is the ROI for the environmental justiceanalysis. Based upon the 1990 Census of Population <strong>and</strong> Housing, theFairbanks North Star Borough had a population of 77,720. Of that total,5,891 persons, or 7.58 percent, were low-income, <strong>and</strong> 15,256 persons,or 19.63 percent, were minority. However, this borough covers a broadarea. In close proximity to Eielson AFB there are several smallcommunities <strong>and</strong> cities that more accurately reflect the populations of thearea around the base. These are shown in table 3.15-1.3.15.1.4 Fort Greely—Environmental JusticeMost environmental impacts resulting from the No-action Alternative <strong>and</strong>Proposed Action at the Fort Greely site are anticipated to occur inSoutheast Fairbanks Census Area, which is the ROI for the environmentaljustice analysis. Based upon the 1990 Census of Population <strong>and</strong>Housing, Southeast Fairbanks Census Area had a population of 5,913.3-426 NMD Deployment Final EIS
Chapter 3—Affected EnvironmentOf that total, 839 persons, or 14.19 percent, were low-income, <strong>and</strong>1,305 persons, or 22.07 percent, were minority. However, this boroughcovers a broad area. In close proximity to Fort Greely there are severalsmall communities <strong>and</strong> cities that more accurately reflect the populationsof the area around Fort Greely. These are shown in table 3.15-1.3.15.1.5 Yukon Training Area (Fort Wainwright)—Environmental JusticeThe environmental justice ROI for the Yukon Training Area is similar tothat described for Eielson AFB.3.15.2 NORTH DAKOTA INSTALLATIONSMost of the environmental effects from the Proposed Action would beexpected to occur at one or more of the six installations that are beingconsidered depending on the site(s) selected. The ROI for environmentaljustice is the county where each of the installations is located.The information for these counties is shown in table 3.15-2. It includestotal population, percent minority, percent low-income, <strong>and</strong> whatinstallation is located in that county.Table 3.15-2: Minority <strong>and</strong> Low Income Populations for Potential Sites in North DakotaPopulation1990PercentMinorityPercent LowIncomeUnited States 248,709,873 24.24 13.12Installation ROINorth Dakota 638,800 5.69 14.38Cavalier County 6,064 0.76 14.07 <strong>Missile</strong> Site Radar, Remote Sprint Launch-2,Remote Sprint Launch-1, Cavalier AFS, RemoteSprint Launch-4Gr<strong>and</strong> Forks County 70,683 6.39 12.32 Gr<strong>and</strong> Forks AFBPembina County 9,238 2.99 9.22 Cavalier AFSRamsey County 12,681 4.84 13.23 Remote Sprint Launch-1, Remote Sprint Launch-4, <strong>Missile</strong> Site RadarWalsh County 13,840 <strong>3.7</strong>3 13.38 Remote Sprint Launch-4, <strong>Missile</strong> Site RadarSource: U.S. Department of Commerce, 1998—The Official Statistics.3.15.2.1 Cavalier AFS—Environmental JusticeMost environmental impacts resulting from the No-action Alternative <strong>and</strong>Proposed Action at the Cavalier AFS site are anticipated to occur inPembina <strong>and</strong> Cavalier counties, which is the ROI for the environmentaljustice analysis. Based upon the 1990 Census of Population <strong>and</strong>Housing, Pembina County had a population of 9,238. Of that total, 860persons, or 9.22 percent, were low-income, <strong>and</strong> 276 persons, or 2.99percent, were minority. Cavalier County had a population of 6,064, ofNMD Deployment Final EIS 3-427
Chapter 3—Affected Environmentwhich 853 persons, or 14.07 percent, were low-income, <strong>and</strong> 46 persons,or 0.76 percent, were minority.3.15.2.2 Gr<strong>and</strong> Forks AFB—Environmental JusticeMost environmental impacts from the No-action Alternative <strong>and</strong> ProposedAction would be expected to occur within Gr<strong>and</strong> Forks County. Gr<strong>and</strong>Forks County would be the ROI for the environmental justice analysis.Based upon the 1990 Census of Population <strong>and</strong> Housing, Gr<strong>and</strong> ForksCounty had a population of 70,638. Of that total, 8,708 persons, or12.32 percent, were low-income, <strong>and</strong> 4,517 persons, or 6.39 percent,were minority.3.15.2.3 <strong>Missile</strong> Site Radar—Environmental JusticeMost environmental impacts resulting from the No-action Alternative <strong>and</strong>Proposed Action at the <strong>Missile</strong> Site Radar are anticipated to occur inCavalier, Ramsey, <strong>and</strong> Walsh counties, which is the ROI for theenvironmental justice analysis. Based upon the 1990 Census ofPopulation <strong>and</strong> Housing, Cavalier County had a population of 6,064. Ofthat total, 853 persons, or 14.07 percent, were low-income, <strong>and</strong> 46persons, or 0.76 percent, were minority. Ramsey County had apopulation of 12,681, of which 1,678 persons, or 13.23 percent, werelow-income, <strong>and</strong> 614 persons, or 4.84 percent, were minority. WalshCounty had a population of 13,840, of which 1,852 persons, or 13.38percent, were low-income, <strong>and</strong> 516 persons, or <strong>3.7</strong>3 percent, wereminority.3.15.2.4 Remote Sprint Launch Site 1—Environmental JusticeMost environmental impacts resulting from the No-action Alternative <strong>and</strong>Proposed Action at Remote Sprint Launch Site 1 are anticipated to occurin Cavalier <strong>and</strong> Ramsey counties, which is the ROI for the environmentaljustice analysis. Based upon the 1990 Census of Population <strong>and</strong>Housing, Cavalier County had a population of 6,064. Of that total, 853persons, or 14.07 percent, were low-income, <strong>and</strong> 46 persons, or 0.76percent, were minority. Ramsey County had a population of 12,681, ofwhich 1,678 persons, or 13.23 percent, were low-income, <strong>and</strong> 614persons, or 4.84 percent, were minority.3.15.2.5 Remote Sprint Launch Site 2—Environmental JusticeMost environmental impacts resulting from the No-action Alternative <strong>and</strong>Proposed Action at the Remote Sprint Launch Site 2 are anticipated tooccur in Cavalier County, which is the ROI for the environmental justiceanalysis. Based upon the 1990 Census of Population <strong>and</strong> Housing,Cavalier County had a population of 6,064. Of that total, 853 persons,or 14.07 percent, were low-income, <strong>and</strong> 46 persons, or 0.76 percent,were minority.3-428 NMD Deployment Final EIS
Chapter 3—Affected Environment3.15.2.6 Remote Sprint Launch Site 4—Environmental JusticeMost environmental impacts resulting from the No-action Alternative <strong>and</strong>Proposed Action at the Remote Sprint Launch Site 4 are anticipated tooccur in Cavalier, Ramsey, <strong>and</strong> Walsh counties, which is the ROI for theenvironmental justice analysis. Based upon the 1990 Census ofPopulation <strong>and</strong> Housing, Cavalier County had a population of 6,064. Ofthat total, 853 persons, or 14.07 percent, were low-income, <strong>and</strong> 46persons, or 0.76 percent, were minority. Ramsey County had apopulation of 12,681, of which 1,678 persons, or 13.23 percent, werelow-income, <strong>and</strong> 614 persons, or 4.84 percent, were minority. WalshCounty had a population of 13,840, of which 1,852 persons, or 13.38percent, were low-income, <strong>and</strong> 516 persons, or <strong>3.7</strong>3 percent, wereminority.NMD Deployment Final EIS 3-429
Chapter 3—Affected Environment3.16 SUBSISTENCEMany families living in rural areas of Alaska are partially or whollydependent upon the harvesting of natural resources for food <strong>and</strong> otherliving necessities. In order to ensure the existence of these resources,the ANILCA was passed by Congress in 1980. It provides continuedopportunity for customary <strong>and</strong> traditional uses of fish <strong>and</strong> wildliferesources for subsistence purposes. In accordance with ANILCA, theFederal Government manages these subsistence resources on FederalPublic L<strong>and</strong>s (U.S. Department of the Air Force, 1995—Final EIS, AlaskaMilitary Operations Area).In anticipation of the passage of the ANILCA, the State of Alaska passeda subsistence law in 1978, which the Secretary of the Interiorsubsequently found to be consistent with the ANILCA. However, in1989, the Supreme Court ruled that the rural preference in state statutewas unconstitutional. Thus, all Alaskan residents may harvestsubsistence resources on state l<strong>and</strong>s as well as on some local <strong>and</strong> privatel<strong>and</strong>s. However, subsistence harvesting on Federal public l<strong>and</strong>s underthe Federal subsistence regulations is only permitted: (1) by residents ofrural communities determined to have customary <strong>and</strong> traditional use ofthe resource, or (2) where no determination has been made, by all ruralAlaska residents (residents of certain non-rural communities arespecifically excluded) (U.S. Department of the Air Force, 1995—FinalEIS, Alaska Military Operations Area).In these rural communities, the harvesting of subsistence resources canbe the primary means of support for a family unit. While food is theprimary use of subsistence resources, there are many other uses forsubsistence products such as clothing, food for work animals, fuel, homecrafts, customary trade, ceremonial tools, as well as arts <strong>and</strong> crafts(Alaska Department of Fish <strong>and</strong> Game, 1999—Subsistence: FrequentlyAsked Questions). In addition to the material importance of subsistencehunting, it also plays a strong role in the social <strong>and</strong> cultural traditions ofmany native Alaskan communities (U.S. Department of the Air Force,1995—Final EIS, Alaska Military Operations Area).The importance of subsistence harvesting varies among individuals <strong>and</strong>communities depending on the local culture <strong>and</strong> customs. In order toevaluate the effects of the Proposed Action, the significant subsistenceuse areas must first be identified, after which the impacts on thoseresources can be identified.Subsistence AreasThe native Athapaskans well into the 1900's historically used the areasthat are currently within the central part of Alaska near Clear AFS, EielsonAFB, Yukon Training Area, <strong>and</strong> Fort Greely for subsistence. These areas3-430 NMD Deployment Final EIS
Chapter 3—Affected Environmentare within the historic ranges of the Salcha, Goodpasor–Wood River, <strong>and</strong>Chena B<strong>and</strong>s of the lower Tanana Athapaskans <strong>and</strong> the Healy River–Joseph b<strong>and</strong> of the Tanacross Athapaskans. In addition, the Southernportions of Fort Greely were likely used intermittently by AhtnaAthapaskans of the Copper River Drainage (U.S. Department of the Army,1999—Alaska Army L<strong>and</strong>s Withdrawal Renewal Final Legislative EIS).The Athapaskans of the interior regions depended upon the seasonalexploitation of mammals <strong>and</strong> fish for subsistence. Settlement patternsreflected subsistence constraints. Small temporary upl<strong>and</strong> camps huntedcaribou. During the summer months, the groups moved to fishing campsalong the Tanana River <strong>and</strong> its major tributaries. While caribou was themost important food source, other large game such as moose <strong>and</strong> dallsheep were harvested as well. Smaller game included hares, marmots,ground squirrels, ptarmigan, ruffed grouse, sharp-tailed grouse, whitefish,<strong>and</strong> three varieties of salmon (U.S. Department of the Army, 1999—Alaska Army L<strong>and</strong>s Withdrawal Renewal Final Legislative EIS).With the settlement of Euroamericans there were dramatic changes in thehunting <strong>and</strong> social practices of the native b<strong>and</strong>s. With the onset oftrapping <strong>and</strong> mining practices, subsistence activities were changeddramatically. The discovery of gold further altered the native way of lifeby drawing populations from traditionally semi-nomadic camps todeveloping towns such as Fairbanks. Although many smaller nativevillages still relied on local subsistence resources, the exploitation of largehunting ranges was no longer necessary. Today, subsistence resourceswithin the ROI are still utilized in Nenana, Healy Lake, Delta Junction, BigDelta, <strong>and</strong> Dot Lake (U.S. Department of the Army, 1999—Alaska ArmyL<strong>and</strong>s Withdrawal Renewal Final Legislative EIS).The Tanana River has continued to be a primary source for subsistencefishing throughout the year, with the highest concentration of harvestingoccurring 32 kilometers (20 miles) downstream from Fairbanks.Commonly harvested fish include chinook, chum, <strong>and</strong> coho salmon;broad, humpback, <strong>and</strong> round whitefish; least cisco; sheefish; burbot;grayling; <strong>and</strong> northern pike.3.16.1 CLEAR AFSClear AFS is located in part of the subsistence range used by the Nenana-Toklat b<strong>and</strong> of the Lower Tanana Athapaskans in the nineteenth <strong>and</strong>twentieth centuries. During the 1930s <strong>and</strong> 1940s, development in thearea led to a decline in the groups’ reliance on subsistence resources.Most of these people were residing in Nenana by the 1940s. Use of thearea for hunting <strong>and</strong> trapping still continues to the present (U.S.Department of the Interior, 1997—Northern Intertie Project Draft EIS).NMD Deployment Final EIS 3-431
Chapter 3—Affected EnvironmentAlthough subsistence hunting <strong>and</strong> fishing occurs in the vicinity of ClearAFS, only Air Force <strong>and</strong> civilian base personnel <strong>and</strong> people they sponsorcan hunt on Clear AFS property, which could include some people thatsubsistence hunt <strong>and</strong> fish. However, this would include a very smallpercentage of the population at Clear AFS. Therefore, there is minimalsubsistence activity occurring on the base.3.16.2 EARECKSON ASUnder ANILCA, Eareckson AS is not considered to be a rural communitybecause it is a restricted military installation. Therefore, it is exemptfrom subsistence considerations. However, this does not limit thesurrounding areas of Shemya Isl<strong>and</strong> from subsistence use.3.16.3 EIELSON AFBEielson AFB is part of the historic subsistence range of two lower Tananab<strong>and</strong>s: the Chena <strong>and</strong> the Salcha. The Chena b<strong>and</strong> utilized the areawithin the Chena River drainage, while the Salcha utilized areas withinthe Salcha River drainage. Development in the region was devastating tothese b<strong>and</strong>s <strong>and</strong> by the 1960s virtually eliminated the historicsubsistence ranges of these groups.Eielson AFB is within the Fairbanks North Star Borough, which is notconsidered a rural area <strong>and</strong>, therefore, residents are not qualified asFederal subsistence users. However, Game Management Unit 20B hasseveral seasons <strong>and</strong> bag limits for Federal subsistence hunters, all ofwhich overlap entirely with current state bag limits <strong>and</strong> seasons.Subsistence users from outside the borough may utilize Eielson AFB forsubsistence use. Such use is infrequent if it occurs. (U.S. Department ofthe Army, 1999—Alaska Army L<strong>and</strong>s Renewal Final Legislative EIS)Approximately 2,200 fishing permits, 1,050 hunting permits, <strong>and</strong> 30trapping permits are issued annually to mostly recreational users. Theseactivities are allowed on-base in accordance with Federal <strong>and</strong> State ofAlaska regulations, seasons, <strong>and</strong> bag limits (Eielson AFB, 1998—Integrated Natural Resources Management Plan). Almost all of thesepermit holders would fail to qualify as subsistence users, <strong>and</strong> almost allhunting, fishing, <strong>and</strong> trapping use is for recreational purposes (U.S.Department of the Army, 1999—Alaska Army L<strong>and</strong>s Withdrawal RenewalFinal Legislative EIS).3.16.4 FORT GREELYThe l<strong>and</strong> on Fort Greely was once the subsistence ranges of two lowerTanana b<strong>and</strong>s in the nineteenth <strong>and</strong> twentieth centuries. The l<strong>and</strong>between the Little Delta River <strong>and</strong> Jarvis Creek is within the historicrange of the Salcha b<strong>and</strong>. However, ethnographic research has indicatedthat by the 1920s the Salcha had ceased to use Delta River <strong>and</strong> Delta3-432 NMD Deployment Final EIS
Chapter 3—Affected EnvironmentCreek drainages for subsistence. By 1962 there were no nativesettlements along the entire Tanana drainage from Healy Lake to Nenana(U.S. Department of the Army, 1999—Alaska Army L<strong>and</strong>s WithdrawalRenewal Final Legislative EIS).The l<strong>and</strong> east of Jarvis Creek is within the historic subsistence range ofthe Healy River–Joseph b<strong>and</strong>. The remaining descendents of this b<strong>and</strong>currently reside 48 kilometers (30 miles) east of Fort Greely near HealyLake. While many members of this community are subsistence hunters,most residents do not travel as far as Fort Greely for subsistenceharvesting (U.S. Department of the Army, 1999—Alaska Army L<strong>and</strong>sWithdrawal Renewal Final Legislative EIS).The community of Dot Lake is about 96 kilometers (60 miles) west–southwest of Delta Junction along Highway 1. Dot Lake consistsprimarily of non-native households but also includes the native village ofDot Lake. The historic subsistence area of the village terminates at least32 kilometers (20 miles) east of Fort Greely. Some residents of Dot Lakemay travel the extra distance to harvest subsistence resources on FortGreely (U.S. Department of the Army, 1999—Alaska Army L<strong>and</strong>sWithdrawal Renewal Final Legislative EIS).Approximately 72 kilometers (45 miles) east-southeast of Delta Junctionon the Alaska Highway is the non-native community of Dry Creek.According to the Alaska Department of Community <strong>and</strong> Regional Affairs,at least 15 adult residents rely on the exploitation of natural resources.A number of Dry Creek residents can be characterized as subsistencehunters/trappers. (U.S. Department of the Army, 1999—Alaska ArmyL<strong>and</strong>s Renewal Final Legislative EIS)Currently, the use of subsistence resources on Fort Greely is minimal.Species harvested in the area around Fort Greely include moose, caribou,brown/grizzly bear, Dall sheep, fish, waterfowl, <strong>and</strong> small game.From 1996 through 1998, an average of 620 permits were issued fornonmilitary range use on Fort Greely, which includes hunting, fishing,<strong>and</strong> trapping. It is estimated that approximately one-half of these permitholders are civilians, mostly residents of Delta Junction <strong>and</strong> Big Delta. Anumber of Big Delta <strong>and</strong> Delta Junction residents can be characterizedas subsistence users, but due to the employment opportunities in <strong>and</strong>around the Fort Greely area, there is little dependency on subsistenceharvesting in these communities. However, as a result of the stockedlakes on Fort Greely, a considerable number of permit holders arerecreational anglers from the Fairbanks area. Due to the lack of specificuse information regarding permit holders (who may be berry pickers,hikers, birders, bicyclists, etc.) it is impossible to specifically determinerecent subsistence use of the installation. (U.S. Department of theArmy, 1999—Alaska Army L<strong>and</strong>s Renewal Final Legislative EIS)NMD Deployment Final EIS 3-433
Chapter 3—Affected EnvironmentSubsistence users from other portions of the state may also travel to FortGreely in time of game shortages in their region. However, this eventdoes not occur on a regular basis, <strong>and</strong> the use of Fort Greely forsubsistence purposes would remain relatively low.3.16.5 YUKON TRAINING AREA (FORT WAINWRIGHT)The Yukon Training Area is part of the historic subsistence range of theChena b<strong>and</strong> <strong>and</strong> the Salcha b<strong>and</strong>. The Chena b<strong>and</strong> utilized northernportions of the Yukon Training Area within the Chena River drainage,while the Salcha b<strong>and</strong> utilized southern portions of the Yukon TrainingArea within the Salcha River drainage. Development in this region wasdevastating to these b<strong>and</strong>s <strong>and</strong> by the 1960s virtually eliminated thehistoric subsistence ranges.The Yukon Training Area is within the Fairbanks North Star Borough,which is not considered a rural area <strong>and</strong>, therefore, residents are notqualified as Federal subsistence users. However, Game ManagementUnit 20B has several seasons <strong>and</strong> bag limits for Federal subsistencehunters, all of which overlap entirely with current state bag limits <strong>and</strong>seasons. Subsistence users from outside the borough may utilize theYukon Training Area for subsistence use. Such use is infrequent if itoccurs. (U.S. Department of the Army, 1999—Alaska Army L<strong>and</strong>sRenewal Final Legislative EIS)Between 1991 <strong>and</strong> 1997, an average of 2,449 hunting, fishing, <strong>and</strong>trapping permits were issued annually to mostly recreational users for all ofFort Wainwright <strong>and</strong> Eielson AFB combined (of which the Yukon TrainingArea is less than 30 percent). Almost all of these permit holders would failto qualify as subsistence users, <strong>and</strong> almost all hunting, fishing, <strong>and</strong>trapping is for recreational purposes. (U.S. Department of the Army,1999—Alaska Army L<strong>and</strong>s Renewal Final Legislative EIS)3.16.6 WESTERN ALEUTIANS—FIBER OPTIC CABLE ALIGNMENTThis section describes the communities that would be potentially affectedby the laying of a fiber optic cable line <strong>and</strong> other Western Aleutiancommunities between Whittier <strong>and</strong> Eareckson Air Station, Shemya Isl<strong>and</strong>.This section is based on existing demographic, subsistence, <strong>and</strong>commercial fishing information.Based on the general alignment of the fiber optic cable line, listed beloware the communities that could be potentially affected by the project.This list includes most of the coastal communities from Whittier toShemya Isl<strong>and</strong>. Next, a brief community description is provided thatincludes a brief demographic profile <strong>and</strong> describes which of thecommunities participate in commercial <strong>and</strong> subsistence fishing. Based onCommercial Fisheries Entry Commission data, the type <strong>and</strong> magnitude of3-434 NMD Deployment Final EIS
Chapter 3—Affected Environmentcommercial fisheries in which residents of the communities participate isprovided. Based on Alaska Department of Fish <strong>and</strong> Game Division ofSubsistence data, the relative reliance on subsistence fishing is assessed.This section is limited to local fishing effort; it does not include anydiscussion of non-resident fishers. The subsistence information in thisreport is from Alaska Department of Fish <strong>and</strong> Game Division ofSubsistence Community Profile Data Base. Where there is more than 1year of subsistence data available in the Community Profile Data Base,the “most representative year” for each community, rather than anaverage of subsistence data for all years, is used. This section onlyincludes subsistence resource categories potentially affected by theproject (e.g., salmon, non-salmon fish, marine mammals, <strong>and</strong> marineinvertebrates). It does not include l<strong>and</strong> mammals, birds <strong>and</strong> eggs, <strong>and</strong>vegetation. Non-salmon subsistence fish include such species as herring,smelt, cod, flounder, greenling, halibut, rock fish, sablefish, sculpin, sole,<strong>and</strong> skates. The Alaska Department of Fish <strong>and</strong> Game Community ProfileData Base did not include data for Cold Bay <strong>and</strong> Seward.In addition to the fiber optic cable line addressed above, a secondredundant line may be required to meet NMD reliability requirements.This line could be north of the Aleutian Isl<strong>and</strong>s or connect to existingfiber optic cable in the central Pacific. Once the exact alignment isidentified, additional environmental analysis will be prepared.3.16.6.1 Communities Potentially Affected by the ProjectThe 21 communities presented in table 3.16-1 are potentially impactedby the project because they are coastal communities whose residentsparticipate in subsistence <strong>and</strong> commercial fishing in the vicinity of thefiber optic cable line route.The following coastal communities in the general vicinity of the projectare not included in this discussion for the reason listed next to thecommunity.Karluk—located on the northwest side of Kodiak Isl<strong>and</strong>Larsen Bay—located on the northwest side of Kodiak Isl<strong>and</strong>Nelson Lagoon—located on the north side of the AlaskaPeninsulaAdak Station CDP—former U.S. Government facilityEareckson Air Station—U.S. Government facilityAttu Coast Guard Station—U.S. Government facilityAmchitka CDP—U.S. Government facilityNMD Deployment Final EIS 3-435
Chapter 3—Affected EnvironmentTable 3.16-1: Coastal Communities from Whittier to Shemya PotentiallyAffected by the ProjectCommunityCensus Area1. Whittier Valdez–Cordova2. Chenega Bay Valdez–Cordova3. Seward Kenai-Peninsula Borough/Seward Census Subarea4. Kodiak Kodiak Isl<strong>and</strong> Borough5. Ouzinkie Kodiak Isl<strong>and</strong> Borough6. Port Lions Kodiak Isl<strong>and</strong> Borough7. Old Harbor Kodiak Isl<strong>and</strong> Borough8. Akhiok Kodiak Isl<strong>and</strong> Borough9. Chignik Bay Lake <strong>and</strong> Peninsula Borough10. Chignik Lagoon Lake <strong>and</strong> Peninsula Borough11. Chignik Lake Lake <strong>and</strong> Peninsula Borough12. Perryville Lake <strong>and</strong> Peninsula Borough13. Ivanof Bay Lake <strong>and</strong> Peninsula Borough14. S<strong>and</strong> Point Aleutians East15. King Cove Aleutians East16. Cold Bay Aleutians East17. False Pass Aleutians East18. Akutan Aleutians East19. Unalaska Aleutians West20. Nikolski Aleutians West21. Atka Aleutians WestTo the extent that Karluk, Larsen Bay, <strong>and</strong> Nelson Lagoon fishers rely onareas in the vicinity of the project for commercial <strong>and</strong> subsistence fishing,they are also potentially affected by the project.3.16.6.2 Community DescriptionsThe region potentially affected by the project can be divided into thefollowing subregions <strong>and</strong> corresponding communities:Prince William Sound (Whittier, Chenega Bay)SewardKodiak (Kodiak, Ouzinkie, Port Lions, Old Harbor, Ahkiok)Alaska Peninsula (Chignik Bay, Chignik Lagoon, Chignik Lake,Perryville, Ivanof Bay)3-436 NMD Deployment Final EIS
Chapter 3—Affected EnvironmentAleutians (S<strong>and</strong> Point, King Cove, Cold Bay, False Pass,Akutan, Unalaska, Nikolski, Atka)Prince William SoundWhittier, located in western Prince William Sound at the head of PassageCanal, is 121 kilometers (75 miles) southeast of Anchorage. The sitewas established as a port <strong>and</strong> railroad terminus by the U.S. Army fortransport of petroleum <strong>and</strong> other supplies during World War II. Two largebuildings, originally military housing, now are condominiums housingmost of Whittier’s 243 residents (table 3.16-2). The population ispredominantly non-native. They participate in commercial <strong>and</strong> sportfishing as well as subsistence activities. The economy is supported bythe shipping industry, local government, <strong>and</strong> tourism.Chenega Bay is on Evans Isl<strong>and</strong> in southwestern Prince William Sound,68 kilometers (42 miles) southeast of Whittier. The community waslocated originally on Chenega Isl<strong>and</strong> until the 1964 earthquake destroyedthe village <strong>and</strong> many residents perished; the new location was settled inthe mid-1980s. The population in 1990 was 94 people living in 34households. Sixty-nine percent of residents were Alaska Native, mainlyAluutiq Eskimo. The local economy consists mainly of commercialfishing, oyster farming, <strong>and</strong> subsistence activities.SewardBecause of its isolated location from most of the other communities,Seward does not easily fit into any of the other subregions. Seward islocated on Resurrection Bay on the southeastern Kenai Peninsula.Seward is also linked to Anchorage by rail. The town, founded in 1902,developed around its ice-free harbor <strong>and</strong> railroad terminus. The 1990population of 2,699 residents was 15 percent native. Seward’seconomy developed around being a transportation center <strong>and</strong> hasdiversified into tourism (including cruise ships <strong>and</strong> Kenai Fjords NationalPark boat tours), ship services, fish processing, coal export facility, aprison, the University of Alaska’s Institute of Marine Sciences, <strong>and</strong> thenew Alaska Sea Life Center. Residents participate in commercial fishing,sport fishing, <strong>and</strong> subsistence activities.KodiakThe Kodiak archipelago has been occupied by Sugpiaq Eskimos since8,000 B.C. <strong>and</strong> was settled by Russian fur trappers in 1792. Russiancolonization <strong>and</strong> the sea otter fur trade virtually decimated the SugpiaqEskimo population. The military established bases on Kodiak duringWorld War II <strong>and</strong> has maintained a presence since then. All communities(six villages <strong>and</strong> the city of Kodiak) are incorporated within the KodiakIsl<strong>and</strong> Borough. The economy of Kodiak <strong>and</strong> the smaller communities onKodiak Isl<strong>and</strong> is based primarily on commercial fishing.NMD Deployment Final EIS 3-437
Chapter 3—Affected EnvironmentTable 3.16-2: Demographic Data for Selected Coastal CommunitiesU.S. Census (1)Alaska Department of Fish <strong>and</strong> Game Division of SubsistenceDemographic Information (2)Household HeadsAlaska Department ofCommunity & RegionalAffairs (3)Community 1990PopulationPercentNativeAlaskaDepartment ofFish <strong>and</strong> GameStudy YearNumber ofHouseholdsPopulation PercentNativePercentBornLocallyAverageYearsResidencyCurrent PopulationAkhiok 77 93.5 1992 24 80 88.8 81.6 25.2 84Akutan 589 13.6 1990 31 102 85.4 69 28.5 414Atka 98 92.8 1994 29 85 91.4 85.7 32.6 106ChenegaBay94 69.2 1993 28 101 73.9 55.3 7.2 95Chignik Bay 188 45.2 1991 44 128 51.7 41.2 17.6 128ChignikLagoonChignikLake53 56.6 1989 15 41 65.9 65.4 28.4 80133 91.8 1991 33 131 91.6 51.2 2<strong>3.7</strong> 152Cold Bay 148 5.4 nd nd nd nd nd nd 146False Pass 69 76.5 1988 22 59 84.1 64.5 22.4 79Ivanof Bay 35 94.3 1989 7 32 96.9 57.1 14.5 28King Cove 677 39.3 1992 158 560 69.5 55.1 22.5 897Kodiak City 6,375 12.7 1993 1,994 6,058 9.4 8.4 14.8 6,869Kodiak Road 3,220 11.5 1991 1,161 4,002 10.3 8.3 15.2 ndNikolski 35 82.8 1990 20 49 73.5 78.3 36.2 27Old Harbor 284 88.7 1991 66 217 84.1 68.2 25.6 316Ouzinkie 209 85.2 1993 71 234 84.6 69.8 19.9 259Perryville 108 94.4 1989 31 116 94 78.6 36.9 101Port Lions 222 67.6 1993 80 236 66.2 51.9 18 264S<strong>and</strong> Point 878 49.3 1992 204 606 67.6 52 23.6 808Seward 2,699 15.2 nd nd nd nd nd nd 2,914Unalaska 3,089 8.4 1994 700 1,825 14.3 10.1 9.1 4,087Whittier 243 12.4 1990 103 279 13.9 0.7 7.1 289Total 19,523Sources:(1)Alaska Department of Labor, 1991—Alaska Population Overview 1990 Census & Estimates.(2)Alaska Department of Fish <strong>and</strong> Game, 1998—Community Profile Data Base.(3)Alaska Department of Community <strong>and</strong> Regional Affairs, 1996—Alaska's Cities, Towns <strong>and</strong> Villages.Note: There is significant variation in the population in some communities (e.g., Unalaska <strong>and</strong> Akutan) among the threesources of population data. This variation is likely due to the time of year for the enumeration was conducted; in some casesthe enumeration may include cannery workers.nd = no data3-438 NMD Deployment Final EIS
Chapter 3—Affected EnvironmentThe city of Kodiak was Russian America’s capital until it moved to Sitkaaround the time the United States purchased Alaska from Russia in 1867.Following Russian overharvesting of the sea otter, commercial fishingbecame the main economic activity in Kodiak, along with military activityduring <strong>and</strong> after World War II. The 1964 earthquake devastated the city<strong>and</strong> fishing fleet. By 1968, Kodiak was the largest fishing port in theUnited States in terms of dollar value. Kodiak also has the largest U.S.Coast Guard Station. The community had a population of 6,365 in 1990<strong>and</strong> was 13 percent native. A relatively large population of Asian/PacificIsl<strong>and</strong> ancestry (20 percent) resides in Kodiak, due mainly to commercialfishing <strong>and</strong> processing. Commercial fishing <strong>and</strong> processing are theeconomic mainstay, <strong>and</strong> residents also participate in sport fishing <strong>and</strong>subsistence. Kodiak is the economic <strong>and</strong> transportation hub for theoutlying villages of the Kodiak archipelago.The communities of Akhiok, Old Harbor, Ouzinkie, <strong>and</strong> Port Lions areaccessible from Kodiak only by air or water. The populations of thesecommunities range from 84 (Akhiok) to 316 (Old Harbor) <strong>and</strong> are 85percent or more native. The natives are mainly Sugpiaq Eskimos.Commercial fishing is the main source of cash income in thesecommunities, <strong>and</strong> subsistence is another important activity economicallyas well as culturally.Alaska PeninsulaThe communities of Chignik, Chignik Lake, Chignik Lagoon, Perryville,<strong>and</strong> Ivanof Bay along the south side of the Alaska Peninsula are part ofthe Lake <strong>and</strong> Peninsula Borough. They are southwest of Kodiak <strong>and</strong>Anchorage, <strong>and</strong> access is by air or water. Ivanof Bay is the smallestcommunity with a population of 28, <strong>and</strong> Chignik Lake is the largest witha population of 152. The communities are mostly native; Perryville,Ivanof Bay, <strong>and</strong> Chignik Lake are predominantly Aleut, whereas Chignik<strong>and</strong> Chignik Lagoon are Koniag. The populations of Chignik, ChignikLake, <strong>and</strong> Chignik Lagoon increase substantially in the summer with theinflux of seasonal fishers <strong>and</strong> cannery workers. Many Ivanof Bay,Perryville, <strong>and</strong> Chignik Lake residents leave their villages in the summerto fish elsewhere on the Peninsula. Commercial fishing is the economicmainstay of all five communities, <strong>and</strong> Chignik has two year-round fishprocessing plants. Subsistence is also an important element of the localeconomy <strong>and</strong> culture.AleutiansS<strong>and</strong> Point, King Cove, Cold Bay, False Pass, <strong>and</strong> Akutan are within theAleutians East Borough. S<strong>and</strong> Point is in the Shumagin Isl<strong>and</strong>s, 917kilometers (570 miles) from Anchorage. Its population is 808 <strong>and</strong> was49 percent native (primarily Aleut) in 1990. The town was founded in1898 as a cod fishing station, which brought many Sc<strong>and</strong>inavianNMD Deployment Final EIS 3-439
Chapter 3—Affected Environmentfishermen. The community is still centered around commercial fishing,with subsistence also culturally <strong>and</strong> economically important.Cold Bay is at the western end of the Alaska Peninsula. The communitywas originally established as a strategic air base during World War II.Because of its airport, Cold Bay is a regional hub for air transportation onthe Alaska Peninsula. It also services the fishing industry. Cold Bay’smostly non-native population numbers 146. Residents work mainly intransportation, government, <strong>and</strong> retail trade. Residents also participate insubsistence <strong>and</strong> sport fishing <strong>and</strong> hunting.King Cove is also at the western end of the peninsula, 1,006 kilometers(625 miles) from Anchorage. The town grew up around the cannery thatwas built there in 1911. Like S<strong>and</strong> Point, the community was settledoriginally by Aleuts, Sc<strong>and</strong>inavians, <strong>and</strong> other Europeans. Presently, thepopulation numbers 897, <strong>and</strong> in 1990 was 40 percent non-native. Theeconomy is based on commercial fishing, with the cannery <strong>and</strong> with 75residents holding commercial fishing permits. Subsistence is culturally<strong>and</strong> economically important as well.False Pass is on Unimak Isl<strong>and</strong>, 1,040 kilometers (646 miles) fromAnchorage. The town was settled by Aleuts from the surrounding areawhen a cannery was built there in 1917. The population of 79 is mostlyAleut. Commercial fishing is the mainstay of the economy, <strong>and</strong>subsistence hunting <strong>and</strong> fishing are significant as well.Unalaska, on Unalaska Isl<strong>and</strong> (1,287 kilometers [800 miles] fromAnchorage), is the largest community in the Aleutians. Its population is4,087, <strong>and</strong> in 1990 was 62 percent Caucasian, 8 percent native, 18percent Asian/Pacific Isl<strong>and</strong>ers, <strong>and</strong> 8 percent “other ethnic.” Thismixture is the result of a large scale, year-round fishing industry. Thetown has fish processing plants, a harbor suitable for large factorytrawlers <strong>and</strong> cargo ships, fleet services, <strong>and</strong> is strategically locatedbetween Asia <strong>and</strong> North America. The harbor ranks first in the UnitedStates for seafood volume <strong>and</strong> value.Akutan is located 56 kilometers (35 miles) east of Unalaska on AkutanIsl<strong>and</strong>. The site was originally a fur storage <strong>and</strong> trading port, then a codfishing <strong>and</strong> processing plant. These economic activities attracted Aleutsto the community, which also served as a whaling station in the early1900s. The present population is about 414, <strong>and</strong> in 1990 was 14percent native. This number includes workers from the fish processingplants nearby. The largest ethnic group in 1990 was Asian/PacificIsl<strong>and</strong>ers (42 percent). Commercial fishing is the backbone of the localeconomy.Nikolski <strong>and</strong> Atka are small Aleut villages far out in the Aleutian Isl<strong>and</strong>schain; Atka is 1,770 kilometers (1,100 miles) from Anchorage, <strong>and</strong>3-440 NMD Deployment Final EIS
Chapter 3—Affected EnvironmentNikolski is a bit closer. Both communities have been occupied forthous<strong>and</strong>s of years. Nikolski’s population is 27; Atka’s populationnumbers 106; <strong>and</strong> both are predominantly Aleut (83 <strong>and</strong> 92 percent,respectively). Nikolski was involved in sea otter hunting under Russianrule in the early 1800s, <strong>and</strong> fox farming in the early 1900s. Presentlyresidents maintain sheep <strong>and</strong> cattle herds, work outside the village in fishprocessing, <strong>and</strong> conduct subsistence fishing <strong>and</strong> hunting to supportthemselves. Atka residents also depend primarily on subsistence, withadditional employment in commercial fishing.3.16.6.3 Commercial Fishing in CommunitiesResidents of the study area communities participate in <strong>and</strong> rely oncommercial fishing. It is the economic mainstay of these communities aswell as an important component of residents’ cultural identity. Importantcommercial species include salmon, crab (Dungeness, king, <strong>and</strong> Tanner),halibut, herring, saltwater finfish, <strong>and</strong> black cod. Alaska commercialfishing areas potentially affected by the project include the following (seefigure 3.16-1):Prince William Sound (Area E)Kodiak (Area K)Chignik (Area L)Alaska Peninsula (Area M)Dutch Harbor (Area O)Adak <strong>and</strong> Western Aleutians (Area R)Based on Commercial Fisheries Entry Commission commercial fishingdata for 1996, table 3.16-3 provides information for each community on:The number of separate permit fisheries in which residents ofeach community participateThe number of people who own permitsThe number of permits that are fished in each communityThe pounds harvestedThe estimated gross earningsThe primary fisheries in which residents participateAs shown in table 3.16-3, in 1996, 957 individuals held 1,803 Alaskalimited entry fishing permits <strong>and</strong> participated in 263 different fisheries.The 1996 harvest totaled over 148 million kilograms (326 millionpounds), <strong>and</strong> the gross earnings were in excess of $133 million.NMD Deployment Final EIS 3-441
XIIIYZIIWKEAIDLBALASKA COMMERCIAL FISHERIESREGIONS AND AREASREGION I: SOUTHEASTERN: Dixon Entrance toCape SucklingAreas: A. Juneau & YakutatB. KetchikanC. PetersburgD. SitkaREGION II: CENTRAL: State Third Judicial DivisionNorthern Boundary to Cape Suckling to Cape Douglasto Cape Menshikof to Cape NewenhamAreas: E. Prince William SoundH. Cook InletT. Bristol Bay (salmon <strong>and</strong> herring catch; allfish <strong>and</strong> shellfish production)ROMIVREGION III: ARTIC-YUKON-KUSKOKWIM (AYK):North of State Third Judicial Division Northern Boundarywhich ends at the west Cape Newenham includingNunivak, St. Matthew, <strong>and</strong> St. Lawrence Isl<strong>and</strong>sAreas: W. KuskokwimX. KotzebueY. YukonZ. Norton SoundREGION IV: WESTERN: Cape Douglas to UnimakPass to Cape Newenham including Kodiak <strong>and</strong> AleutianIsl<strong>and</strong>sAreas: K. KodiakL. ChignikM. Alaska PeninsulaO. Dutch HarborQ. Bering SeaR. Adak & W. AleutiansT. Bristol Bay (fish other than salmon <strong>and</strong>herring catch; <strong>and</strong> shellfish catch)Commercial FisheriesRegions <strong>and</strong> AreasNORTHsub_ak_foc_0013-442Scale0 193 385 miles0 310 620 kilometersNMD Deployment Final EISAlaskaFigure 3.16-1
Chapter 3—Affected EnvironmentTable 3.16-3: Commercial Fisheries Participation <strong>and</strong> Harvest for Selected CoastalCommunities, 1996CommunityNumber ofFisheries (1)Number ofPeopleNumber ofPermitsFishedKilograms(Pounds)EstimatedGrossEarningsAkhiok (2) 1 2 2 *** *** SalmonAkutan (2) 2 6 6 2,910 (6,415) $12,628 HalibutAtka (2) 4 10 10 61,250(135,034)Chenega Bay 1 4 4 83,948(185,074)Chignik Bay (2) 4 15 21 1,023,509(2,256,450)ChignikLagoonChignikLake (2)7 19 32 2,000,721(4,410,835)3 7 9 298,488(658,054)Primary Fisheries$206,059 Halibut <strong>and</strong> salmon$121,889 Salmon$1,534,901 Salmon, halibut, herring$3,001,436 Salmon, halibut, Dungenesscrab, herring, misc. saltwaterfinfish$554,641 Salmon <strong>and</strong> herringCold Bay 1 1 1 *** *** SalmonFalse Pass 5 12 17 512,777(1,130,480)$627,568 Salmon <strong>and</strong> halibutIvanof Bay 2 3 3 *** *** Salmon <strong>and</strong> halibutKing Cove 22 69 143 6,639,122(14,636,759)Kodiak City 53 490 955 103,598,800(228,396,233)Nikolski 0 0 0 0 0Old Harbor 13 27 55 2,210,914(4,874,231)Ouzinkie 8 23 30 345,586(761,886)Perryville (2) 2 8 9 357,729(788,657)Port Lions 14 17 31 801,045(1,766,001)S<strong>and</strong> Point 33 109 227 22,757,630(50,171,985)$4,433,123 Salmon, halibut, king <strong>and</strong>Tanner crab, misc. saltwaterfinfish$91,614,927 Salmon, halibut, king <strong>and</strong>Tanner crab, misc. saltwaterfinfish, herring, black cod$2,906,064 Salmon, herring, misc.saltwater finfish, <strong>and</strong> halibut$396,567 Salmon, halibut, misc.saltwater finfish, herring$658,454 Salmon <strong>and</strong> herring$1,038,479 Salmon; Dungeness, king <strong>and</strong>Tanner crab; halibut; misc.saltwater finfish; herring$11,522,729 Salmon, halibut, herring, king<strong>and</strong> Tanner crab, misc.saltwater finfishNMD Deployment Final EIS 3-443
Chapter 3—Affected EnvironmentTable 3.16-3: Commercial Fisheries Participation <strong>and</strong> Harvest for Selected CoastalCommunities, 1996 (Continued)CommunityNumber ofFisheries (1)Numberof PeopleNumber ofPermitsFishedPoundsSeward 35 60 111 3,406,759(7,510,618)Unalaska (3) 44 65 121 3,778,726(8,330,664)Whittier 9 10 16 80,582(177,652)Totals 263 957 1,803 147,960,500(326,197,028)EstimatedGrossEarningsPrimary Fisheries$5,891,727 Salmon, black cod,halibut, herring, king <strong>and</strong>Tanner crab, misc.saltwater finfish$8,792,148 Halibut; king, Dungeness<strong>and</strong> Tanner crab; misc.saltwater finfish; salmon;black cod$163,376 Black cod, halibut,salmon, shrimp$133,476,716Source: Alaska Commercial Fisheries Entry Commission, 1996—Commercial Fishing Statistics, Reports <strong>and</strong> Listings.(1)Number of fisheries refers to the number of different permit fisheries in which residents of the communityparticipate (e.g., species x gear x area)(2)Pounds <strong>and</strong> earnings are greater, but some data are not reported because there are too few fishers to makedata public.(3)Includes Dutch Harbor*** pounds <strong>and</strong> earnings are not public because there are too few fishers.3.16.6.4 Subsistence Harvests <strong>and</strong> Activities in CommunitiesIn addition to commercial fishing, residents of the potentially affectedcommunities participate in subsistence fishing, gathering of marineinvertebrates, <strong>and</strong> hunting marine mammals. Table 3.16-4 provides thefollowing subsistence information for 19 of the 21 communities (nosubsistence data were available for Cold Bay or Seward):Date of Alaska Department of Fish <strong>and</strong> Game Division ofSubsistence harvest surveyRelevant resource categories (e.g., all resources, fish [salmon<strong>and</strong> non-salmon], marine mammals <strong>and</strong> marine invertebrates)Percentage of households that used, tried to harvest,harvested, received, or gave away the subsistence resourceduring the study yearEstimated harvest presented as estimated number, totalpounds harvested, pounds per capita harvested, <strong>and</strong> thepercentage of the total harvest.3-444 NMD Deployment Final EIS
Chapter 3—Affected EnvironmentTable 3.16-4: Selected Subsistence Harvests <strong>and</strong> Subsistence Activitiesfor Selected Coastal CommunitiesAlaskaDepartment ofFish <strong>and</strong> GameStudy YearAkhiokResource Using TryingtoHarvestPercentage of HouseholdsHarvesting Receiving Giving EstimatedNumberTotalPounds (1)Estimated HarvestMeanHouseholdHarvest (1)PerCapitaPounds (1)PercentTotalHarvest1992 All Resources 100 100 100 96 83 25,735 1,072 322 100Fish 100 96 96 67 71 17,909 746 224 70Salmon 100 96 96 63 71 2,510 15,961 665 200 62Non-Salmon Fish 88 75 67 46 42 1,948 81 24 8Marine Mammals 71 42 25 63 33 20 1,552 65 19 6Marine Invertebrates 100 88 88 83 54 3,371 140 42 13Akutan1990 All Resources 100 96 96 100 92 47,397 1,529 466 100Fish 100 92 92 96 88 26,921 868 265 57Salmon 96 76 76 84 64 3,269 12,339 398 121 26Non-Salmon Fish 100 92 92 92 76 14,581 470 143 31Marine Mammals 92 48 44 84 40 142 10,767 347 106 23Marine Invertebrates 88 68 64 72 56 2,866 92 28 6Atka1994 All Resources 100 100 100 100 79 37,307 1,286 439 100Fish 96 89 86 93 68 15,152 522 178 41Salmon 96 79 79 82 57 2,386 8,051 278 95 22Non-Salmon Fish 93 82 75 86 64 7,100 245 84 19Marine Mammals 93 61 57 93 57 120 12,797 441 151 34Marine Invertebrates 86 61 61 75 57 444 15 5 1Chenega Bay1993 All Resources 100 96 96 100.0 91.3 27,809 993 275 100Fish 100 83 78 95.7 78.3 19,980 714 198 72Salmon 96 74 70 91.3 60.9 2,686 10,985 392 109 40Non-Salmon Fish 96 57 57 87.0 73.9 8,994 321 89 32Marine Mammals 57 44 44 56.5 43.5 85 3,528 126 35 13Marine Invertebrates 91 74 74 73.9 56.5 1,498 53 15 5Chignik Bay1991 All Resources 100 93 90 100 73 45,610 1,037 357 100Fish 100 87 83 80 70 35,846 815 281 79Salmon 100 80 80 70 67 4,403 21,825 496 171 48Non-Salmon Fish 97 80 67 67 50 14,021 319 110 31Marine Mammals 33 13 13 20 17 6 329 7 3 1Marine Invertebrates 100 77 70 93 47 4,958 113 39 11Chignik Lagoon1989 All Resources 100 87 80 93 73 8,669 578 211 100Fish 100 73 73 93 73 5,937 396 145 68Salmon 100 60 60 80 53 833 4,110 274 100 47Non-Salmon Fish 100 67 67 87 53 1,826 122 45 21Marine Mammals 13 7 7 7 0 2 0 0 0 0Marine Invertebrates 87 53 53 80 47 851 57 21 10NMD Deployment Final EIS 3-445
Chapter 3—Affected EnvironmentAlaskaDepartment ofFish <strong>and</strong> GameStudy YearTable 3.16-4: Selected Subsistence Harvests <strong>and</strong> Subsistence Activitiesfor Selected Coastal Communities (Continued)Resource Using TryingtoHarvestPercentage of HouseholdsHarvesting Receiving Giving EstimatedNumberTotalPounds (1)Estimated HarvestMeanHouseholdHarvest (1)PerCapitaPounds (1)PercentTotalHarvestChignik Lake1991 All Resources 100 100 100 100 92 57,783 1,751 442 100Fish 100 96 96 88 92 32,042 971 245 55Salmon 100 96 96 71 92 6,599 26,614 806 204 46Non-Salmon Fish 100 79 79 88 71 5,428 164 42 9Marine Mammals 71 25 21 63 29 10 539 16 4 1Marine Invertebrates 100 79 75 92 67 2,711 82 21 5False Pass1988 All Resources 100 100 100 100 95 28,586 1,299 413 100Fish 100 80 80 95 90 17,573 799 254 61Salmon 100 65 65 80 60 2,998 13,385 608 193 47Non-Salmon Fish 95 70 70 75 75 4,188 190 60 15Marine Mammals 60 30 30 55 30 1,753 80 25 6Marine Invertebrates 100 80 80 90 70 1,610 73 23 6Ivanof Bay1989 All Resources 100 100 100 100 100 15,677 2,240 490 100Fish 100 100 100 100 100 8,057 1,151 252 51Salmon 100 100 100 100 71 1,437 5,971 853 187 38Non-Salmon Fish 100 100 100 100 86 2,086 298 65 13Marine Mammals 86 71 57 71 57 14 878 125 27 6Marine Invertebrates 100 100 100 100 100 1,486 212 46 9King Cove1992 All Resources 100 97 96 95 81 143,496 908 256 100Fish 97 87 85 75 51 100,569 637 179 70Salmon 96 84 83 52 40 17,136 76,647 485 137 53Non-Salmon Fish 89 68 67 68 43 23,921 151 43 17Marine Mammals 25 13 13 16 9 1,180 7 2 1Marine Invertebrates 95 57 57 85 43 9,700 61 17 7Kodiak City1993 All Resources 99 91 88 97 84 915,070 459 151 100Fish 98 77 71 91 72 652,493 327 108 71Salmon 93 73 69 73 61 69,553 289,229 145 48 32Non-Salmon Fish 95 67 64 80 62 363,265 182 60 40Marine Mammals 2 1 1 2 1 38 0 0 0 0Marine Invertebrates 79 41 40 73 41 57,595 29 10 6Kodiak Road1991 All Resources 96 97 96 92 78 672,909 580 168 100Fish 93 90 84 75 70 502,364 433 126 75Salmon 91 86 80 59 61 58,722 243,167 209 61 36Non-Salmon Fish 84 75 72 53 53 259,197 223 65 39Marine Invertebrates 82 47 45 74 36 54,540 47 14 83-446 NMD Deployment Final EIS
Chapter 3—Affected EnvironmentAlaskaDepartment ofFish <strong>and</strong> GameStudy YearTable 3.16-4: Selected Subsistence Harvests <strong>and</strong> Subsistence Activitiesfor Selected Coastal Communities (Continued)Resource Using TryingtoHarvestPercentage of HouseholdsHarvesting Receiving Giving EstimatedNumberTotalPounds (1)Estimated HarvestMeanHouseholdHarvest (1)PerCapitaPounds (1)PercentTotalHarvestNikolski1990 All Resources 100 100 93 100 86 36,945 1,847 761 100Fish 100 93 86 86 79 18,629 931 384 50Salmon 100 93 86 64 79 1,903 7,819 391 161 21Non-Salmon Fish 100 93 86 86 71 10,810 541 223 29Marine Mammals 93 64 64 79 64 71 7,469 373 154 20Marine Invertebrates 93 71 57 79 43 203 10 4 1Old Harbor1991 All Resources 100 100 100 98 95 84,781 1,285 391 100Fish 100 93 93 88 88 60,793 921 280 72Salmon 95 91 88 76 76 10,398 44,868 680 207 53Non-Salmon Fish 98 81 79 76 74 15,925 241 73 19Marine Mammals 62 14 14 55 33 68 6,009 91 28 7Marine Invertebrates 98 79 79 86 71 7,885 119 36 9Ouzinkie1993 All Resources 98 92 92 95 85 51,091 720 218 100Fish 98 79 79 80 66 32,521 458 139 64Salmon 93 75 75 64 62 5,695 23,948 337 102 47Non-Salmon Fish 89 62 61 69 53 8,574 121 37 17Marine Mammals 41 26 26 26 26 55 3,510 49 15 7Marine Invertebrates 93 72 69 77 54 5,122 72 22 10Perryville1989 All Resources 100 100 100 93 85 45,729 1,475 394 100Fish 100 93 93 89 67 31,506 1,016 272 69Salmon 100 89 89 82 63 5,206 23,451 756 202 51Non-Salmon Fish 96 78 74 89 63 8,055 260 69 18Marine Mammals 63 41 26 52 30 28 2,967 96 26 6Marine Invertebrates 96 89 85 74 63 2,373 77 20 5Port Lions1993 All Resources 100 100 100 100 91 78,371 980 331 100Fish 100 87 87 89 76 52,339 654 221 67Salmon100 82 82 62 69 8,991 37,280 466 158 48Non-Salmon Fish 96 69 69 82 49 15,059 188 64 19Marine Mammals 18 4 4 16 4 14 1,052 13 4 1Marine Invertebrates 93 89 87 71 53 7,149 89 30 9S<strong>and</strong> Point1992 All Resources 100 94 94 95 69 155,001 760 256 100Fish 100 82 79 83 56 116,054 569 191 75Salmon 99 76 72 74 47 19,441 83,320 408 137 54Non-Salmon Fish 97 74 72 64 39 32,734 160 54 21Marine Mammals 25 13 10 17 10 2,848 14 5 2Marine Invertebrates 90 64 64 79 39 10,796 53 18 7NMD Deployment Final EIS 3-447
Chapter 3—Affected EnvironmentAlaskaDepartment ofFish <strong>and</strong> GameStudy YearTable 3.16-4: Selected Subsistence Harvests <strong>and</strong> Subsistence Activitiesfor Selected Coastal Communities (Continued)Resource Using TryingtoHarvestPercentage of HouseholdsHarvesting Receiving Giving EstimatedNumberTotalPounds (1)Estimated HarvestMeanHouseholdHarvest (1)PerCapitaPounds (1)PercentTotalHarvestUnalaska1994 All Resources 97 94 94 95 84 355,081 507 195 100Fish 97 79 79 84 73 245,876 351 135 69Salmon 92 69 67 71 53 26,963 98,192 140 54 28Non-Salmon Fish 95 67 67 76 59 147,684 211 81 42Marine Mammals 14 5 4 13 7 170 17,536 25 10 5Marine Invertebrates 87 30 30 85 36 50,138 72 27 14Whittier1990 All Resources 94 79 77 87 66 22,308 217 80 100Fish 90 60 58 71 63 14,969 145 54 67Salmon 77 56 54 53 52 1,596 9,453 92 34 42Non-Salmon Fish 82 38 38 61 43 5,516 54 20 25Marine Mammals 8 1 1 7 1 7 265 3 1 1Marine Invertebrates 52 16 16 44 18 2,494 24 9 11Total 2,855,355Source: Alaska Department of Fish <strong>and</strong> Game, 1998—Community Profile Database.(1)Units in pounds, as originally provided in the source documentation. Conversion to metric units is omitted in this tablefor readability. Conversion to kilograms can be made by multiplying the number of pounds by 0.4535924.The percentage of households that use subsistence resources is high inall communities, ranging from 94 percent in Whittier to 100 percent in 15of the 20 communities for which data are available (table 3.16-4).Households that try to harvest subsistence foods (79 percent in Whittierto 100 percent in several communities) <strong>and</strong> do successfully harvestsubsistence foods (77 percent in Whittier to 100 percent in severalcommunities) is also high. Similarly, sharing subsistence foods (giving<strong>and</strong> receiving) was high in all communities, ranging from a low of 63percent of the households in Whittier to 100 percent of the households inseveral communities.The percentage of households that use, harvest, <strong>and</strong> share fish (bothsalmon <strong>and</strong> non-salmon) is higher than the percentage of households thatuse, harvest, <strong>and</strong> share marine mammals <strong>and</strong> marine invertebrates. Thisdifference likely reflects resource availability <strong>and</strong> cultural preferences inthe communities. Fish is the largest component of the subsistenceharvest in all communities (table 3.16-4).The per capita harvest in these communities ranges from 36 kilograms(80 pounds) in Whittier to 345 kilograms (761 pounds) per capita inNikolski. The total subsistence harvest in the 19 communities (plusKodiak Road) for the representative data year was 1.29 million kilograms(2.85 million pounds).3-448 NMD Deployment Final EIS