You also want an ePaper? Increase the reach of your titles
YUMPU automatically turns print PDFs into web optimized ePapers that Google loves.
<strong>2011</strong> <strong>Half</strong> <strong>Year</strong> <strong>Results</strong><br />
. . . . . . . . . . . . . . . . . . . . . . . . .<br />
. . . . . . . . . . . . . . . . . . . . . . . . .<br />
Erwin Stoller, Executive Chairman<br />
. . . . . . . . . . . . . . . . . . . . . . . . .<br />
Joris Gröflin, Chief Financial Officer
Agenda<br />
. . . . .<br />
. . . . .<br />
. . . . .<br />
. . . . .<br />
. . . . .<br />
. . . . .<br />
. . . . .<br />
. . . . .<br />
. . . . .<br />
<strong>Half</strong> year results July <strong>2011</strong><br />
1. Introduction and summary of HY1 <strong>2011</strong> Erwin Stoller<br />
2. Financial <strong>Results</strong> HY1 <strong>2011</strong> Joris Gröflin<br />
3. Outlook Erwin Stoller<br />
2
HY1: Introduction<br />
“<strong>Rieter</strong> achieved a very good result in the first half of <strong>2011</strong>.<br />
New products for the high and mid segments were well received and have<br />
strengthened our position in the growth markets.”<br />
Erwin Stoller<br />
Executive Chairman<br />
<strong>Half</strong> year results July <strong>2011</strong><br />
3
<strong>Rieter</strong> – Highlights HY1 <strong>2011</strong><br />
Highlights<br />
Separation <strong>Rieter</strong> Group completed<br />
• Focus on Spun Yarn Systems and Premium Textile Components<br />
• Enhanced strategic flexibility<br />
• Improved visibility for shareholders<br />
<strong>Half</strong> year results July <strong>2011</strong><br />
4
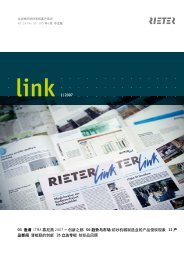
<strong>Rieter</strong> – Broadest global systems supplier<br />
Legend<br />
Sales<br />
Service<br />
R&D<br />
Production<br />
Americas<br />
<strong>Half</strong> year results July <strong>2011</strong><br />
Global supplier… …of spinning machinery and components<br />
Europe<br />
Full-liner…<br />
From bale… …to yarn<br />
Asia<br />
Preparation<br />
[Pic] [Pic]<br />
…covering preparation and<br />
all four spinning technologies<br />
High/import segment<br />
Mid/local segment<br />
Ring conventional (1)<br />
Ring compact (2)<br />
Rotor (3)<br />
Air-Jet (4)<br />
5
<strong>Rieter</strong> – Highlights HY1 <strong>2011</strong><br />
Pleasing trend of business at <strong>Rieter</strong><br />
• Market exploit: Gratifying order intake and sales growth<br />
• Order intake at high level and above long term average<br />
• Striking increase of sales<br />
• Both business groups strengthened their market position in the growth markets<br />
• Strong increase of EBIT margin to 12.8% of corporate output<br />
• Both business groups contributed to this very good result<br />
• Solid balance sheet further strengthened after spin-off of Autoneum<br />
• Enables future profitable growth<br />
<strong>Half</strong> year results July <strong>2011</strong><br />
6
Agenda<br />
. . . . .<br />
. . . . .<br />
. . . . .<br />
. . . . .<br />
. . . . .<br />
. . . . .<br />
. . . . .<br />
. . . . .<br />
. . . . .<br />
<strong>Half</strong> year results July <strong>2011</strong><br />
1. Introduction and summary of HY1 <strong>2011</strong> Erwin Stoller<br />
2. Financial <strong>Results</strong> HY1 <strong>2011</strong> Joris Gröflin<br />
3. Outlook Erwin Stoller<br />
7
<strong>2011</strong> <strong>Half</strong> <strong>Year</strong> Financial <strong>Results</strong><br />
. . . . . . . . . . . . . . . . . . . . . . . . .<br />
. . . . . . . . . . . . . . . . . . . . . . . . .<br />
. . . . . . . . . . . . . . . . . . . . . . . . .<br />
Joris Gröflin, Chief Financial Officer
Financial Highlights HY1 <strong>2011</strong><br />
• New reporting structure: First-time presentation of figures after spin-off<br />
of automotive business<br />
• Market exploit: Gratifying order intake and sales growth<br />
• Order intake remained at high level in both business groups and above longterm<br />
average<br />
• Striking increase of sales by 66% to 537.8 million CHF – corporate output<br />
increased to 551.9 million CHF<br />
• Increase in both business groups driven by sales to Asia<br />
• Strong increase of EBIT and net profit<br />
• Strong EBIT margin of 12.8% of corporate output achieved<br />
• Net profit margin before exceptional items at 8.8% of corporate output<br />
• Sale of LMW shares increased net profit by 42.3 million CHF<br />
<strong>Half</strong> year results July <strong>2011</strong><br />
9
Financial Highlights HY1 <strong>2011</strong><br />
• Solid balance sheet<br />
• Thanks to strong net profit, balance sheet gained solidity after spin-off of<br />
Autoneum on May 13 – equity ratio remains at 32%<br />
• Strong free cash flow of 63.3 million CHF further strengthened net liquidity to<br />
149.8 million CHF<br />
• Long-term financing was secured by confirmation of the 250 million CHF bond<br />
(2015) at the bondholders’ meeting on May 10<br />
<strong>Half</strong> year results July <strong>2011</strong><br />
10
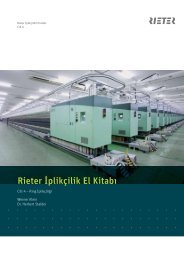
Orders by business group<br />
Order intake remained at high level in both business groups<br />
CHF million<br />
900<br />
800<br />
700<br />
600<br />
500<br />
400<br />
300<br />
200<br />
100<br />
0<br />
739<br />
112<br />
625<br />
2<br />
HY1 2010<br />
Premium Textile Components<br />
Spun Yarn Systems<br />
<strong>Half</strong> year results July <strong>2011</strong><br />
-9%<br />
716<br />
123<br />
593<br />
HY2 2010<br />
Other<br />
671<br />
119<br />
553<br />
HY1 <strong>2011</strong><br />
• Order intake dropped 9% compared to<br />
HY1 2010 (in local currency -5%)<br />
• Demand for textile machinery and<br />
components remained especially strong<br />
in Q1 and leveled off in Q2<br />
• Orders were widely spread, led by<br />
dominating countries India, Turkey and<br />
China followed by South Korea, US,<br />
Egypt, Indonesia, Brazil and Pakistan<br />
• HY1 <strong>2011</strong> orders remained over long<br />
term average of 548 Mio CHF<br />
11
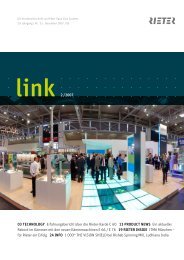
Orders received HY1 2005 – HY1 <strong>2011</strong><br />
Order intake exceeded long term average<br />
CHF million<br />
1.000<br />
997<br />
900<br />
800<br />
864<br />
700<br />
668<br />
600<br />
500<br />
400<br />
300<br />
200<br />
100<br />
0<br />
425<br />
511<br />
HY1 HY2 HY1 HY2 HY1<br />
2005 2005 2006 2006 2007<br />
2005 - 2010 adjusted for divestiture<br />
<strong>Half</strong> year results July <strong>2011</strong><br />
549<br />
HY2<br />
2007<br />
390<br />
HY1<br />
2008<br />
110<br />
HY2<br />
2008<br />
180<br />
HY1<br />
2009<br />
302<br />
HY2<br />
2009<br />
737<br />
HY1<br />
2010<br />
716<br />
HY2<br />
2010<br />
671<br />
HY1<br />
<strong>2011</strong><br />
Ø 548<br />
12
Sales by business group<br />
Striking increase of sales by 66%<br />
CHF million<br />
700<br />
600<br />
500<br />
400<br />
300<br />
200<br />
100<br />
0<br />
325<br />
93<br />
227<br />
5<br />
<strong>Half</strong> year results July <strong>2011</strong><br />
+66%<br />
545<br />
98 113<br />
448<br />
HY1 2010 HY2 2010<br />
Premium Textile Components<br />
Spun Yarn Systems<br />
Others<br />
538<br />
425<br />
HY1 <strong>2011</strong><br />
• Sales increase 66% compared to<br />
HY1 2010 (in local currency 73%)<br />
• Spun Yarn Systems grew by 88%<br />
compared to HY1 driven by high order<br />
backlog and intake (in local currency<br />
95%)<br />
• Premium Textile Components increased<br />
21% (in local currency 29%)<br />
• Continued ramp-up led to corporate<br />
output increase to 551.9 million CHF<br />
(HY1 2010: 332.6 million CHF,<br />
HY2 2010: 508.8 million CHF) resulting<br />
in seasonally higher inventories<br />
13
Sales development by region<br />
Increase driven by sales to Asia<br />
CHF million<br />
450<br />
400<br />
350<br />
300<br />
250<br />
200<br />
150<br />
100<br />
50<br />
0<br />
57<br />
Europe<br />
HY1 2010<br />
HY1 <strong>2011</strong><br />
<strong>Half</strong> year results July <strong>2011</strong><br />
+15% +93% +0%<br />
66<br />
211<br />
407<br />
Asia 1)<br />
21<br />
1) Including Turkey<br />
21<br />
North<br />
America<br />
+36%<br />
28<br />
38<br />
Latin<br />
America<br />
-12%<br />
7<br />
6<br />
Africa<br />
• Market exploit mainly driven by Asia<br />
with absolute growth of 196 million CHF<br />
(+93%)<br />
• Share of sales to Asia increased to 76%<br />
(HY1 2010: 65%)<br />
• Both Spun Yarn Systems and Premium<br />
Textile Components profited from<br />
upswing in Asia followed by South<br />
America (+36%) and Europe (+15%)<br />
14
Operating result (EBIT)<br />
Strong EBIT margin of 12.8% of corporate output achieved<br />
In % of CO 0.6% 14.5%<br />
12.8%<br />
CHF million<br />
90<br />
80<br />
70<br />
60<br />
50<br />
40<br />
30<br />
20<br />
10<br />
0<br />
-10<br />
-20<br />
2<br />
9<br />
6<br />
-13<br />
HY1 2010<br />
Premium Textile Components<br />
Spun Yarn Systems<br />
<strong>Half</strong> year results July <strong>2011</strong><br />
+69<br />
74<br />
20<br />
56<br />
-2<br />
HY2 2010<br />
Other<br />
71<br />
22<br />
50<br />
-1<br />
HY1 <strong>2011</strong><br />
• Strong absolute EBIT growth by 68.6<br />
million CHF versus HY1 2010 due to<br />
high capacity utilization and continued<br />
cost discipline<br />
• EBIT margin at strong 12.8% of<br />
corporate output<br />
• EBITDA increased from HY1 2010 of<br />
22.2 million CHF (6.7% of corporate<br />
output) to 87.8 million CHF (15.9% of<br />
corporate output)<br />
15
Net Profit<br />
Net profit margin before exceptional items at 8.8% of corporate output<br />
In % of CO 2.3% 14.8% 16.5%<br />
CHF million<br />
120<br />
100<br />
80<br />
60<br />
40<br />
20<br />
0<br />
8<br />
HY1 2010<br />
<strong>Half</strong> year results July <strong>2011</strong><br />
+84<br />
75<br />
HY2 2010<br />
91<br />
HY1 <strong>2011</strong><br />
• Net profit from continued operations<br />
before sale of LMW share equals 48.7<br />
million CHF (8.8% of corporate output)<br />
• Sale of LMW shares contributed 42.3<br />
million CHF to net profit<br />
• Earnings per share increased to 19.64<br />
CHF<br />
• Net profit including discontinued<br />
operations (Automotive) of 242.0 million<br />
CHF distorted by mandatory fair value<br />
adjustments<br />
16
Changes in workforce<br />
Significant increase of temporary personnel and employees in Asia<br />
Temporaries<br />
in %<br />
FTE 1)<br />
5.000<br />
4.500<br />
4.000<br />
3.500<br />
3.000<br />
2.500<br />
2.000<br />
1.500<br />
1.000<br />
500<br />
0<br />
<strong>Half</strong> year results July <strong>2011</strong><br />
20.7% 28.2% 28.6%<br />
4.064<br />
127<br />
1.400<br />
2.537<br />
HY1 2010<br />
North / Latin America<br />
+661<br />
4.395<br />
127<br />
1.672<br />
2.596<br />
HY2 2010<br />
Asia<br />
1) Excluding apprentices and temporary employees<br />
Europe<br />
4.725<br />
132<br />
1.879<br />
2.714<br />
HY1 <strong>2011</strong><br />
• Temporary employees increased to<br />
1‘893 (HY1 2010: 1‘061) or 28.6% of<br />
total workforce<br />
• 70% of fix employee increase of 661<br />
were related to volume increase and<br />
expansion projects at locations in India<br />
and China<br />
• Increase in Europe (+7%) is volume<br />
driven and predominantly in Eastern<br />
Europe<br />
17
Balance sheet<br />
Solid balance sheet further strengthened after spin-off<br />
CHF million<br />
Total assets<br />
Non-current assets<br />
Net working capital<br />
Liquid funds<br />
Net liquidity<br />
Short-term financial debt<br />
Long-term financial debt<br />
Shareholders’ equity<br />
in % of total assets<br />
<strong>Half</strong> year results July <strong>2011</strong><br />
30.06.<br />
<strong>2011</strong><br />
1‘135.5<br />
301.2<br />
65.6<br />
428.5<br />
149.8<br />
6.0<br />
272.7<br />
360.4<br />
32%<br />
31.12.<br />
2010<br />
1‘969.1<br />
802.2<br />
89.7<br />
359.0<br />
-3.5<br />
66.2<br />
296.3<br />
627.6<br />
32%<br />
30.06.<br />
2010<br />
1‘938.6<br />
833.3<br />
69.3<br />
343.4<br />
-18.0<br />
71.7<br />
289.7<br />
632.6<br />
33%<br />
• HY1 <strong>2011</strong> balance sheet after spin-off<br />
of automotive business (Autoneum),<br />
2010 figures are prior to spin-off<br />
• Net liquidity of 149.8 million CHF<br />
positively impacted by strong free cash<br />
flow of 63.3 million CHF<br />
• Shareholders‘ equity ratio at 32%<br />
• Bond of 250 million CHF (2015, 4.5%)<br />
secures financing of business<br />
development<br />
18
Net working capital<br />
Net working capital increase due to higher inventories<br />
CHF million<br />
Inventories<br />
Trade receivables<br />
Other receivables<br />
Trade payables<br />
Advance payments<br />
Other current liabilities<br />
Net working capital<br />
<strong>Half</strong> year results July <strong>2011</strong><br />
30.06.<br />
<strong>2011</strong><br />
251.0<br />
90.4<br />
64.4<br />
-74.2<br />
-83.7<br />
-182.3<br />
65.6<br />
31.12.<br />
2010<br />
328.4<br />
381.5<br />
98.0<br />
-315.8<br />
-110.9<br />
-291.5<br />
89.7<br />
30.06.<br />
2010<br />
308.8<br />
360.7<br />
92.4<br />
-241.0<br />
-101.9<br />
-349.7<br />
69.3<br />
• HY1 <strong>2011</strong> net working capital after spinoff<br />
of automotive business (Autoneum),<br />
2010 figures are prior to spin-off<br />
• Corporate output ramp-up led to<br />
seasonally high inventories<br />
• Advance payments from customers<br />
partially financed the inventory build-up<br />
19
Capital expenditures<br />
Continuation of expansion in India and China drove capital expenditures<br />
In % of CO 1.2% 4.3% 2.6%<br />
CHF million<br />
25<br />
20<br />
15<br />
10<br />
5<br />
0<br />
4<br />
1<br />
2<br />
HY1 2010<br />
Premium Textile Components<br />
Spun Yarn Systems<br />
<strong>Half</strong> year results July <strong>2011</strong><br />
+11<br />
22<br />
3<br />
19<br />
HY2 2010<br />
14<br />
3<br />
12<br />
HY1 <strong>2011</strong><br />
• Capital expenditures increased by<br />
10.5 million CHF and reached 2.6% of<br />
Corporate Output<br />
• Expansion projects in India and China<br />
accounted for 73% of capital<br />
expenditures in HY1 <strong>2011</strong><br />
20
Free cash flow (continuing operations)<br />
Strong free cash flow of 63.3 million CHF generated<br />
CHF million<br />
Net profit<br />
Depreciation and amortization<br />
+/- Reversal of disposal gains<br />
+/- Change in net working capital<br />
+/- Capital expenditure, net<br />
+/- Change in other financial assets<br />
Free cash flow before divestments<br />
+/- Sale LMW shares / divestments<br />
Free cash flow<br />
<strong>Half</strong> year results July <strong>2011</strong><br />
HY1<br />
<strong>2011</strong><br />
91.0<br />
17.2<br />
-44.1<br />
-30.7<br />
-12.2<br />
-0.2<br />
21.0<br />
42.3<br />
63.3<br />
HY1<br />
2010<br />
7.5<br />
20.2<br />
-3.2<br />
-11.9<br />
-2.5<br />
+5.5<br />
15.6<br />
-0.8<br />
14.8<br />
• Strong free cash flow of 63.3 million<br />
CHF (14.8 million CHF)<br />
• Free cash flow before divestments<br />
increased to 21.0 million CHF<br />
(HY1 2010: 15.6 million CHF) despite<br />
higher net working capital and capital<br />
expenditures<br />
• Sale of LMW shares contributed further<br />
42.3 million CHF to free cash flow<br />
21
Net liquidity<br />
Net liquidity positively impacted by strong free cash flow<br />
CHF million<br />
-4<br />
Net liquidity<br />
31.12.2010<br />
<strong>Half</strong> year results July <strong>2011</strong><br />
94<br />
Impact of<br />
spin-off (debt<br />
repayment et<br />
al.)<br />
91<br />
Net liquidity<br />
post<br />
separation<br />
21<br />
Free cash<br />
flow before<br />
divestments<br />
42<br />
Free cash flow:<br />
63 million CHF<br />
Sale LMW<br />
shares<br />
-4<br />
Other<br />
150<br />
Net liquidity<br />
30.06.<strong>2011</strong><br />
22
Spun Yarn Systems HY1 <strong>2011</strong><br />
Leading systems supplier in the spinning process<br />
<strong>Half</strong> year results July <strong>2011</strong><br />
23
Spun Yarn Systems: Sales<br />
Striking increase of sales by 88%<br />
CHF million<br />
500<br />
450<br />
400<br />
350<br />
300<br />
250<br />
200<br />
150<br />
100<br />
50<br />
0<br />
227<br />
HY1 2010<br />
<strong>Half</strong> year results July <strong>2011</strong><br />
+88%<br />
448<br />
HY2 2010<br />
425<br />
HY1 <strong>2011</strong><br />
• HY1 <strong>2011</strong> sales increased by 88%<br />
driven by high order backlog and intake<br />
(in local currency 95%)<br />
• Continued ramp-up led to corporate<br />
output increase to 449.4 million CHF<br />
(HY1 2010: 242.0 million CHF,<br />
HY2 2010: 427.4 million CHF) resulting<br />
in seasonally higher inventories<br />
• Market exploit succeeded in all regions<br />
with Turkey, India and China as<br />
dominating countries<br />
• Market position strengthened in the<br />
local segments in China and India with<br />
ring and rotor spinning machines and<br />
draw frames<br />
24
Spun Yarn Systems: Operating result (EBIT)<br />
EBIT increased by 63 million CHF to strong 11.0% of corporate output<br />
In % of CO -5.5% 13.1% 11.0%<br />
CHF million<br />
70<br />
60<br />
50<br />
40<br />
30<br />
20<br />
10<br />
0<br />
-10<br />
-20<br />
-13<br />
HY1 2010<br />
<strong>Half</strong> year results July <strong>2011</strong><br />
+63<br />
56<br />
HY2 2010<br />
50<br />
HY1 <strong>2011</strong><br />
• EBIT improved to 49.6 million CHF<br />
thanks to increased sales, attractive<br />
products and high capacity utilization<br />
• EBIT increased to 11.0% of corporate<br />
output<br />
• EBITDA improved to 58.6 million CHF<br />
(-3.0 million CHF in HY1 2010), which<br />
corresponds to 13.0% of corporate<br />
output<br />
25
Premium Textile Components HY1 <strong>2011</strong><br />
Leading supplier of premium textile components<br />
<strong>Half</strong> year results July <strong>2011</strong><br />
26
Premium Textile Components: Sales<br />
Strong increase of sales by 21% and of corporate output by 40%<br />
CHF million<br />
150<br />
100<br />
50<br />
0<br />
93<br />
HY1 2010<br />
<strong>Half</strong> year results July <strong>2011</strong><br />
+21%<br />
98<br />
HY2 2010<br />
113<br />
HY1 <strong>2011</strong><br />
• Sales increased by 21% to 112.7 million<br />
CHF<br />
• Continued high ramp-up in seasonally<br />
strong HY1 <strong>2011</strong> led to corporate output<br />
increase to 150.2 million CHF<br />
(HY1 2010: 107.4 million CHF,<br />
HY2 2010: 129.8 million CHF)<br />
• Main regions were India, China and<br />
Turkey followed by Europe and USA<br />
• Market position strengthened in India<br />
through Suessen and Bräcker<br />
components for ringspinning and in<br />
China with Graf components for<br />
spinning preparation machinery<br />
27
Premium Textile Components: Operating result (EBIT)<br />
EBIT increased further to 21.9 million CHF (14.6% of corporate output)<br />
In % of CO 8.8% 15.6% 14.6%<br />
CHF million<br />
30<br />
25<br />
20<br />
15<br />
10<br />
5<br />
0<br />
9<br />
HY1 2010<br />
<strong>Half</strong> year results July <strong>2011</strong><br />
+13<br />
20<br />
HY2 2010<br />
22<br />
HY1 <strong>2011</strong><br />
• EBIT improved to 21.9 million CHF<br />
thanks to increased sales, competitive<br />
products and high capacity utilization<br />
• EBIT in % corporate output increased to<br />
14.6%<br />
• EBITDA improved to 30.0 million CHF<br />
(19.1 million CHF in HY1 2010)<br />
equalling to 20.0% of corporate output<br />
28
Agenda<br />
. . . . .<br />
. . . . .<br />
. . . . .<br />
. . . . .<br />
. . . . .<br />
. . . . .<br />
. . . . .<br />
. . . . .<br />
. . . . .<br />
<strong>Half</strong> year results July <strong>2011</strong><br />
1. Introduction and summary of HY1 <strong>2011</strong> Erwin Stoller<br />
2. Financial <strong>Results</strong> HY1 <strong>2011</strong> Joris Gröflin<br />
3. Outlook Erwin Stoller<br />
29
<strong>2011</strong> Outlook<br />
. . . . . . . . . . . . . . . . . . . . . . . . .<br />
. . . . . . . . . . . . . . . . . . . . . . . . .<br />
. . . . . . . . . . . . . . . . . . . . . . . . .<br />
Erwin Stoller, Executive Chairman
Technology and Innovation Leadership<br />
Spun Yarn Systems – progress made in all four spinning technologies<br />
Ring conventional<br />
<strong>Half</strong> year results July <strong>2011</strong><br />
Ring compact<br />
Rotor R60 Airjet J20<br />
“The only global<br />
system supplier with<br />
all four spinning<br />
technologies”<br />
31
Technology and Innovation Leadership<br />
Premium Textile Components – market leader for compact spinning sets<br />
<strong>Half</strong> year results July <strong>2011</strong><br />
TITAN Rings<br />
• More than 30 million sold<br />
• Superior price performance ratio<br />
• Standard for compact spinning<br />
EliTe ® Compact Set<br />
• Easy installation<br />
• Less maintenance<br />
• Less energy consumption<br />
32
Technology and Innovation Leadership<br />
Competence in advanced sensor technology extended<br />
Drawframe RSB-D 45 Ringspin<br />
Rotor R 923 Rotor R 60 Airjet J 20<br />
<strong>Half</strong> year results July <strong>2011</strong><br />
33
Strengthen market position in growth markets<br />
Capacity extension for local products<br />
India:<br />
Koregaon Bhima, Wing<br />
<strong>Half</strong> year results July <strong>2011</strong><br />
China:<br />
Changzhou Plant 1, Plant 2<br />
34
Outlook <strong>2011</strong><br />
• <strong>Rieter</strong> expects the decrease in order intake to continue in the second half of the<br />
year compared to the first six months. Order intake for <strong>2011</strong> as a whole is<br />
unlikely to equal the previous year’s extraordinarily high total. <strong>Rieter</strong> foresees<br />
pressure on customers’ margins and liquidity persisting in the second half of<br />
<strong>2011</strong>.<br />
• It is currently difficult to forecast whether the factors that are impacting the<br />
markets are short-lived or will continue for a prolonged period. Further<br />
developments depend on various factors. These include exchange rate<br />
developments, consumer sentiment in Europe and North America, growth in fiber<br />
consumption in Asia and raw material prices . .<br />
• The high level of orders in hand secures capacity utilization and sales revenues<br />
in the current financial year and well into the coming year. <strong>Rieter</strong> will continue to<br />
pursue the expansion of facilities in Asia, product developments and process<br />
improvements in the second half of <strong>2011</strong>.<br />
<strong>Rieter</strong> expects a substantial increase in sales compared with the previous<br />
year and double-digit operating margins for the year as a whole.<br />
<strong>Half</strong> year results July <strong>2011</strong><br />
35
Values and principles<br />
<strong>Half</strong> year results July <strong>2011</strong><br />
Delight<br />
your<br />
customers<br />
Comfort<br />
thanks to <strong>Rieter</strong><br />
Enjoy your<br />
work<br />
Fight for<br />
profits<br />
<strong>Rieter</strong> is a publicly listed Swiss industrial group providing innovative<br />
solutions to the global textile industry.<br />
36
Disclaimer<br />
<strong>Rieter</strong> is making great efforts to include accurate and up-to-date information in this document,<br />
however we make no representations or warranties, expressed or implied, as to the accuracy or<br />
completeness of the information provided in this document and we disclaim any liability<br />
whatsoever for the use of it.<br />
The information provided in this document is not intended nor may be construed as an offer or<br />
solicitation for the purchase or disposal, trading or any transaction in any <strong>Rieter</strong> securities.<br />
Investors must not rely on this information for investment decisions.<br />
All statements in this report which do not reflect historical facts are statements related to the<br />
future which offer no guarantee with regard to future performance; they are subject to risks and<br />
uncertainties including, but not limited to, future global economic conditions, exchange rates,<br />
legal provisions, market conditions, activities by competitors and other factors outside the<br />
company's control.<br />
<strong>Half</strong> year results July <strong>2011</strong><br />
37
. . . . .<br />
. . . . .<br />
. . . . .<br />
. . . . .<br />
. . . . .<br />
. . . . .<br />
. . . . .<br />
. . . . .<br />
. . . . .<br />
<strong>Half</strong> year results July <strong>2011</strong><br />
Appendix<br />
38
Key Data per Share<br />
<strong>Rieter</strong> registered shares of 5 CHF nominal value<br />
Bloomberg: RIEN; Reuters: RITZn<br />
Shares outstanding excl. own shares<br />
(end of period)<br />
Average shares (of period)<br />
Share price (end of period) CHF<br />
Market capitalization<br />
(end of period) million CHF<br />
* prior to separation<br />
<strong>Half</strong> year results July <strong>2011</strong><br />
30.06.<strong>2011</strong><br />
4‘629‘445<br />
4‘621‘782<br />
219.50<br />
1‘016<br />
30.06.2010*<br />
4‘643‘649<br />
4‘641‘116<br />
275.00<br />
1‘277<br />
31.12.2010*<br />
4‘618‘869<br />
4‘640‘220<br />
339.00<br />
1‘566<br />
39