annual report 2012 - Pumpkin Patch investor relations
annual report 2012 - Pumpkin Patch investor relations
annual report 2012 - Pumpkin Patch investor relations
- No tags were found...

You also want an ePaper? Increase the reach of your titles
YUMPU automatically turns print PDFs into web optimized ePapers that Google loves.
chairperson’s letterDear ShareholdersWhile <strong>2012</strong> was another very challenging year for us as we continued to face volatile retailconditions across all of our markets, I look back on the year with a great deal of satisfactionwith the changes we have been implementing, the strategic initiatives we have introduced,and with the focus moving back to our core strengths.During the year we embarked on a major change process aimed at better preparing thebusiness for the future, simplifying our overseas operations, and refocusing on our core businessunits. Of course the most noticeable changes were the closures of the underperforming UnitedKingdom and United States retail stores in January.There were also a number of changes to management structures and Head Office functions.Our long serving Chief Executive Officer Maurice Prendergast stood down to become anon-executive director and handed over the reins to Neil Cowie. Since Neil became CEO hehas implemented a series of initiatives to build on the immense capability that exists within theCompany and drive improved financial results into the future. The team that Neil leads is asmotivated as ever and is determined to make <strong>Pumpkin</strong> <strong>Patch</strong> the company they all knowit can be.We also welcomed Rod Duke and Peter Schuyt as directors. Between the two of them they havea wide range of experience that will assist us deal with the current challenging retail environmentand execute a series of growth strategies across our local and international markets. At theupcoming <strong>annual</strong> shareholders meeting we will be saying goodbye to David Jackson who hasbeen a director since we listed on the stock exchange back in 2004. I would like to thankDavid for his dedication and service to the Company over the last 8 years and wish him wellfor the future.A major highlight for me in <strong>2012</strong> was the growth in our online sales and earnings. Over thelast financial year our online operation generated higher earnings than all of our New Zealandretail stores combined. This is an amazing achievement; a sign of the online capability we haveand the potential that exists for us online not only in our ‘home markets’ of Australia and NewZealand but also in our newer international online markets. We now sell <strong>Pumpkin</strong> <strong>Patch</strong> productonline in 8 markets around the world and during the year launched dedicated Charlie & Mewebsites in Australia and New Zealand.Earlier in the year we launched the <strong>Patch</strong> General Store, an extension of our existing websitesthrough which our customers can access a huge range of the everyday items parents needfor their children, from nappies through to bed linen. While many of the brands sold through<strong>Patch</strong> General Store are well known international brands we are excited about giving a numberof lesser known yet very exciting New Zealand brands exposure to our very large customerdatabase. <strong>Patch</strong> General Store is yet another example of us using our existing online andsupply chain capabilities to develop new business opportunities.If you haven’t already been on our websites I encourage you to take a look; we think we areahead of the pack in the online space and are proud of what we are doing. Most retailers arestruggling with setting up online operations and trying to come to terms with just how the onlinefuture will impact their traditional retail models. Instead we have proactively moved forward,embraced it, and started to leverage our well developed online and supply chain capabilitiesto drive significant increases in sales and earnings.It has also been exciting to see how we have increased the use of technology both online andat store level to come up with innovative new ways for our customers to shop with us. One of thelatest initiatives is called ‘click and collect’ which allows customers to buy online and arrange forpick up to be made via one of our stores. The customer reaction to ‘click and collect’ has welland truly exceeded our expectations which reinforces the need to constantly evolve the customershopping experience whether it be in store or online. We are working on a number of otherexciting things in the multi-channel area which we hope to roll out across 2013.Despite the currently challenging retail environment Neil and the team are looking to the futureand implementing strategies that the Board are confident will deliver our shareholders improvedreturns in the years to come. As Chairperson I look to the future with increasing confidence inthe direction the business is heading.The Annual Shareholders Meeting is being held in Auckland on Tuesday 20 November <strong>2012</strong>.I would like to personally invite you to attend the meeting to hear about the changes that haveoccurred over the last year but more importantly hear about the some of the initiatives we areputting in place.On behalf of the shareholders and the Board of Directors I would like to thank Neil and histeam for their hard work and the dedication they have shown during what has been a verytough year and for the effort I know they are currently putting in to developing strategiesfor the future.JANE FREEMANChairpersonJane Freeman09
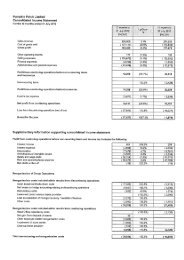
Group Turnover*(NZ$m)International*Sales 11% by regionInternational11%$323.4 $330.3$323.4 $330.3Group Turnover (NZ$m)Group Turnover (NZ$m)$310.4$291.5$310.4$291.5$323.4 $330.3$300.6Group Turnover (NZ$m)$300.6$310.4$291.5New Zealand20%New Zealand $300.620%International11%New Zealand20%Australia69%Australia69%FY08FY09 FY10 FY11 FY12*Turnover from continuing operationsFY08FY09 FY10 FY11 FY12*Sales from continuing operationsAustralia69%*Turnover from continuing operationsFY08FY09 FY10 FY11 FY12*Sales from continuing operations*Turnover from continuing operations*Sales from continuing operationsGroup NPAT *(NZ$m)Group NPAT(NZ$m)*Group NPAT(NZ$m)*$25.5$25.5Group NPAT(NZ$m)*$25.5$17.1$17.1$14.5$14.5$17.1$12.6$12.6$14.5$10.1$10.1$12.6$10.1FY08FY09 FY10 FY11 FY12*Before non-recurring items and reorganisation costsFY08*Before non-recurring items and reorganisation costsFY09 FY10 FY11 FY12FY08FY09 FY10 FY11 FY12*Before non-recurring items and reorganisation costs11
chief executive officer’s <strong>report</strong>With the challenging trading conditions we encountered in <strong>2012</strong>, weembarked upon some significant changes across the business. While thesechanges impacted a large number of our team members and required significantreorganisation costs to be recognised the changes were necessary for us to refocusourselves on our core markets, our core strengths, and to focus on developinginitiatives that will deliver improved financial results for shareholders into the future.Despite the challenging environment our Australian sales were up 4% andNew Zealand sales were up 3% driven by very strong online sales growth andpositive sales growth from our retail stores. We encountered increased promotionalactivity and higher product costs, mostly cotton related, and as a result gross marginswere impacted. However later in the year margins improved due to lower productcosts and higher import exchange rates.A major highlight for me in <strong>2012</strong> was the growth seen from our global onlinebusiness. Sales exceeded $30m and earnings exceeded the EBIT generated by allof our New Zealand retail stores combined. This is a major milestone and a sign ofthe growth potential and scalability of our online model. Our online sales in Australiaare the equivalent of around 11% of our retail sales which is approximately twice thatof the average Australian retailer.One of our key focus areas is the development of multi-channel strategies. Themerging of the traditional retail and online models is only just beginning howeverwe believe we are ahead of the pack and will retain that position as we continue toinvest in technology and supply chain capability. These multi-channel strategies arevery much aligned with the changing consumer demands and will ultimately lead tous servicing our customers better.While we are expecting increased revenue from most International markets in localcurrency terms in the coming year the continued high NZ dollar will negate much ofthis growth. We are currently looking at a number of new international franchise andonline opportunities for both <strong>Pumpkin</strong> <strong>Patch</strong> and Charlie & Me brands however anynew markets will take time to generate noticeable earnings.We are becoming a true multi-channel operator. Having a strong Australasian retailpresence, a rapidly growing international online operation, and the opportunitiesfor our international wholesale/franchise business model gives us so much flexibilitywhen looking at growth options. Couple this with the dual brand <strong>Pumpkin</strong> <strong>Patch</strong>/Charlie & Me strategy and you open up a lot more opportunities.During <strong>2012</strong> we managed inventory a lot better and we were disciplined withcapital expenditure. As a result inventory was considerably lower than last year at$61m and net bank debt is also lower at $55m. With better trading performancesin 2013, good control over inventory, costs, and capital expenditure we areforecasting bank debt to further reduce over the coming year.Neil Cowie13
Australia<strong>2012</strong> 2011Turnover NZ $’000 207,630 198,786 4.4%EBIT NZ $’000 34,953 34,874 0.2%16.8% 17.5%Stores<strong>Pumpkin</strong> <strong>Patch</strong> 105 107Outlet 15 17Charlie & me 9 8129 132Online trading websites<strong>Pumpkin</strong> <strong>Patch</strong> ✔ ✔Charlie & me✔Wholesale ‘doors’ 30 33Although trading conditions in Australia were challenging total sales were up 4.4%to $207.6m, driven by strong growth in online sales and higher retail sales.The market continued to be characterised by higher than normal levels of promotionalactivity which impacted gross margins. When coupled with higher product costs,especially in 1H12, overall segment margins fell below FY11 levels. However ourmargins did improve in 2H12 with lower products costs and an improving averageimport exchange rate.Despite the lower margins and the challenging trading conditions segment EBITincreased 0.2% to $35.0m.At year end we had 129 Company operated stores in Australia with our productsold through another 30 wholesale partner ‘doors’. During the year we launched adedicated Charlie & Me website adding to the online presence we have with the<strong>Pumpkin</strong> <strong>Patch</strong> website. The response to Charlie & Me online has been very strong.We have had considerable success at reducing rent costs by taking a very disciplinedapproach to negotiating more appropriate lease terms during lease renewal periods.Should we be unable to negotiate suitable lease terms that better reflect current marketconditions we will close stores.Although we are expecting trading conditions in Australia to remain challenging across2013 our brand strength remains very strong and we are well positioned for whenthe market begins to recover. We continue to see long term online and retail growthopportunities in the market for both <strong>Pumpkin</strong> <strong>Patch</strong> and Charlie & Me brands. The multichannelinitiatives that are in development will bring an exciting new dimension to ouronline and retail models which we believe our customers will embrace.New Zealand<strong>2012</strong> 2011Turnover NZ $’000 59,246 57,529 3.0%EBIT NZ $’000 9,566 10,705 (10.6%)16.1% 18.6%Stores<strong>Pumpkin</strong> <strong>Patch</strong> 35 37Outlet 12 14Charlie & me 4 351 54Online trading websites<strong>Pumpkin</strong> <strong>Patch</strong> ✔ ✔Charlie & me✔While trading conditions across the year remained soft total New Zealand salesincreased 3.0% to $59.2m. This was mostly driven by higher online sales with asmaller increase coming from retail stores.As with Australia the market continued to be influenced by higher than normal levelsof promotional activity. This combined with higher product costs impacted marginswhich were down on last year. New Zealand also experienced improved marginsin 2H12 due to lower product costs and better import exchange rates.At year end we had 51 stores open (<strong>Pumpkin</strong> <strong>Patch</strong> 47, Charlie & Me 4) anddedicated <strong>Pumpkin</strong> <strong>Patch</strong> and Charlie & Me websites operating.We are also expecting New Zealand trading conditions to remain challenging in thenear term. However like Australia we see retail and online growth opportunities forboth <strong>Pumpkin</strong> <strong>Patch</strong> and Charlie & Me in New Zealand including a number of multichannelinitiatives in development.15
INTERNATIONAL<strong>2012</strong> 2011Turnover NZ $’000 33,733 35,205 (4.2%)EBIT NZ $’000 6,210 6,625 (6.3%)18.4% 18.8%Wholesale/franchise:Markets 18 18‘Doors’ 339 334Online markets being serviced via6 3company owned sitesStores - Ireland 3 3Total sales for the year were $33.7m, down 4.2% on last year. While sales in mostwholesale markets increased in local currency terms the continued high NZ dollarexchange rate impacted the translation of international sales. Strong sales growth wasseen across all online markets.Margins were impacted by higher product costs and the high NZ dollar exportexchange rate. Online margins were impacted by short term stock clearancepromotions that were run in the United States and United Kingdom while the retailstores in those markets were being closed.The International segment currently consists of 3 retail stores in Ireland and Companyoperated websites selling product in 6 markets, with product also being sold through339 partner ‘doors’ across 18 markets.In the first half of FY13 we will deliver the first shipments of <strong>Pumpkin</strong> <strong>Patch</strong> to Mexicoand Charlie & Me to the Middle East. These new markets offer some excitingpossibilities for us however they will take some time to generate noticeable earnings.We are currently exploring a number of new markets for both brands includingfranchise and online opportunities.Central Support FunctionsWe have directed a lot of effort over the last 18 months to realigning our centralsupport overheads to better match the current environment and our future strategicdirection. Excluding reorganisation costs and foreign exchange losses, actualunderlying central support overheads were down $5.1m on last year. We aredetermined to keep overhead cost structures at appropriate levels as the businessgrows into the future.17
other financial informationReorganisation CostsFull recognition was made for all expected costs relating to the closure of the UnitedKingdom and United States retail business units and the reorganisation of head officefunctions across FY12.An impairment and onerous lease charge of $1.5m was made in relation to 6 marginalAustralian stores which are underperforming and have upcoming lease renewals.Should appropriate lease reductions not be negotiated with landlords the stores willbe closed.Total reorganisation costs recognised in FY12 were $39.8m before tax of which$34.3m are non-cash in nature.Cash Flows and Balance SheetNet bank debt at July was $54.7m down 10% on last year. Based on current tradingconditions and the continued control over working capital, overheads, and capitalexpenditure bank debt is expected to further reduce over the coming year.At the end of July we had $100m of total available bank facilities in place. We havecommenced the scheduled <strong>annual</strong> facility review and are expecting to soon have inplace funding facilities for another three years.Capital expenditure for the year totalled $7.8m considerably lower than last year(FY11: $17.1m) reflecting the lower number of new stores opened this year and thenew store mix moving towards the smaller and lower cost Charlie & Me stores.The international and online growth strategies are not expected to lead to anymaterial capital expenditure requirements in the foreseeable future.Inventory levels were 27% lower at $61.4m. Inventory holdings are well matched tocurrent trading conditions and maintaining that position is a key focus area for us inthe coming year.DividendWhile no dividends were paid for FY12 we will review dividend payments at thecompletion of 1H13.SummaryAlthough trading conditions across all markets were challenging in <strong>2012</strong> wegenerated sales growth across our core local and international markets while atthe same time undertaking a major reorganisation of our operations.The reorganisation means we are a much simpler and more agile business whichcan now focus on our core strengths such as product design and online capabilities,and start implementing longer term strategic initiatives that will deliver benefits forshareholders in years to come, and allow us and our shareholders to look moreconfidently into the future.I would like to thank the entire <strong>Pumpkin</strong> <strong>Patch</strong> team for their hard work and ongoingdedication to the future of our brands. I have been very impressed by the way the teamstood up to the challenges the markets through their way while at the same time theywere implementing a major reorganisation of our business. It has been a privilege tohave worked with them over the last year and I look forward with much excitement toseeing them take advantage of the international opportunities thatawait the business in the future.Neil CowieChief Executive Officer19
External Auditor IndependenceTo ensure the independence of the Company’s external auditor is maintained theBoard has agreed the external auditor should not provide any services not permittedunder IFAC (International Federation of Accountants) auditor independence regulations.The Audit and Risk Management Committee review services provided by the externalauditor to ensure the company complies with this policy.Risk ManagementThe Company recognises that in order to achieve its business plans and strategicgoals, there must be a thorough understanding across the Group of the risks thatmay affect the ability of the Group to achieve those plans and goals. Throughout allof its business operations the Group has in place processes and systems which aredesigned to identify, assess, monitor and manage risk.The Board has ultimate responsibility for internal control and compliance acrossthe Group.Accordingly, the Board manages risk in the following ways:- The Board of Directors has oversight of risk management initiatives, policiesand practices and is assisted in this regard by the Audit and Risk Committee inidentifying risks which may have a material impact on the Company’s business;- The Chief Executive Officer (CEO) and Senior Executives of the Group areresponsible for designing and implementing risk management and internal controlsystems which identify material risks that the Group faces as well as managing riskacross the Group, and are required to <strong>report</strong> to the Board through the CEO. Thisincludes the identification, assessment, reduction, management and monitoring ofrisk, as well as identifying any material changes to the Group’s risk profile.These are required to be <strong>report</strong>ed to the Board at regular intervals;- There is regular assessment by the Board of strategic risks affecting the Group’soperations and the establishment of controls to reduce their impact. This includesmaintaining all relevant registrations and approvals in relation to business operations.On a regular basis the Board also reviews the Group’s internal controls and riskmanagement practices to ensure that they are adequate and reflect the Group’srisk profile;- Risk assessments are conducted for all major work initiatives, where new projectsare undertaken;- There is periodic verification of risk controls at various levels across theGroup’s operations;- The Group has established a range of policies and procedures aimed at assistingin the management of risk across the Group’s operations;- The Board satisfies itself that adequate external insurance cover is in placeappropriate for the Group’s size and risk profile;- The Board satisfies itself that adequate Health, Safety and Environmental ProtectionPolicies and hazard assessments are in place and monitors performance;- The CEO and Chief Financial Officer also provide a declaration that the financialstatements of the Group present a true and fair view, in all material respects ofthe Group’s financial position and operating results. The CEO and Chief FinancialOfficer are able to make this declaration having regard to the Group’s sound systemof risk management and control.The Board considers that the corporate governance principles followed by the Groupdo not materially differ from the NZX Corporate Governance Best Practice Code.29
general disclosuresDirectors’ RemunerationIn November 2011, the Directors elected to reduce base Director fees by 33% inresponse to the difficult trading conditions and the overall financial performance of theCompany. Remuneration of the Directors of the company and other benefits received,or due and receivable during the financial year was as follows:$000 $000Non Executive Directors <strong>2012</strong> 2011Jane Freeman (1) 113 128Rod Duke (2) 8 -Brent Impey 58 75David Jackson (3) 68 85Maurice Prendergast (4) 935 629Peter Schuyt (5) - -Sally Synnott 58 75Greg Muir (6) - 43(1)Includes fees for holding the position of Chair of the Board of Directors and Chair of the Remunerationand Nominations Committee during <strong>2012</strong>.(2)Rod Duke was appointed as a Director on 1 June <strong>2012</strong>.(3)Includes fees for holding the position of Chair of the Audit and Risk Committee.(4)Includes salary and other benefits received while Chief Executive Officer, payments to extinguishall employment contract obligations upon resigning from his executive role in December 2011 andbase Director fees since that time.(5)Peter Schuyt was appointed as a Director in August <strong>2012</strong> and did not receive any remunerationduring financial year to 31 July <strong>2012</strong>.(6)Greg Muir ceased being a Director in November 2010 and did not receive any fees from that date.Directors shareholdings31 July <strong>2012</strong> 31 July 2011Jane FreemanBeneficially or directly owned 11,284 11,284Rod DukeBeneficially or directly owned 16,674,086 16,674,086Brent ImpeyBeneficially or directly owned 4,000 4,000David JacksonBeneficially or directly owned 50,000 50,000Maurice PrendergastBeneficially or jointly owned 11,070,000 11,070,000Employee Share Entitlements (1) - 565,000Not beneficially owned (2) 1,186,569 722,940Peter SchuytBeneficially or directly owned - -Sally SynnottBeneficially or directly owned 9,506,800 9,506,800Not beneficially owned (2) 1,186,569 722,940(1)All rights to Share Options, Partly Paid shares and Long Term Incentive Shares previously heldby Maurice Prendergast were forfeited following his resignation as Chief Executive Officer inDecember 2011.(2)Maurice Prendergast and Sally Synnott are Directors and shareholders of <strong>Pumpkin</strong> <strong>Patch</strong> NomineesLimited which acts as Trustee for various employee share ownership plans.Share Dealings by DirectorsThe Board has received disclosures from the Directors named below of changes inrelevant interests in the Company during the period 1 August 2011 and 31 July <strong>2012</strong>.Particulars of such disclosures are:- 19 December 2011: 110,000 2007 share options, 375,000 Redeemable OrdinaryShares (Partly Paid Shares) and 80,000 Ordinary Shares (issued under the 2010 LTIshare scheme) were forfeited by Maurice Prendergast following his resignation asChief Executive Officer of the Company;- 8 June <strong>2012</strong>: Initial disclosure of Rod Duke’s beneficial shareholding of 16,674,086shares in the company.33
Disclosure of Interests by DirectorsTThe Directors named below have made a general disclosure of interest to the Boardand entered the interest in the Company’s interest register.Diversity DisclosureA summary of the Company’s current Director and Officer gender composition isprovided below:Jane FreemanDirector of:Direct shareholder in:Rod DukeBeneficial shareholder in:Brent ImpeyDirector of:Beneficial shareholder in:David JacksonBeneficial shareholder in:Maurice PrendergastDirector of:Beneficial and joint shareholder in:Sally SynnottBeneficial and direct shareholder in:Jane Freeman Consulting Limited<strong>Pumpkin</strong> <strong>Patch</strong> Limited<strong>Pumpkin</strong> <strong>Patch</strong> LimitedMan Cave Consulting Limited<strong>Pumpkin</strong> <strong>Patch</strong> Limited<strong>Pumpkin</strong> <strong>Patch</strong> LimitedEspies NZ Limited<strong>Pumpkin</strong> <strong>Patch</strong> LimitedEspies NZ Limited<strong>Pumpkin</strong> <strong>Patch</strong> LimitedMale Female TotalDirectors 52771%29%Officers 545%655%11Subsidiary Company Director DisclosuresIn relation to <strong>Pumpkin</strong> <strong>Patch</strong> Limited’s subsidiary companies, the Companies Act 1993 requires<strong>Pumpkin</strong> <strong>Patch</strong> Limited to disclose, during the year to 31 July <strong>2012</strong>, particulars of entries in theInterests Register, the total remuneration and value of other benefits paid to subsidiary directors, thenumber of employees who received more than $100,000 and donations made by the subsidiariesand amounts paid to auditors.No wholly owned subsidiary has directors who are not employees of the <strong>Pumpkin</strong> <strong>Patch</strong> group.No employee appointed as a Director of a subsidiary receives any remuneration or other benefits inhis/her role as a director. Audit fees are paid on behalf of the Group as disclosed in the financialstatements, as are any donations made.During the financial year, there were no entries in any <strong>Pumpkin</strong> <strong>Patch</strong> Limited subsidiary companyInterest Register pursuant to section 140 of the Companies Act 1993.Peter Schuyt has disclosed that he has no relevant interests requiring entryin the Company’s interest register.35
pumpkin patch limited & subsidiariesfinancial statementsfor the year ended 31 July <strong>2012</strong>41
pumpkin patch limited & subsidiaries financial statements for the year ended 31 july <strong>2012</strong>pumpkin patch limited & subsidiaries statements OF COMPREHENSIVE INCOME for the year ended 31 july <strong>2012</strong>INCOME STATEMENTS For the year ended 31 July <strong>2012</strong>Consolidated - Year ended Parent - Year ended31 July <strong>2012</strong> 31 July 2011 31 July <strong>2012</strong> 31 July 2011Notes $’000 $’000 $’000 $’000Sales revenue 300,609 291,520 - -Cost of goods sold (137,144) (113,844) - -Gross profit 163,465 177,676 - -Other operating income 177 192 29,886 110,941Expenses 3Selling expenses (123,673) (128,930) - -Finance expenses (3,765) (3,856) (2,062) (5,479)Administrative and general expenses (21,916) (22,872) (37,236) (43,615)Profit from continuing operations before14,288 22,210 (9,412) 61,847non‐recurring items and income taxNon‐recurring items 4 - (2,120) - (56,153)Profit/(loss) from continuing operations14,288 20,090 (9,412) 5,694before income taxIncome tax (expense)/credit 6 (3,871) (3,939) 1,663 122Net profit from continuing operations 10,417 16,151 (7,749) 5,816(Loss) from discontinuing operations (net of tax) 4 (37,944) (18,027) - -(Loss)/profit for the year (27,527) (1,876) (7,749) 5,816STATEMENTS OF COMPREHENSIVE INCOME For the year ended 31 July <strong>2012</strong>Consolidated - Year ended Parent - Year ended31 July <strong>2012</strong> 31 July 2011 31 July <strong>2012</strong> 31 July 2011Notes $’000 $’000 $’000 $’000(Loss)/profit for the year (27,527) (1,876) (7,749) 5,816Other comprehensive incomeExchange differences on translation of foreign 20 1,516 (6,825) - -operationsNet movement on cash flow hedges 29,368 (29,274) - -Mark to market (losses) on foreign currency- (9,079) - -portfolio restructureIncome tax relating to components of other(8,335) 11,012 - -comprehensive incomeOther comprehensive income for the year, net22,549 (34,166) - -of taxTotal comprehensive income for the year, net(4,978) (36,042) (7,749) 5,816of taxTotal comprehensive income for the year isattributable to:Equity holders of <strong>Pumpkin</strong> <strong>Patch</strong> Limited (4,978) (36,042) (7,749) 5,816(4,978) (36,042) (7,749) 5,816The above statements of comprehensive income should be read in conjunction with the accompanying notes.Earnings per share for profit attributableto shareholders: Cents CentsBasic earnings per share 22 (16.4) (1.1)Diluted earnings per share 22 (16.4) (1.1)Attributable to continuing operations:Basic earnings per share 22 6.2 9.7Diluted earnings per share 22 6.2 9.6Attributable to discontinuing operations:Basic earnings per share 22 (22.6) (10.8)Diluted earnings per share 22 (22.6) (10.8)The above income statements should be read in conjunction with the accompanying notes.Jane FreemanDavid JacksonChairpersonDirector27 September <strong>2012</strong> 27 September <strong>2012</strong>43
pumpkin patch limited & subsidiaries BALANCE SHEETS AS AT 31 july <strong>2012</strong>pumpkin patch limited & subsidiaries STATEMENTS OF CHANGES IN EQUITY for the year ended 31 july <strong>2012</strong>BALANCE SHEETS As at 31 July <strong>2012</strong>Consolidated at Parent at31 July <strong>2012</strong> 31 July 2011 31 July <strong>2012</strong> 31 July 2011Notes $’000 $’000 $’000 $’000ASSETSCurrent assetsCash and cash equivalents 7 5,343 10,030 36 25Trade and other receivables 8 18,386 18,196 242,235 248,731Derivative financial instruments 10 1,393 1,747 - -Inventories 9 61,448 84,375 - -Current tax receivables 6,361 4,882 3,390 3,666Total current assets 92,931 119,230 245,661 252,422Non current assetsProperty, plant and equipment 11 44,450 54,133 8,683 11,272Intangible assets 12 8,572 9,452 8,134 9,023Other financial assets 14 - - 13,522 4,091Trade and other receivables - 4 - 4Derivative financial instruments 10 394 4,224 - -Deferred tax assets 13 9,211 17,964 1,064 -Total non current assets 62,627 85,777 31,403 24,390Total assets 155,558 205,007 277,064 276,812LIABILITIESCurrent liabilitiesTrade and other payables 15 34,197 34,466 255,022 246,955Interest bearing liabilities 17 45,000 20,000 52 159Provisions 16 352 2,114 - -Derivative financial instruments 10 19,381 34,117 - -Deferred landlord contributions 1,349 2,365 - -Total current liabilities 100,279 93,062 255,074 247,114Non current liabilitiesInterest bearing liabilities 17 15,000 51,000 - -Provisions 16 159 789 - -Deferred landlord contributions 2,861 5,846 - -Derivative financial instruments 10 3,802 21,859 - -Deferred tax liabilities 13 - - - 635Total non current liabilities 21,822 79,494 - 635Total liabilities 122,101 172,556 255,074 247,749Net assets 33,457 32,451 21,990 29,063EQUITYShare capital 18 59,012 58,660 59,150 58,834Reserves 20 (12,090) (35,149) 1,629 6,391Retained earnings / (deficit) 20 (13,465) 8,940 (38,789) (36,162)Total equity 33,457 32,451 21,990 29,063The above statements of financial position should be read in conjunction with the accompanying notes.STATEMENTS OF CHANGES IN EQUITY For the year ended 31 July <strong>2012</strong>SharecapitalAttributable to equity holders of the CompanyReservesTreasurystockRetainedearningsTotalequityConsolidated Notes $’000 $’000 $’000 $’000 $’000Balance at 1 August 2010 58,431 (1,544) (33) 24,013 80,867Comprehensive incomeProfit or loss - - - (1,876) (1,876)Other comprehensive income - (34,166) - - (34,166)Total comprehensive income - (34,166) (1,876) (36,042)Movement in treasury stock - - (141) - (141)Shares issued 18 403 - - - 403Movement in share based20 - 561 - - 561payment reserveDividends paid 21 - - - (13,197) (13,197)403 561 (141) (13,197) (12,374)Balance at 31 July 2011 58,834 (35,149) (174) 8,940 32,451Balance at 1 August 2011 58,834 (35,149) (174) 8,940 32,451Comprehensive incomeProfit or loss - - - (27,527) (27,527)Other comprehensive income - 22,549 - - (22,549)Total comprehensive income - 22,549 - (27,527) (4,978)Movement in treasury stock - - 36 - 36Shares issued 18 316 - - - 316Movement in share based payments 20 - (4,762) - 5,122 360reserveRealisation of Foreign Currency Translation - - - - -Reserve on discontinued operations 20 - 5,272 - - 5,272Dividends paid 21 - - - - -Balance at 31 July <strong>2012</strong> 59,150 (12,090) (138) (13,465) 33,45745
pumpkin patch limited & subsidiaries STATEMENTS OF CHANGES IN EQUITY for the year ended 31 july <strong>2012</strong>pumpkin patch limited & subsidiaries statements OF CASH FLOWS for the year ended 31 july <strong>2012</strong>STATEMENTS OF CHANGES IN EQUITY continuedAttributable to equity holders of the CompanySharecapitalReservesRetainedearnings/(deficit)TotalequityParent Notes $’000 $’000 $’000 $’000Balance at 01 August 2010 58,431 5,830 (28,781) 35,480Comprehensive incomeProfit or loss - - 5,816 5,816Other comprehensive income - - - -Total comprehensive income - - 5,816 5,816Shares issued 18 403 - - 403Movement in share based payments reserve 20 - 561 - 561Dividends paid 21 - - (13,197) (13,197)403 561 (13,197) (12,233)Balance at 31 July 2011 58,834 6,391 (36,162) 29,063Balance at 1 August 2011 58,834 6,391 (36,162) 29,063Comprehensive income - - - -Profit or loss - - (7,749) (7,749)Other comprehensive income - - - -Total comprehensive income - - (7,749) (7,749)Shares issued 18 316 - - 316Movement in share based payments reserve 20 - (4,762) 5,122 360Dividends paid 21 - - - -Balance at 31 July <strong>2012</strong> 59,150 1,629 (38,789) 21,990The above statements of changes in equity should be read in conjunction with the accompanying notes.STATEMENTS OF CASH FLOWS For the year ended 31 July <strong>2012</strong>Cash flows from operating activitiesCash was provided from:Consolidated - Year endedParent - Year ended31 July 31 July 31 July 31 July<strong>2012</strong> 2011 <strong>2012</strong> 2011Notes $’000 $’000 $’000 $’000Receipts from customers 330,389 359,836 - -Interest received 696 259 - -Other operating income 3 177 192 - -Cash was applied to:Payments to suppliers and employees (307,495) (352,460) (40,025) (40,657)Interest paid (4,566) (4,033) (2) (2)Sales tax paid 3 (1,816) (2,389) 13 (704)Income taxes paid (3,232) (5,979) (1,100) 615Net cash inflow / (outflow) fromoperating activitiesCash flows from investing activitiesCash was applied to:24 14,153 (4,574) (41,114) (40,748)Purchase of property, plant and equipment (5,169) (12,793) (511) (878)Purchase of intangibles (2,671) (4,351) (2,480) (4,258)Net cash (outflow) from investing activities (7,840) (17,144) (2,991) (5,136)Cash flows from financing activitiesCash was provided from:Advances from group companies - - 44,223 58,944Proceeds of borrowings - 38,000 - 131Cash was applied to:Repayment of borrowings (11,000) - (107) -Dividends paid 21 - (13,197) - (13,197)Net cash (outflow) / inflow fromfinancing activitiesNet (decrease)/ increase in cash andcash equivalentsCash and cash equivalents at the beginningof the financial year(11,000) 24,803 44,116 45,878(4,687) 3,085 11 (6)10,030 6,945 25 31Cash and cash equivalents at end of year 7 5,343 10,030 36 25The above statements of cash flows should be read in conjunction with the accompanying notes.47
pumpkin patch limited & subsidiaries NOTES TO THE financial statements 31 july <strong>2012</strong>pumpkin patch limited & subsidiaries NOTES TO THE financial statements 31 july <strong>2012</strong>1 General information<strong>Pumpkin</strong> <strong>Patch</strong> Limited (“Company” or “Parent”) together with its subsidiaries (the “Group”)is a leading designer, marketer, retailer and wholesaler of children’s clothing.The Company is a limited liability company incorporated and domiciled in New Zealand.The address of its registered office is 439 East Tamaki Road, East Tamaki, Auckland,New Zealand.These financial statements were authorised for issue on 27 September <strong>2012</strong> by theBoard of Directors who have the power to amend after issue.2 Summary of significant accounting policiesThe principal accounting policies adopted in the preparation of the financial statements areset out below. These policies have been consistently applied to all the years presented,unless otherwise stated.(a) Basis of preparationThe financial statements have been prepared in accordance with New Zealand GenerallyAccepted Accounting Practice (NZ GAAP). They comply with New Zealand Equivalents toInternational Financial Reporting Standards (NZ IFRS), and other applicable New ZealandFinancial Reporting Standards, as appropriate for profit oriented entities. The financialstatements comply with International Financial Reporting Standards (IFRS).The principal accounting policies adopted in the preparation of the financial statements areset out below. The policies have been consistently applied to all the periods presented,unless otherwise stated.The <strong>report</strong>ing currency used in the preparation of these consolidated financial statementsis New Zealand dollars, rounded where necessary to the nearest thousand dollars.To ensure consistency with the current year, comparative figures have been restatedwhere appropriate.Entities <strong>report</strong>ingThe financial statements for the Group are the consolidated financial statements comprisingthe economic entity <strong>Pumpkin</strong> <strong>Patch</strong> Limited and its subsidiaries. The financial statements of theParent are for the company as a separate legal entity.Statutory baseThe Company is listed on the New Zealand Exchange (NZX). It is registered under theCompanies Act 1993 and is an issuer in terms of the Securities Act 1978. The financialstatements have been prepared in accordance with the requirements of the FinancialReporting Act 1993 and the Companies Act 1993.Historical cost conventionThese financial statements have been prepared under the historical cost convention, asmodified by the revaluation of financial assets and liabilities, including derivative instruments.Critical accounting estimatesThe Group makes estimates and assumptions concerning the future. The resulting accountingestimates will, by definition, seldom equal the related actual results. The estimates andassumptions that have a significant risk of causing a material adjustment to the carryingamounts of assets and liabilities within the next financial year are addressed below:(i) Impairment of Property, Plant and EquipmentThe Group undertakes to <strong>annual</strong>ly review its assets for indicators that their value is impaired.Testing for impairment involves judgements and estimates in relation to the recoverability ofasset values.(b) Principles of consolidation(i) SubsidiariesSubsidiaries are all entities (including special purpose entities) over which the Group has thepower to govern the financial and operating policies generally accompanying a shareholdingof more than one half of the voting rights. The existence and effect of potential voting rightsthat are currently exercisable or convertible are considered when assessing whether the groupcontrols another entity. Subsidiaries are fully consolidated from the date on which control istransferred to the group. They are de-consolidated from the date that control ceases.The acquisition method of accounting is used to account for business combinations by theGroup. The consideration transferred for the acquisition of a subsidiary is the fair values ofthe assets transferred, the liabilities incurred and the equity interests issued by the Group.The consideration transferred includes the fair value of any asset or liability resulting from acontingent consideration arrangement. Acquisition related costs are expensed as incurred.Identifiable assets acquired and liabilities and contingent liabilities assumed in a businesscombination are measured initially at their fair values at the acquisition date. On anacquisition by acquisition basis, the Group recognises any non controlling interest in theacquiree either at fair value or at the non controlling interest’s proportionate share of theacquiree’s net assets.The excess of the consideration transferred, the amount of any non controlling interest in theacquiree and the acquisition date fair value of any previous equity interest in the acquireeover the fair value of the Group’s share of the identifiable net assets acquired is recordedas goodwill. If this is less than the fair value of the net assets of the subsidiary acquired inthe case of a bargain purchase, the difference is recognised directly in the statement ofcomprehensive income.Inter-company transactions, balances and unrealised gains on transactions between groupcompanies are eliminated. Unrealised losses are also eliminated. Accounting policies ofsubsidiaries have been changed where necessary to ensure consistency with the policiesadopted by the Group.49
pumpkin patch limited & subsidiaries NOTES TO THE financial statements 31 july <strong>2012</strong>pumpkin patch limited & subsidiaries NOTES TO THE financial statements 31 july <strong>2012</strong>2 summary of significant accounting policies continued(c) Segment <strong>report</strong>ingAn operating segment is a component of an entity that engages in business activities whichearns revenue and incurs expenses on which the chief operating decision maker reviews theoperating results on a regular basis and makes decisions on resource allocation.The Group is organised into four operating segments, depicting the three geographicalregions the Group operates in and the centralised support function.(d) Foreign currency translation(i) Functional and presentation currencyItems included in the financial statements of each of the Group’s entities are measured usingthe currency of the primary economic environment in which the entity operates (‘the functionalcurrency’). The consolidated and parent financial statements are presented in New Zealanddollars, which is the Group’s presentation currency.(ii) Transactions and balancesForeign currency transactions are translated into the functional currency using the exchangerates prevailing at the dates of the transactions. Foreign exchange gains and losses resultingfrom the settlement of such transactions and from the translation at year end exchange rates ofmonetary assets and liabilities denominated in foreign currencies are recognised in the incomestatement, except when deferred in equity as qualifying cash flow hedges and qualifying netinvestment hedges.(iii) Foreign operationsThe results and balance sheets of foreign operations that have a functional currency differentfrom the presentation currency are translated into the presentation currency as follows:- assets and liabilities for each balance sheet presented are translated at the closing rate atthe date of that balance sheet;- income and expenses for each income statement are translated at average exchange rates(unless this is not a reasonable approximation of the cumulative effect of the rates prevailingon the transaction dates, in which case income and expenses are translated at the dates ofthe transactions); and- all resulting exchange differences are recognised as a separate component of equity.(e) Revenue recognitionRevenue comprises the fair value for the sale of goods and services, net of sales tax anddiscounts and after eliminating sales within the Group. Revenue is recognised as follows:(i) Sales of goods - retailSales of goods are recognised when a Group entity sells a product to the customer.Retail sales are usually in cash or by credit card.(ii) Sales of goods - wholesaleWholesale sales are recognised in accordance with the terms of sales when the title hastransferred and the benefits of ownership and risk pass to the customer. This is dependent oncustomer specific terms of trade.(iii) Interest incomeInterest income is recognised using the effective interest method.(iv) Dividend incomeDividend income is recognised when the right to receive payment is established.(f) Cost of goods soldCost of goods sold represent expenses associated with the design, purchase and all othercosts incurred in getting the inventory to the point of sale.(g) Income taxThe income tax expense or revenue for the period is the total of the current period’s taxableincome based on the income tax rate for each jurisdiction plus/minus any prior years’under/over provisions, plus/minus movements in the deferred tax balance except where themovement in deferred tax is attributable to a movement in reserves.Deferred tax assets and liabilities are recognised for temporary differences at the tax ratesexpected to apply when the assets are recovered or liabilities are settled, based on thosetax rates which are enacted or substantively enacted for each jurisdiction. No deferred taxasset or liability is recognised in relation to these temporary differences if they arose in atransaction, other than a business combination, that at the time of the transaction did not affecteither accounting profit or loss or taxable profit or loss.Deferred tax assets are recognised for deductible temporary differences and unused taxlosses only to the extent that is probable that future taxable amounts will be available to utilisethose temporary differences and losses.The income tax expense or revenue attributable to amounts recognised directly in equity arealso recognised directly in equity.(h) Goods and Services Tax (GST)The Income Statement has been prepared so that all components are stated exclusive of GST.All items in the balance sheet are stated net of GST, with the exception of receivables andpayables, which include GST invoiced.(i) Leases and Deferred Landlord ContributionsLeases in which a significant portion of the risks and rewards of ownership are retained bythe lessor are classified as operating leases. Payments made under operating leases arecharged to the Income Statement on a straight line basis over the period of the lease.51
pumpkin patch limited & subsidiaries NOTES TO THE financial statements 31 july <strong>2012</strong>pumpkin patch limited & subsidiaries NOTES TO THE financial statements 31 july <strong>2012</strong>2 summary of significant accounting policies continuedWhere a landlord makes a contribution to the initial setup cost of a store, the contributionis capitalised. The contribution is amortised on a straight line basis over the life of the leaseoffsetting the lease payments made.(j) Impairment of non financial assetsAssets that have an indefinite useful life are not subject to amortisation and are tested <strong>annual</strong>lyfor impairment. Assets that are subject to amortisation are reviewed for impairment wheneverevents or changes in circumstances indicate that the carrying amount may not be recoverable.An impairment loss is recognised for the amount by which the asset’s carrying amountexceeds its recoverable amount. The recoverable amount is the higher of an asset’s fairvalue less costs to sell and value in use. For the purposes of assessing impairment, assets aregrouped at the lowest levels for which there are separately identifiable cash flows.(k) Cash and cash equivalentsCash and cash equivalents includes cash on hand, deposits held at call with financialinstitutions, other short term, highly liquid investments with original maturities of three months orless that are readily convertible to known amounts of cash. Bank overdrafts are shown withininterest bearing liabilities in current liabilities on the balance sheet.(l) Trade receivablesTrade receivables are recognised initially at fair value and subsequently at amortised cost lessprovision for doubtful debts.Collectability of trade receivables is reviewed on an ongoing basis. Debts which areknown to be uncollectible are written off. A provision for doubtful receivables is establishedwhen there is objective evidence that the Group will not be able to collect all amounts dueaccording to the original terms of receivables. The amount of the provision is the differencebetween the asset’s carrying amount and the present value of estimated future cash flows.The amount of the provision is recognised in the Income Statement.Significant financial difficulties of the debtor, probability that the debtor will enter bankruptcyor financial reorganisation, and default or delinquency in payments are considered indicatorsthat the trade receivable is impaired.(m) InventoriesWork in progress and finished goods are stated at the lower of cost and net realisable value.Costs are assigned to individual items of inventory on the basis of weighted average costs,and includes expenditure incurred in acquiring the assets and bringing them to their existinglocation and condition. Net realisable value is the estimated selling price in the ordinarycourse of business.(n) DerivativesDerivatives are initially recognised at fair value on the date a derivative contract is entered intoand are subsequently re-measured to their fair value. The method of recognising the resultinggain or loss depends on whether the derivative is designated as a hedging instrument, and ifso, the nature of the item being hedged. The Group designates certain derivatives as either;(a) hedges of the fair value of recognised assets or liabilities or a firm commitment (fair valuehedge); or (b) hedges of highly probable forecast transactions (cash flow hedges).The Group documents at the inception of the transaction the <strong>relations</strong>hip between hedginginstruments and hedged items, as well as its risk management objective and strategy forundertaking various hedge transactions. The Group also documents its assessment, bothat hedge inception and on an ongoing basis, of whether the derivatives that are used inhedging transactions have been and will continue to be highly effective in offsetting changesin fair values or cash flows of hedged items.(i) Fair value hedgeChanges in the fair value of derivatives that are designated and qualify as fair value hedgesare recorded in the Income Statement, together with any changes in the fair value of thehedged asset or liability that are attributable to the hedged risk.(ii) Cash flow hedgeThe effective portion of changes in the fair value of derivatives that are designated andqualify as cash flow hedges is recognised in equity in the hedging reserve. The gain or lossrelating to the ineffective portion is recognised immediately in the income statement.Amounts accumulated in equity are recycled in the Income Statement in the periods when thehedged item will affect profit or loss (for instance when the forecast sale that is hedged takesplace). However, when the forecast transaction that is hedged results in the recognition ofa non financial asset (for example, inventory) or a non financial liability, the gains and lossespreviously deferred in equity are transferred from equity and included in the measurement ofthe initial cost or carrying amount of the asset or liability.When a hedging instrument expires, is sold or terminated, or when a hedge no longermeets the criteria for hedge accounting, any cumulative gain or loss existing in equity at thattime remains in equity and is recognised when the forecast transaction is ultimately recognisedin the Income Statement. When a forecast transaction is no longer expected to occur,the cumulative gain or loss that was <strong>report</strong>ed in equity is immediately transferred to theIncome Statement.(iii) Derivatives that do not qualify for hedge accountingCertain derivative instruments do not qualify for hedge accounting. Changes in the fairvalue of any derivative instrument that does not qualify for hedge accounting are recognisedimmediately in the Income Statement.53
pumpkin patch limited & subsidiaries NOTES TO THE financial statements 31 july <strong>2012</strong>pumpkin patch limited & subsidiaries NOTES TO THE financial statements 31 july <strong>2012</strong>2 summary of significant accounting policies continued(o) Financial assetsThe Group classifies its financial assets in the following categories: “financial assets at fairvalue through profit or loss” and “loans and receivables”. The classification depends onthe purpose for which the financial assets were acquired. Management determines theclassification of its investments at initial recognition.(i) Financial assets at fair value through profit or lossThis category has two sub categories: financial assets held for trading, and those designatedat fair value through profit or loss on initial recognition. A financial asset is classified in thiscategory if acquired principally for the purpose of selling in the short term. Derivatives arealso categorised as held for trading unless they are designated as hedges. Assets in thiscategory are classified as current assets if they are either held for trading or are expected tobe realised within 12 months of the balance sheet date.(ii) Loans and receivablesLoans and receivables are non derivative financial assets with fixed or determinable paymentsthat are not quoted in an active market. They are included in current assets, except for thosewith maturities greater than 12 months after the balance sheet date which are classified asnon current assets. Loans and receivables are included in receivables in the balance sheet(note 8).Financial assets carried at fair value through profit or loss are initially recognised at fairvalue, and transactions costs are expensed in the Income Statement. Loans and receivablesare initially recognised at fair value plus transaction costs, and are subsequently carried atamortised cost using the effective interest method. Financial assets are recognised on tradedates, being the date on which the Group commits to purchase or sell the asset. Financialassets are derecognised when the rights to receive cash flows from the financial asset haveexpired or have been transferred and the Group has transferred substantially all risk andrewards of ownership.(p) Fair value estimationThe fair value of financial assets and financial liabilities must be estimated for recognition andmeasurement or for disclosure purposes. The carrying value of cash and cash equivalents,trade receivables, trade payables, and short term liabilities is equivalent to their fair value dueto their short term nature.The fair value of forward exchange contracts is determined using forward exchange marketrates at the balance date. The Group assesses at each balance sheet date whether there isobjective evidence that a financial asset or a group of financial assets is impaired. Gains orlosses arising from changes in the fair value of the financial assets category are presented inthe Income Statement in the period in which they arise.(q) Property, plant and equipmentAll property, plant and equipment is stated at historical cost less depreciation and impairment.Historical cost includes expenditure that is directly attributable to the acquisition of the items.Subsequent costs are included in the asset’s carrying amount or recognised as a separateasset, as appropriate, only when it is probable that future economic benefits associated withthe item will flow to the Group and the cost of the item can be measured reliably. All repairsand maintenance are charged to the Income Statement during the financial period in whichthey are incurred.Land is not depreciated. Depreciation on other assets is calculated using the straight linemethod to allocate their costs, net of their residual values, over their estimated useful lives,as follows:‐ Shop fit out.........................................................................................5‐10 years‐ Office equipment (including furniture and fittings (F&F)).................................5‐10 years‐ Computer equipment (including point of sale equipment (POS))......................3‐5 years‐ Plant and machinery.............................................................................3‐7 years‐ Vehicles.............................................................................................4‐5 years‐ Leasehold improvements........................................................................6‐7 yearsThe assets’ residual values and useful lives are reviewed, and adjusted if appropriate, at eachbalance sheet date.An asset’s carrying amount is written down immediately to its recoverable amount if the asset’scarrying amount is greater than its estimated recoverable amount.Gains and losses on disposals are determined by comparing proceeds with carrying amount.These are included in the Income Statement.(r) Intangible assets(i) TrademarksTrademarks have a finite useful life and are carried at cost less accumulated amortisation andimpairment losses. Amortisation is calculated using the straight line method to allocate thecost of trademarks and licences over their estimated useful lives (three to five years).(ii) Software costsAcquired computer software licences are capitalised on the basis of the costs incurred toacquire and bring to use the specific software. These costs are amortised over their estimateduseful lives (three to five years).Costs associated with developing or maintaining computer software programmes arerecognised as an expense as incurred. Costs that are directly associated with the productionof identifiable and unique software products controlled by the Group, and that will probably55
pumpkin patch limited & subsidiaries NOTES TO THE financial statements 31 july <strong>2012</strong>pumpkin patch limited & subsidiaries NOTES TO THE financial statements 31 july <strong>2012</strong>2 summary of significant accounting policies continuedgenerate economic benefits exceeding costs beyond one year, are recognised as intangibleassets. Direct costs include the software development employee costs.Computer software development costs recognised as assets are amortised over theirestimated useful lives (three to five years).(s) Trade and other payablesTrade and other payables are initially recognised at fair value and subsequently atamortised costs.These amounts represent liabilities for goods and services provided to the Group priorto the end of financial year which are unpaid. The amounts are unsecured and areusually paid within 30 days of recognition.(t) BorrowingsBorrowings are initially recognised at fair value, net of transaction costs incurred. Borrowingsare subsequently measured at amortised cost. Any difference between the proceeds (net oftransaction costs) and the redemption amount is recognised in the Income Statement over theperiod of the borrowings using the effective interest method.Borrowings are classified as current liabilities unless the Group has an unconditionalright to defer settlement of the liability for at least 12 months after the balance sheet date.The classification of borrowings reflects the underlying bank facility agreement.(u) ProvisionsProvisions are recognised when the Group has a present legal or constructive obligation asa result of past events, it is probable that an outflow of resources will be required to settle theobligation, and the amount has been reliably estimated. Provisions are not recognised forfuture operating losses.(v) Employee benefits(i) Wages and salaries, <strong>annual</strong> leave and sick leaveLiabilities for wages and salaries, including non monetary benefits, <strong>annual</strong> leave andaccumulating sick leave expected to be settled within 12 months of the <strong>report</strong>ing date arerecognised in the provision for employee benefits in respect of employees’ services up to the<strong>report</strong>ing date and are measured at the amounts expected to be paid when the liabilities aresettled. Liabilities for non accumulating sick leave are recognised when the leave is taken andmeasured at the rates paid or payable.(ii) Long service leaveThe liability for long service leave is recognised in the provision for employee benefits andmeasured as the present value of expected future payments to be made in respect of servicesprovided by employees up to the <strong>report</strong>ing date. Consideration is given to experience ofemployee departures and periods of service.(iii) Employee share based paymentsThe Group operates an equity settled, share based compensation plan. The fair value ofthe instruments granted is recognised as an employee expense in the Income Statement witha corresponding increase in the share based payments reserve. The total amount to beexpensed over the vesting period is determined by reference to the fair value of the instrumentsgranted, excluding the impact of any non market vesting conditions (for example, profitabilityand sales growth targets). Non market vesting conditions are included in assumptions aboutthe number of instruments that are expected to become exercisable. At each balance sheetdate, the entity revises its estimates of the number of instruments that are expected to becomeexercisable. It recognises the impact of the revision of original estimates, if any, in the IncomeStatement, and a corresponding adjustment to equity over the remaining vesting period.When instruments are exercised the amount in the share based payment reserve relating tothose options, together with the exercise price paid by the employee, is transferred toshare capital.(w) Share capitalOrdinary shares are classified as capital.Incremental costs directly attributable to the issue of new shares or instruments are shown inequity as a deduction, net of tax, from the proceeds.Where any Group company purchases or controls the Company’s equity share capital(treasury stock), the consideration paid, including any directly attributable incremental costs(net of income taxes), is deducted from equity attributable to the Group’s equity holders untilthe shares are cancelled or reissued. Where such shares are subsequently reissued, anyconsideration received (net of any directly attributable incremental transaction costs and therelated income tax effects) is included in equity attributable to the Group’s equity holders.(x) DividendsProvision is made for the amount of any dividend declared on or before the end of thefinancial year but not distributed at balance date.(y) Earnings per shareBasic earnings per share is calculated by dividing the profit attributable to equity holders of thecompany, by the weighted average number of ordinary shares on issue during the year.Diluted earnings per share is calculated by dividing the profit by the weighted average numberof ordinary shares on issue during the year adjusted to include the potential dilutive effect as aresult of the issue of share options.57
pumpkin patch limited & subsidiaries NOTES TO THE financial statements 31 july <strong>2012</strong>pumpkin patch limited & subsidiaries NOTES TO THE financial statements 31 july <strong>2012</strong>2 summary of significant accounting policies continued(z) Statement of CashflowsThe following are definitions of the terms used in the Statement of Cash flows:i) Cash comprises cash and bank balances.ii) Investing activities are those activities relating to the acquisition, holding and disposal ofProperty, Plant and Equipment, Intangible assets and investments.iii) Financing activities are those activities which result in changes in the size and compositionof the capital structure of the Group. This includes both equity and debt not falling withinthe definition of cash. Dividends paid are included in financing activities.iv) Operating activities include all transactions and other events that are not investing orfinancing activities.- NZ IFRS 13 Fair Value Measurement (effective 1 January 2013). NZ IFRS 13 explainshow to measure fair value and aims to enhance fair value disclosures. The group has yetto determine which, if any, of its current measurement techniques will have to change as aresult of the new guidance. It is therefore not possible to state the impact, if any, of the newrules on any of the amounts recognised in the financial statements. However, application ofthe new standard will impact the type of information disclosed in the notes to the financialstatements. The group does not intend to adopt the new standard before its operative date.- NZ IAS 27 Separate Financial Statements (effective 1 January 2013). NZ IAS 27 isrenamed Separate Financial Statements and is now a standard dealing solely with separatefinancial statements. Application of this standard by the group and parent entity will notaffect any of the amounts recognised in the financial statements, but may impact the typeof information disclosed in relation to the parent’s investments in the separate parent entityfinancial statements.(AA) New and amended standards adopted by the GroupThere are no IFRS’s or IFRIC interpretations that are effective for the first time for the financialyear beginning on or after 1 August 2011 that would be expected to have a material impacton the Group.(ab) Standards, amendments and interpretations to existing standardsthat are not yet effectiveBelow is a list of new standards, amendments and interpretations to existing standards whichhave been published that are mandatory for the Group’s accounting periods beginning onor after 1 August <strong>2012</strong> or later periods but which the Group has not early adopted. Thestandards listed are expected to effect the Group but are not expected to have a materialimpact on the Group’s financial statements.- NZ IFRS 9 Financial Instruments (Mandatory for <strong>annual</strong> periods commencing on or after1 January 2015). It is the intention of the IASB to replace IAS 39 with IFRS 9. The first phaseof the implementation of IFRS 9 relates to the classification and measurement of financialassets and financial liabilities, including some hybrid contracts. Management have not yetascertained the impact which the implementation of this standard will have on the Groupfinancial statements nor assessed when it will be adopted.59
pumpkin patch limited & subsidiaries NOTES TO THE financial statements 31 july <strong>2012</strong>pumpkin patch limited & subsidiaries NOTES TO THE financial statements 31 july <strong>2012</strong>4 Reorganisation of Group Operations continued(d) Summary of discontinuing operationsUnited StatesRetailUnited KingdomRetailTotalDiscontinuedOperations$’000 $’000 $’000Year ended 31 July <strong>2012</strong>Total Revenue 8,872 21,320 30,192(Loss) from discontinued trading operations (2,205) (2,014) (4,219)Reorganisation (costs) /credits relating to1,647 (36,913) (35,266)discontinued operationsIncome tax credit relating to discontinued879 662 1,541operationsProfit /(loss) from discontinued operations 321 (38,265) (37,944)Operating cash flows from discontinued(2,205) (1,842) (4,047)operationsTotal assets - -Total non-current assets - - -Loss from discontinued operations before income- -tax includes the following specific expenses:Rental and operating lease expenses (868) (5,115) (5,983)Salaries and wages (2,233) (3,582) (5,815)Depreciation - (272) (272)Reorganisation costs relating to discontinued-operations:Asset write off costs (2,771) (14,609) (17,380)Net gains / (losses) on financial assets or301 (9,148) (8,847)liabilities designated as fair value through profitand loss relating to discontinuing operationsRedundancy costs (159) (676) (835)Gain / (loss) on realisation of Foreign Currency4,648 (9,920) (5,272)Translation ReserveOther Costs (372) (2,560) (2,932)1,647 (36,913) (35,266)(d) Summary of discontinuing operations continued(e) Summary of non recurring expensesUnited StatesRetailUnited KingdomRetailConsolidated - Year ended Parent - Year endedTotalDiscontinuedOperations$’000 $’000 $’000Year ended 31 July 2011Total Revenue 18,440 46,862 65,302(Loss) from discontinued trading operations (2,686) (1,680) (4,366)Reorganisation (costs) /credits relating to(7,291) (6,192) (13,483)discontinued operationsIncome tax credit / (expense) relating to519 (697) (178)discontinued operations(Loss) from discontinued operations (9,458) (8,569) (18,027)Operating cash flows from discontinued(2,686) (440) (3,126)operationsTotal assets 3,826 23,567 27,393Total non-current assets 313 5,621 5,934Loss from discontinued operations before incometax includes the following specific expenses:Rental and operating lease expenses (2,735) (13,867) (16,602)Salaries and wages (4,968) (10,306) (15,274)Depreciation - (1,133) (1,133)Reorganisation costs relating to discontinuedoperations:Asset impairment / write down costs (1,349) (3,863) (5,212)Net gains / (losses) on financial assets or(3,300) - (3,300)liabilities designated as fair value through profitand loss relating to discontinuing operationsRedundancy costs (574) - (574)Lease exit costs / onerous lease provision (667) (2,329) (2,996)Other Costs (1,401) - (1,401)(7,291) (6,192) (13,483)31 July 31 July 31 July 31 July<strong>2012</strong> 2011 <strong>2012</strong> 2011$’000 $'000 $'000 $'000Head Office RedundancycostsImpairment of investment insubsidiary- (2,120) - (2,055)- - - (54,098)- (2,120) - (56,153)63
pumpkin patch limited & subsidiaries NOTES TO THE financial statements 31 july <strong>2012</strong>pumpkin patch limited & subsidiaries NOTES TO THE financial statements 31 july <strong>2012</strong>9 InventoriesConsolidated at Parent at31 July <strong>2012</strong> 31 July 2011 31 July <strong>2012</strong> 31 July 2011$’000 $’000 $’000 $’000Finished Goods - at cost 61,448 84,375 - -Inventory provisions of $198,000 (2011: $181,000) have been provided for at year endfor stock obsolescence.10 Derivative financial instruments31 July <strong>2012</strong> 31 July 2011Assets Liabilities Assets LiabilitiesConsolidated at $’000 $’000 $’000 $’000CurrentForeign currency forward exchange contracts 1,391 (19,381) 1,747 (34,117)Interest rate swaps 2 - - -Non currentForeign currency forward exchange contracts 394 (3,785) 4,224 (21,859)Interest rate swaps - (17) - -1,787 (23,183) 5,971 (55,976)The above table shows the Group’s financial derivative holdings at year end.The Parent does not enter into any financial derivatives.The Group hedge accounts for all foreign exchange forward contracts and interestrate swaps, and all fair value movements in these contracts are recorded in a cashflow hedge reserve.Refer to note 2(n) for information on the calculation of fair values.69
pumpkin patch limited & subsidiaries NOTES TO THE financial statements 31 july <strong>2012</strong>pumpkin patch limited & subsidiaries NOTES TO THE financial statements 31 july <strong>2012</strong>11 Property, plant and equipmentLeaseholdimprovementsShop fitoutComputerequipmentand POSOfficeequipmentand F&FPlant andmachineryLandTotalConsolidated $’000 $’000 $’000 $’000Year ended 31 July <strong>2012</strong>Opening net book amount 71 32,476 5,179 11,820Exchange differences - (38) (1) (2)Additions - 2,678 179 1,723Disposals (2) (591) (92) (427)Abandonment of UK assets (10) (3,237) (87) (556)Impairment charge recognised in income- (1,020) - -statementDepreciation charge (16) (4,526) (708) (1,873)Closing net book amount 43 25,742 4,470 10,685At 31 July <strong>2012</strong>Cost 524 84,618 14,038 22,090Accumulated depreciation & impairment (481) (58,876) (9,568) (11,405)Net book amount 43 25,742 4,470 10,685At 1 August 2010Cost 1,406 112,286 8,851 23,615Accumulated depreciation (1,299) (79,257) (3,525) (13,851)Net book amount 107 33,029 5,326 9,764Year ended 31 July 2011Opening net book amount 107 33,029 5,326 9,764Exchange differences (2) (1,477) (16) 371Additions - 9,551 720 3,962Disposals - (285) (5) (18)Impairment charge recognised- (3,863) - -in profit and lossDepreciation charge (34) (4,479) (846) (2,259)Closing net book amount 71 32,476 5,179 11,820At 31 July 2011Cost 1,300 114,835 14,991 26,662Accumulated depreciation & impairment (1,229) (82,359) (9,812) (14,842)Net book amount 71 32,476 5,179 11,820$’000 $’000 $’0001,239 3,348 54,1331 - (40)260 - 4,840- (1,110) (2,222)- - (3,890)- - (1,020)(228) - (7,351)1,272 2,238 44,4506,614 2,238 130,122(5,342) - (85,672)1,272 2,238 44,4506,338 3,348 155,844(4,816) - (102,748)1,522 3,348 53,0961,522 3,348 53,096- - (1,124)- - 14,233(7) - (315)- - (3,863)(276) - (7,894)1,239 3,348 54,1336,559 3,348 167,695(5,320) - (113,562)1,239 3,348 54,13371
pumpkin patch limited & subsidiaries NOTES TO THE financial statements 31 july <strong>2012</strong>pumpkin patch limited & subsidiaries NOTES TO THE financial statements 31 july <strong>2012</strong>11 Property, plant and equipment continuedComputerequipmentand POSOfficeequipmentand F&FPlant andmachineryParent $’000 $’000 $’000 $’000 $’000Year ended 31 July <strong>2012</strong>Opening net book amount 4,434 2,477 1,013 3,348 11,272Additions 110 22 238 - 370Disposals (74) (210) - (1,110) (1,394)Depreciation charge (503) (840) (222) - (1,565)Closing net book amount 3,967 1,449 1,029 2,238 8,683At 31 July <strong>2012</strong>Cost 8,969 6,716 5,848 2,238 23,771Accumulated depreciation (5,002) (5,267) (4,819) - (15,088)Net book amount 3,967 1,449 1,029 2,238 8,683At 01 August 2010Cost 8,851 6,401 5,585 3,348 24,185Accumulated depreciation (4,248) (3,579) (4,332) - (12,159)Net book amount 4,603 2,822 1,253 3,348 12,026Year ended 31 July 2011Opening net book amount 4,603 2,822 1,253 3,348 12,026Additions 349 502 27 - 878Disposals - - - - -Depreciation charge (518) (847) (267) - (1,632)Closing net book amount 4,434 2,477 1,013 3,348 11,272At 31 July 2011Cost 9,201 6,904 5,589 3,348 25,042Accumulated depreciation (4,767) (4,427) (4,576) - (13,770)Net book amount 4,434 2,477 1,013 3,348 11,272LandTotal12 Intangible assetsTrademarks Software TotalConsolidated $’000 $’000 $’000Year ended 31 July <strong>2012</strong>Opening net book amount 451 9,001 9,452Additions 179 3,006 3,185Disposals - (514) (514)Amortisation charge (200) (3,351) (3,551)Closing net book amount 430 8,142 8,572At 31 July <strong>2012</strong>Cost 1,842 21,377 23,219Accumulated amortisation (1,412) (13,235) (14,647)Net book amount 430 8,142 8,572At 01 August 2010Cost 1,544 15,735 17,279Accumulated amortisation (980) (7,864) (8,844)Net book amount 564 7,871 8,435Year ended 31 July 2011Opening net book amount 564 7,871 8,435Additions 118 4,271 4,389Disposals - (38) (38)Amortisation charge (231) (3,103) (3,334)Closing net book amount 451 9,001 9,452At 31 July 2011Cost 1,663 19,945 21,608Accumulated amortisation (1,212) (10,944) (12,156)Net book amount 451 9,001 9,45273
pumpkin patch limited & subsidiaries NOTES TO THE financial statements 31 july <strong>2012</strong>pumpkin patch limited & subsidiaries NOTES TO THE financial statements 31 july <strong>2012</strong>12 Intangible assets continuedSoftwareTotalParent $’000 $’000Year ended 31 July <strong>2012</strong>Opening net book amount 9,023 9,023Additions 2,997 2,997Disposals (513) (513)Amortisation charge (3,373) (3,373)Closing net book amount 8,134 8,134At 31 July <strong>2012</strong>Cost 21,283 21,283Accumulated amortisation (13,149) (13,149)Net book amount 8,134 8,134At 01 August 2010Cost 15,597 15,597Accumulated amortisation (7,728) (7,728)Net book amount 7,869 7,869Year ended 31 July 2011Opening net book amount 7,869 7,869Additions 4,257 4,257Amortisation charge (3,103) (3,103)Closing net book amount 9,023 9,023At 31 July 2011Cost 19,869 19,869Accumulated amortisation (10,846) (10,846)Net book amount 9,023 9,02313 Deferred tax assets/ (liabilities)Consolidated at Parent at31 July<strong>2012</strong>31 July201131 July<strong>2012</strong>31 July2011$’000 $’000 $’000 $’000The balance comprises temporary differencesattributable to:Non deductible provisions 2,171 3,655 518 692Property, plant and equipment (1,324) (1,052) (1,056) (1,597)Trade and other receivables (33) (39) (35) -Derivatives 5,991 14,001 - -Other Items 2,406 1,399 1,637 270Total deferred tax assets 9,211 17,964 1,064 (635)Movements:Opening balance at 1 August 17,964 9,161 (635) (804)Credited (charged) to the income statement (2,086) (2,466) 305 (116)relating to continuing operations (note 6)Credited/(charged) to equity (Cash flow(8,335) 10,384 - -Hedge Reserve)Prior year adjustment 8 885 (18) 285Tax losses recognised 1,660 - 1,412 -Closing balance at 31 July 9,211 17,964 1,064 (635)Deferred income tax assets are recognised for provisions, financial derivatives and fixedassets to the extent that the realisation of the related tax benefit through future taxableprofit is deemed to be probable.The majority of the deferred income tax balances are expected to be settled in the next12 months.75
pumpkin patch limited & subsidiaries NOTES TO THE financial statements 31 july <strong>2012</strong>pumpkin patch limited & subsidiaries NOTES TO THE financial statements 31 july <strong>2012</strong>14 Investments in subsidiariesThe consolidated financial statements incorporate the assets, liabilities and results of thefollowing significant subsidiaries in accordance with the accounting policy described innote 2(b):Name of entity Principal Activity Country ofincorporationEquityholding<strong>2012</strong> 2011% %Torquay Enterprise Limited Investment company New Zealand 100 100<strong>Pumpkin</strong> <strong>Patch</strong> Originals Limited Clothing retailer and wholesaler New Zealand 100 100<strong>Pumpkin</strong> <strong>Patch</strong> (Australia) Pty Limited Holding/admin company Australia 100 100<strong>Pumpkin</strong> <strong>Patch</strong> Limited* Clothing retailer and wholesaler United Kingdom 100 100<strong>Pumpkin</strong> <strong>Patch</strong> Europe Brands Limited** Clothing wholesaler United Kingdom 100<strong>Pumpkin</strong> <strong>Patch</strong> LLC Clothing retailer United States 100 100<strong>Pumpkin</strong> <strong>Patch</strong> Wholesale LLC Clothing wholesaler United States 100 100<strong>Pumpkin</strong> <strong>Patch</strong> Direct Limited Clothing retailer New Zealand 100 100<strong>Pumpkin</strong> <strong>Patch</strong> Ireland Limited Clothing retailer Ireland 100 100*On 18th January <strong>2012</strong> financial year <strong>Pumpkin</strong> <strong>Patch</strong> Limited (UK) was placed into administration. As such the results andnet assets of the subsidiary have not been consolidated into the <strong>Pumpkin</strong> <strong>Patch</strong> Group since that date on the basis thatthe Group has no control over the company. Refer to note 4 for further details.**<strong>Pumpkin</strong> <strong>Patch</strong> Europe Brands Limited was incorporated during the <strong>2012</strong> financial year.All subsidiary entities have a balance date of 31 July and are audited byPricewaterhouseCoopers.15 Trade and other payablesConsolidated at Parent at31 July <strong>2012</strong> 31 July 2011 31 July <strong>2012</strong> 31 July 2011$’000 $’000 $’000 $’000Trade payables 14,944 11,898 379 180Amounts due to subsidiaries - - 251,890 243,047Sundry accruals 13,557 16,144 743 1,654Employee benefits 5,696 6,424 2,010 2,07434,197 34,466 255,022 246,955The carrying amounts of the Group’s and parent entity’s trade and other payables aredenominated in the following currencies:NZD 9,996 10,783 255,022 246,955USD 14,096 12,366 - -AUD 9,811 8,565 - -GBP - 2,654 - -EUR 294 98 - -34,197 34,466 255,022 246,955The fair value of trade and other payables approximates their carrying value.Parent at31 July <strong>2012</strong> 31 July 2011$’000 $’000Investment in subsidiaries 13,522 4,09177
pumpkin patch limited & subsidiaries NOTES TO THE financial statements 31 july <strong>2012</strong>pumpkin patch limited & subsidiaries NOTES TO THE financial statements 31 july <strong>2012</strong>16 ProvisionsConsolidated at Parent at31 July <strong>2012</strong> 31 July 2011 31 July <strong>2012</strong> 31 July 2011$’000 $’000 $’000 $’000Current ProvisionsRestructuring Provision - 574 - -Onerous Lease Provision 352 1,540 - -352 2,114 - -Non-Current Provisions - -Onerous Lease Provision 159 789 - -159 789 - -Restructuring ProvisionFollowing the announcement on 15th June 2011, the Company implemented a staggeredstore closure plan which resulted in the 20 remaining United States stores closing by 21stJanuary <strong>2012</strong>. A provision of $574,000, based on forecast redundancy costs expected tobe incurred over the closure period, was recognised at the end of the 2011 financial year.The provision has been fully utilised during the <strong>2012</strong> financial year and no further associatedcosts are anticipated.Onerous Lease ProvisionUnder NZ IAS 37 (Provisions, Contingent Liabilities and Contingent Assets) management arerequired to recognise a provision for any onerous contracts. The standard defines an onerouscontract as a contract in which the unavoidable costs of meeting the obligations under thecontract exceed the economic benefits expected to be received under it.The value of the provision represents the lesser of the discounted future lease payments orthe estimated costs to exit the lease. The stores are deemed to be onerous on the basis thatthe forecast future profit of the stores was not sufficient to cover the contracted costs ofleasing the store.The onerous lease provision held at the beginning of the year related to leases heldfor stores in the United Kingdom. This provision was abandoned by the group when theUnited Kingdom subsidiary was placed into administration on 19th January <strong>2012</strong>.During the <strong>2012</strong> financial year a provision of $512,000 was recognised for leases relatingto Australian stores identified as being onerous.17 Interest bearing liabilitiesConsolidated at Parent at31 July <strong>2012</strong> 31 July 2011 31 July <strong>2012</strong> 31 July 2011$’000 $’000 $’000 $’000Current interest bearing liabilitiesBank overdrafts - - 52 159Bank loans 45,000 20,000 - -Total current interest bearing45,000 20,000 52 159liabilitiesNon current interest bearingliabilitiesBank loans 15,000 51,000 - -Total non current interest bearing 15,000 51,000 - -liabilitiesTotal interest bearing borrowings 60,000 71,000 52 159The bank loans are provided under the terms of an ANZ National Bank Limited RevolvingAdvances Facility Agreement dated 24 June 2009. The bank facilities outlined in thisagreement expire in December 2013. The <strong>annual</strong> review of these facilities is scheduledfor October <strong>2012</strong> and the directors are expecting that the tenure of the facilities will beextended for periods between two and three years.The Group draws down on its bank facility as required via short term loans which arerequired to be disclosed under current liabilities for external financial <strong>report</strong>ing purposes.These borrowings have been aged in accordance with the repayment terms of the facilities.At year end the weighted average interest rate is 3.97% (2011: 3.60%).As at 31 July <strong>2012</strong>, the Group had $42,000,000 of unused lines of credit (2011:$35,000,000).Fair valueThe fair value of interest bearing liabilities approximates their carrying value.SecurityThe Company has guaranteed, together with subsidiary companies, the indebtednessof <strong>Pumpkin</strong> <strong>Patch</strong> Limited and subsidiaries at 31 July <strong>2012</strong>, together with, in all cases,interest thereon under a cross guarantee deed dated 18 April 1996 and a guarantee andindemnity dated 11 July 2005. At 31 July <strong>2012</strong> the total indebtedness guaranteed by thedeed amounted to $58,360,000 (2011: $68,668,000).Included in this are other guarantees held by the ANZ National Bank Limited of:- Rent guarantees to certain landlords amount to $2,438,000 (2011: $2,720,000);- Guarantees provided to the UK Customs Department, amounting to $820,000 (2011:$787,000); &- A guarantee of $75,000 (2011:$75,000) to the NZX.79
pumpkin patch limited & subsidiaries NOTES TO THE financial statements 31 july <strong>2012</strong>pumpkin patch limited & subsidiaries NOTES TO THE financial statements 31 july <strong>2012</strong>18 Share CapitalConsolidated Parent31 July <strong>2012</strong> 31 July 2011 31 July <strong>2012</strong> 31 July 2011$’000 $’000 $’000 $’000Opening balance of issued and paid 58,834 58,431 58,834 58,431up capitalIssues of ordinary shares during the year 316 403 316 403Shares held as Treasury stock (138) (174) - -59,012 58,660 59,150 58,83418 share CapitaL continued(d) Partly Paid SharesAs at 31 July <strong>2012</strong> there were 1,865,000 (2011: 2,335,000) partly paid shares on issue.Partly paid redeemable shares are offered to selected senior executives at market value, whoare initially required to pay 1 cent per share to participate in the scheme. Partly paid sharesare held by a Trust for the benefit of the employees until they are fully paid. The trustee willexercise voting rights, and vote as directed by the Board, whilst the shares are held by theTrust. Employees are entitled to participate in any dividend pro rata to the extent the shareis paid up. Legal title of the shares is not transferred to the participating employees until theshares are fully paid. Employees can request shares to be transferred by the holder threeyears after the date of issue, and lapse after five years if not exercised, as long as the marketprice of the ordinary shares is equal or greater than the benchmark performance targetspecified by the Board.Opening balance of ordinary shares issuedEmployee share scheme issuesClosing balance of ordinary shares issued31 July <strong>2012</strong> 31 July 2011Shares Shares167,786,408 166,814,799500,000 971,609168,286,408 167,786,408(a) Ordinary sharesAs at 31 July <strong>2012</strong> there were 168,286,408 ordinary shares on issue (2011: 167,786,408).All ordinary shares are fully paid and rank equally with one vote attaching to each share.(b) Treasury stockAs at 31 July <strong>2012</strong> there were 406,295 shares (2011: 135,389) which have beenissued under the DF7 (Income Tax Act 1994) Scheme but at balance date have not beenallocated to employees. The shares are held in trust by <strong>Pumpkin</strong> <strong>Patch</strong> Nominees Limited.(c) Employee share scheme<strong>Pumpkin</strong> <strong>Patch</strong> Nominees Limited acts as a Trustee for the Group’s employee sharepurchase plans. The Group advanced the Trustee an interest free loan to enable it topurchase the shares issued to it for the plans. The Group has agreed that the Trustee is,in turn, entitled to allocate a portion of that loan to individual employees to assist them topurchase shares under the plans.At regular intervals the Trustee offers shares to those permanent employees of the Companywith in excess of six months continuous service. The shares are offered at a discount tomarket price. Employees purchasing shares are provided financial assistance on an interestfree basis, repayable in regular instalments. Dividends paid on allocated shares during thequalifying period are paid to employees.81
pumpkin patch limited & subsidiaries NOTES TO THE financial statements 31 july <strong>2012</strong>pumpkin patch limited & subsidiaries NOTES TO THE financial statements 31 july <strong>2012</strong>19 Share-based paymentsEmployee Option PlanDuring the financial year the Company issued no new share options (2011: nil).The Company has recognised a compensatory expense in the income statementof $14,000 (2011: $51,000).Set out below are summaries of options granted under the plan:GrantDateExpirydateExercise priceBalance atstart of theyearExpired/Lapsed duringthe yearBalanceat end of theyearExercisableat end of theyear000s 000s 000s $000June 2007 9 June <strong>2012</strong> 3.33 1,453 (1,453) - -June 2008 9 June 2013 1.59 637 (119) 518 824June 2009 9 June 2014 1.30 698 (121) 577 750Total 2,788 (1,693) 1,095 1,574Weighted average exercise price 2.42 3.06 1.4419 Share based payments continuedLong Term Incentive Employee Share SchemeThe shares issued under this scheme are held in Trust by <strong>Pumpkin</strong> <strong>Patch</strong> Nominees Limitedfor a vesting period of three years from the issue date. At the end of the vesting period,subject to the participants still being employed by the Group, the Company will issuea bonus to the participants to the value of their interest free loan, grossed up for eachparticipants personal income marginal tax rate. The bonus issued can only be used by theparticipants to repay their interest free loan.During the current financial year the Company issued no new Long Term Incentive (LTI)shares (2011: 701,609 shares). The Company has recognised a compensatory expense inthe income statement of $335,000 (2011: $408,000).OpeningBalanceIssuedduringthe yearLapsedduringthe yearClosingBalance2010 LTI shares issued on 23 November 2010 atan issue price of $1.86 661,895 - (185,754) 476,141Partly Paid Share SchemeDuring the financial year the Company issued no new partly paid redeemable shares(2011: nil). The Company has recognised a compensatory expense in the IncomeStatement of $11,000 (2011: $102,000).Set out below are summaries of options granted under the plan:GrantDateExpirydateExercise priceBalance atstart of theyearExpired/Lapsed duringthe yearBalanceat end of theyearExercisableat end of theyear000s 000s 000s $000June 2008 23 June 2013 1.59 1,100 (155) 945 1,503June 2009 23 June 2014 1.30 1,235 (315) 920 1,196Total 2,335 (470) 1,865 2,699Weighted average exercise price 1.44 1.40 1.4583
pumpkin patch limited & subsidiaries NOTES TO THE financial statements 31 july <strong>2012</strong>pumpkin patch limited & subsidiaries NOTES TO THE financial statements 31 july <strong>2012</strong>20 Reserves and retained earnings(a) ReservesConsolidated Parent31 July <strong>2012</strong> 31 July 2011 31 July <strong>2012</strong> 31 July 2011$’000 $’000 $’000 $’000Hedging reserve - cash flow hedges (12,594) (33,627) - -Share based payments reserve 1,629 6,391 1,629 6,391Foreign currency translation reserve (1,125) (7,913) - -Hedging reserve cash flow hedges(12,090) (35,149) 1,629 6,391Balance 1 August (33,627) (12,642) - -Revaluation - gross (2,784) (39,974) - -Deferred tax (8,335) 8,288 - -Transfer to net profit - gross 9,368 (4,836) - -Transfer to inventory - gross 22,784 15,537 - -Balance 31 July (12,594) (33,627) - -Share based payments reserveBalance 1 August 6,391 5,830 6,391 5,830Share based payment expense 360 561 367 572Transfer from Group company - - (7) (11)Transfer to retained earnings (5,122) - (5,122) -Balance 31 July 1,629 6,391 1,629 6,391Foreign currency translation reserveBalance 1 August (7,913) (1,088) - -Realisation of foreign currency translation reserve 5,272 - - -on discontinued operationsTranslation differences arising during the year 1,516 (6,825) - -Balance 31 July (1,125) (7,913) - -(i) Hedging reserve - cash flow hedgesThe hedging reserve is used to record gains or losses on a hedging instrument in a cash flowhedge that are recognised directly in equity, as described in note 2(n). Amounts are recognisedin the Income Statement when the associated hedged transaction affects the Income Statement.(ii) Share based payments reserveThe share based payments reserve is used to recognise the fair value of instruments issuedbut not exercised.iii) Foreign currency translation reserveExchange differences arising on translation of the foreign controlled entities are taken to theforeign currency translation reserve, as described in note 2(d). The reserve is recognised inthe Income Statement when the net investment is disposed of.20 Reserves and retained earnings continued(b) Retained earnings/ (deficit)Consolidated at Parent at31 July <strong>2012</strong> 31 July 2011 31 July <strong>2012</strong> 31 July 2011$’000 $’000 $’000 $’000Balance 1 August 8,940 24,013 (36,162) (28,781)Net profit/(loss) for the year (27,527) (1,876) (7,749) 5,816Dividends - (13,197) - (13,197)Transfer from share based paymentsreserve 5,122 - 5,122 -Balance 31 July (13,465) 8,940 (38,789) (36,162)21 DividendsInterim dividend for the period ended31 January 2011Final dividend for the period ended31 July 2010Consolidated and Parent - Year ended31 July <strong>2012</strong> 31 July 2011 31 July <strong>2012</strong> 31 July 2011Cents pershareCents pershare $’000 $’000- 3.00 - 5,033- 5.00 - 8,164Total dividends provided for or paid - 8.00 - 13,197Supplementary dividends of $nil (2011: $387,000) were paid to shareholders not tax residentin New Zealand for which the Group received a foreign <strong>investor</strong> tax credit entitlement.85
pumpkin patch limited & subsidiaries NOTES TO THE financial statements 31 july <strong>2012</strong>pumpkin patch limited & subsidiaries NOTES TO THE financial statements 31 july <strong>2012</strong>22 Earnings per share(a) Basic earnings per shareConsolidated -Year ended31 July <strong>2012</strong> 31 July 2011(i) Group(Loss) attributable to the ordinary equity holders of the company($'000) (27,527) (1,876)Basic earnings per share (cents) (16.4) (1.1)Diluted earnings per share (cents) (16.4) (1.1)(ii) Continuing operationsProfit from continuing operations attributable to the ordinary equityholders of the company ($'000) 10,417 16,151Basic earnings per share (cents) 6.2 9.7Diluted earnings per share (cents) 6.2 9.6(iii) Discontinuing operations(Loss) from discontinued operations attributable to the ordinary equityholders of the company ($'000) (37,944) (18,027)Basic earnings per share (cents) (22.6) (10.8)Diluted earnings per share (cents) (22.6) (10.8)Basic earnings per share is calculated by dividing the profit by the weighted average numberof ordinary shares on issue during the year, 168,036,000 shares (2011: 167,786,000 shares).Diluted earnings per shares is calculated by dividing the profit by the weighted averagenumber of ordinary shares on issue during the year adjusted to assume conversion of dilutivepotential of ordinary shares as a result of the issue of share options, 168,036,000 shares(2011: 167,650,000 shares). Where the market price is lower that the exercise priceof the option, there is no effect on diluted earnings per share.23 Related party transactions(a) SubsidiariesInterests in subsidiaries are set out in note 14.During the year the Company advanced and repaid loans to its subsidiaries by wayof internal current accounts. In presenting the financial statements of the Group, theeffect of transactions and balances between fellow subsidiaries and those with theparent have been eliminated. All transactions with related parties were in the normalcourse of business and provided on commercial terms.Material transactions between the Company and its subsidiaries were:The Company incurs logistics and group administration and management costs.These costs are recharged to subsidiaries in the form of management fees. Subsidiarycompanies account for these costs based on the functional nature of the expenses.Management fees charged by the Company to the subsidiaries during the financialyear were $29,710,000 (2011: $45,703,000).Interest charges of $15,721,000 (2011: $9,502,000). Inter group loans are repayableon demand and attract an interest rate equivalent to that of the LIBOR rate plus 3.25%(2011: 3.25%).Dividends of $nil were received by the Company from Torquay Enterprises Limitedduring the financial year (2011: $65,046,000)Refer also to note 17 for the related party guarantees.(b) Other transactions with key managementor entities related to themIn addition the Group undertook transactions with Directors and their related interestsas detailed below:The Group has made purchases of shop fixtures and fittings from Espies Shopfittersduring the year of $629,000 (2011: $4,624,000). Espies Shopfitters is 59.6% (2011:59.6%) beneficially owned by Kezza Family Trust a shareholder of <strong>Pumpkin</strong> <strong>Patch</strong>Limited. Kezza Family Trust is associated with Maurice Prendergast, a Director in<strong>Pumpkin</strong> <strong>Patch</strong> Limited. The balance owed to Espies Shopfitters at 31 July <strong>2012</strong>was $nil (2011: $56,000).87
pumpkin patch limited & subsidiaries NOTES TO THE financial statements 31 july <strong>2012</strong>pumpkin patch limited & subsidiaries NOTES TO THE financial statements 31 july <strong>2012</strong>23 Related party transactions continued(c) Key management and Director compensationKey management personnel compensation for the years ended 31 July <strong>2012</strong> and 31July 2011 is set out below. The key management personnel comprise certain members ofthe executive team (including both executive and non executive directors) who have thegreatest authority for the strategic direction and management of the company.The amounts disclosed below include amounts paid to personnel who held keymanagement positions during the year.DirectorsfeesSalaries andother shortterm employeebenefitsCashbasedincentiveissuedFair Valueof shareinstrumentsissuedTotal$’000 $’000 $’000 $’000 $’000<strong>2012</strong> 323 2,593 78 - 2,9942011 406 2,059 331 738 3,534(d) Balances outstanding between the Company and its subsidiariesParent at31 July <strong>2012</strong> 31 July 2011$’000 $’000Amounts due from subsidiaries 238,995 247,603Amounts due to subsidiaries (251,890) (243,047)(12,895) 4,55624 Reconciliation of profit after income tax to netcash inflow from operating activitiesConsolidated - Year ended Parent - Year ended31 July<strong>2012</strong>31 July201131 July<strong>2012</strong>31 July2011$’000 $’000 $’000 $’000(Loss) / profit after tax for the year (27,527) (1,876) (7,749) 5,816Add (deduct) non-cash itemsDepreciation 7,365 7,894 1,575 1,632Amortisation of intangibles 3,551 3,334 3,373 3,103Impairment charge 1,020 3,863 4 -Share based payments expense 360 561 360 561Revaluation of derivative financial instruments 614 (6) - -Fit out contributions amortised (1,828) (2,345) - -Realisation of Foreign Currency5,272 - - -Translation ReserveAbandonment of United Kingdom13,684 - - -non-cash assets(Increase)/decrease in deferred taxation 2,166 2,157 (305) (169)Impairment of investment in subsidiary - - - 54,098Foreign currency portfolio restructure reserve- (6,356) - -amortisationNet (gain) on sale of non current assets - - (905) -Add/(less) movements in workingcapital items:(Increase) in receivables and prepayments (4,775) (707) (38,732) (80,830)(Increase)/decrease in inventories 12,785 (19,844) - -Increase/(decrease) in payables1,824 8,751 1,265 (24,959)and provisions(Decrease) in provisions (358) - - -Net cash inflow/(outflow) fromoperating activities14,153 (4,574) (41,114) (40,748)89
pumpkin patch limited & subsidiaries NOTES TO THE financial statements 31 july <strong>2012</strong>pumpkin patch limited & subsidiaries NOTES TO THE financial statements 31 july <strong>2012</strong>25 Financial risk management (iii) Summarised sensitivity analysisThe Group’s activities expose it to a variety of financial risks: market risk (includingcurrency risk and interest rate risk), credit risk and liquidity risk. The Group’s overallrisk management programme focuses on the unpredictability of financial markets andseeks to minimise potential adverse effects on the financial performance of the Group.The Group uses derivative financial instruments such as foreign exchange contractsand options and interest rate swaps to manage certain risk exposures. Derivativesare exclusively used for economic hedging purposes (i.e. not as trading or otherspeculative instruments), however not all derivative financial instruments qualify forhedge accounting.Risk management is carried out based on policies approved by the Board of Directors.The Group treasury policy provides written principles for overall risk management, aswell as policies covering specific areas, such as foreign exchange risk. The Parent isnot directly exposed to any significant financial risk.(a) Market risk(i) Foreign exchange riskThe Group operates internationally and is exposed to foreign exchange risk arising fromvarious currency exposures, primarily with respect to the United States dollar, the Britishpound and Australian dollar.The purpose of the Group’s foreign currency risk management activities is to protect theGroup from exchange rate volatility with respect to the New Zealand dollar net cashmovements resulting from the sale of products in foreign currencies to foreign customersand the purchase of products and raw materials in foreign currencies from foreignsuppliers. The Group enters into foreign currency option contracts and forward foreigncurrency contracts within policy parameters to manage risk associated with anticipatedsales or costs denominated principally in United States dollars, British pounds and theAustralian dollar. The terms of the foreign currency option contracts and the forwardforeign currency contracts do not exceed three years. These anticipated sales or costsqualify as highly probable forecasts for hedge accounting purposes.Refer to note 10 which shows the forward foreign exchange contracts and options heldby the Group as derivative financial instruments at balance date. A sensitivity analysisof foreign exchange rate risk on the Group’s financial assets and liabilities on profit andequity is provided in the table below.(ii) Cash flow and fair value interest rate riskThe Group’s main interest rate risk arises from floating rate borrowings drawn downunder bank debt facilities. When deemed appropriate, the Group manages floatinginterest rate risk by using floating to fixed interest rate swaps. Interest rate swaps havethe economic effect of converting borrowings from floating to fixed rates.Refer to note 10 for notional principal amounts and valuations of interest rate swapsoutstanding at balance date. A sensitivity analysis of interest rate risk on the Group’sfinancial assets and liabilities on profit and equity is provided in the table below.Refer to Note 17 for further details of the Group’s borrowings.The following table summarises the sensitivity of the Group’s financial assets andfinancial liabilities to interest rate risk and foreign exchange risk.A sensitivity of 10% for foreign exchange risk has been selected. Despite the recentvolatility in the currency markets over the past 12 months, an overall sensitivity of 10%is considered to be reasonable based upon the exchange rate volatility observed ona historic basis for the preceding five year period and market expectation for potentialfuture movements.A sensitivity of 1% has been selected for interest rate risk. The 1% sensitivity is basedon reasonably possible changes over a financial year, using the observed range ofhistorical data for the preceding five year period.Amounts are shown net of income tax. All variables other than applicable interest ratesand exchange rates are held constant.91
pumpkin patch limited & subsidiaries NOTES TO THE financial statements 31 july <strong>2012</strong>pumpkin patch limited & subsidiaries NOTES TO THE financial statements 31 july <strong>2012</strong>25 Financial risk management continued 25 Financial risk management continuedInterest rate riskForeign exchange risk‐1% +1% ‐10% +10%Carryingamount Profit Equity Profit Equity Profit Equity Profit EquityConsolidated $’000 $’000 $’000 $’000 $’000 $’000 $’000 $’000 $’00031 July <strong>2012</strong>Financial assetsCash and cash equivalents 5,343 6 - (6) - 431 - (353) -Trade receivables 7,618 - - - - 769 - (629) -Employee share scheme28 - - - - - - - -receivableOther receivables 4,374 - - - - 2 - (2) -Derivative financial instruments 1,787 - - - - (1,631) (1,178) 3,007 961Financial liabilitiesTrade payables (14,944) - - - - 1,413 - - (1,156)Employee benefits (5,696) - - - - 210 - - (172)Interest bearing liabilities (60,000) 600 - (600) - - - - -Derivative financial instruments (23,183) - - - - 137 (3,785) (224) 3,147Total increase/ (decrease) 606 (606) - 1,331 (4,963) 1,799 2,78031 July 2011Financial assetsCash and cash equivalents 10,030 39 - (39) - 896 - (733) -Trade receivables 7,554 - - - - 731 - (766) -Employee share scheme100 - - - - - - - -receivableOther receivables 2,933 - - - - 36 - (29) -Derivative financial instruments 5,971 - - - - - (29,239) - 23,990Financial liabilitiesTrade payables (11,898) - - - - (1,198) - 980 -Employee benefits (6,424) - - - - (395) - 323 -Interest bearing liabilities (71,000) 710 - (710) - - - - -Derivative financial instruments (55,976) - - - - 1,196 21,858 (972) (17,757)Total increase/ (decrease) 749 - (749) - 1,264 (7,381) (1,197) 6,233Interest rate riskForeign exchange risk‐1% +1% ‐10% +10%Carryingamount Profit Equity Profit Equity Profit Equity Profit EquityParent $’000 $’000 $’000 $’000 $’000 $’000 $’000 $’000 $’00031 July <strong>2012</strong>Financial assetsAmounts owed from subsidiaries 238,995 - - - - 190 - (156) -31 July 2011Financial liabilitiesAmounts owed from subsidiaries 247,603 - - - - 3,302 - (2,702) -The Parent is not sensitive to any interest rate risk, nor is it sensitive to foreign exchange risk except on amountsowed from its subsidiaries.(b) Credit riskCredit risk is managed on a Group basis and refers to the risk of a counterparty failing todischarge an obligation. In the normal course of business, the Group incurs credit risk fromtrade receivables and transactions with financial institutions. The Group places its cash,short term deposits and derivative financial instruments with only high credit quality financialinstitutions. Sales to retail customers are required to be settled in cash or using major creditcards, mitigating credit risk. Trade receivables arising from wholesale arrangements areindividually reviewed regularly for impairment as part of normal operating procedures andprovided for where appropriate. Overdue amounts that have not been provided for relateto customers that have no recent history of default. Approximately 8.4% (2011: 12.7%) of<strong>report</strong>ed continuing sales give rise to trade receivables. The top five wholesale customersaccount for 81.1% (2011: 81.2%) of the trade receivables balance. Refer also to note 8 forfurther details.(c) Liquidity riskPrudent liquidity risk management implies maintaining sufficient cash and the availabilityof funding through an adequate amount of committed credit facilities. Due to the dynamicnature of the underlying businesses, Management aims at maintaining flexibility in fundingby keeping committed credit lines available.Management monitors rolling forecasts of the Group’s liquidity reserve on the basis ofexpected cash flow. For details of available facilities, refer note 17 for further details.The table below analyses the Group’s non derivative financial liabilities into relevantmaturity groupings based on the remaining period at the <strong>report</strong>ing date to the contractualmaturity date. The amounts disclosed in the table are the contractual undiscountedcash flows.93
pumpkin patch limited & subsidiaries NOTES TO THE financial statements 31 july <strong>2012</strong>pumpkin patch limited & subsidiaries NOTES TO THE financial statements 31 july <strong>2012</strong>25 Financial risk management continuedLess than1 yearBetween 1& 2 yearsBetween 2& 5 years Total$’000 $’000 $’000 $’000Consolidated31 July <strong>2012</strong>Trade payables (14,944) - - (14,944)Employee benefits (5,696) - - (5,696)Interest bearing liabilities (45,000) (15,000) - (60,000)Guarantees issued (3,334) - - (3,334)(68,974) (15,000) - (83,974)31 July 2011Trade payables (11,898) - - (11,898)Employee benefits (6,424) - - (6,424)Interest bearing liabilities (20,000) (51,000) - (71,000)Guarantees issued (3,581) - - (3,581)(41,903) (51,000) - (92,903)25 Financial risk management continuedThe Group enters into forward exchange contracts to manage the risks associated withforeign currency denominated sales and also manage the purchase of foreign currencydenominated products.The table below analyses the Group’s derivative financial instruments that will be settled ona gross or net basis into relevant maturity groupings based on the remaining period at thebalance sheet to the contractual maturity date. The amounts disclosed in the table are thecontractual undiscounted cash flows. They are expected to occur and affect profit or lossat various dates between balance date and the following five years.Less than1 yearBetween 1& 2 yearsBetween 2& 5 yearsOver5 yearsConsolidated $’000 $’000 $’000 $’000At 31 July <strong>2012</strong>Forward foreign exchange contracts ‐cash flow hedgesinflow (1,531) (87) - -outflow (17,409) (2,557) - -At 31 July 2011Forward foreign exchange contracts ‐cash flow hedgesinflow 1,747 2,257 1,967 -outflow (34,117) (17,239) (4,620) -All of the Parents financial liabilities fall due within 1 year (2011: within 1 year).95
pumpkin patch limited & subsidiaries NOTES TO THE financial statements 31 july <strong>2012</strong>pumpkin patch limited & subsidiaries NOTES TO THE financial statements 31 july <strong>2012</strong>25 Financial risk management continued(d) Fair value estimationNZ IFRS 7 requires disclosure of fair value measurements by level of the following fair valuemeasurement hierarchy:- Quoted prices (unadjusted) in active markets for identical assets or liabilities (level 1).- Inputs other than quoted prices included within level 1 that are observable for the asset orliability, either directly (that is, as prices) or indirectly (that is, derived from prices) (level 2).- Inputs for the asset or liability that are not based on observable market data (that is,unobservable inputs) (level 3).The only assets and liabilities measured at fair value, held by the Group at 31 July <strong>2012</strong>and 31 July 2011, are the derivative financial instruments (as disclosed in note 10).These are classed as level 2 in the measurement hierarchy.The parent company did not have any assets or liabilities measured at fair value(2011: nil)The fair value of financial instruments traded in active markets is based on quoted marketprices at the balance sheet date. A market is regarded as active if quoted prices arereadily and regularly available from an exchange, dealer, broker, industry group, pricingservice, or regulatory agency, and those prices represent actual and regularly occurringmarket transactions on an arm’s length basis. The quoted market price used for financialassets held by the group is the current bid price. These instruments are included in level 1.The fair value of financial instruments that are not traded in an active market (for example,over-the-counter derivatives) is determined by using valuation techniques. These valuationtechniques maximise the use of observable market data where it is available and rely aslittle as possible on entity specific estimates. If all significant inputs required to fair valuean instrument are observable, the instrument is included in level 2.If one or more of the significant inputs is not based on observable market data, theinstrument is included in level 3.25 Financial risk management continued(E) Financial instruments by categoryAssets & liabilities as perbalance sheetLoans andreceivablesDerivativesused forhedgingMeasured atamortised costTotal$’000 $’000 $’000 $’000At 31 July <strong>2012</strong>Cash and cash equivalents 5,343 - - 5,343Trade receivables 7,618 - - 7,618Employee share scheme28 - - 28receivableOther receivables 4,374 - - 4,374Derivative financial- 1,787 - 1,787instrument assetsTrade payables - - (14,944) (14,944)Employee benefits - - (5,696) (5,696)Interest bearing liabilities - - (60,000) (60,000)Derivative financial- (23,183) - (23,183)instrument liabilities17,363 (21,396) (80,640) (84,673)At 31 July 2011Cash and cash equivalents 10,030 - - 10,030Trade receivables 7,554 - - 7,554Employee share scheme100 - - 100receivableOther receivables 2,933 - - 2,933Derivative financial- 5,971 - 5,971instrument assetsTrade payables - - (11,898) (11,898)Employee benefits - - (6,424) (6,424)Interest bearing liabilities - - (71,000) (71,000)Derivative financial- (55,976) - (55,976)instrument liabilities20,617 (50,005) (89,322) (118,710)97
pumpkin patch limited & subsidiaries NOTES TO THE financial statements 31 july <strong>2012</strong>pumpkin patch limited & subsidiaries NOTES TO THE financial statements 31 july <strong>2012</strong>25 Financial risk management continued 25 Financial risk management continued(e) Financial instruments by categoryLoans and Derivatives usedreceivables for hedgingMeasured atamortised costParent $’000 $’000 $’000 $’000At 31 July <strong>2012</strong>Cash and cash equivalents 36 - - 36Trade receivables 1 - - 1Amounts owed from subsidiaries 238,995 - - 238,995Employee share scheme receivable 28 - - 28Other receivables 2,417 - - 2,417Trade payables - - (379) (379)Amounts due to subsidiaries - - (251,890) (251,890)Employee benefits - - 2,010 2,010Interest bearing liabilities - - (52) (52)241,477 - (250,311) (8,834)At 31 July 2011Cash and cash equivalents 25 - - 25Trade receivables 2 - - 2Amounts owed from subsidiaries 247,603 - - 247,603Employee share scheme receivable 100 - - 100Other receivables 313 - - 313Trade payables - - (180) (180)Amounts due to subsidiaries - - (243,047) (243,047)Employee benefits - - (2,074) (2,074)Interest bearing liabilities - - (159) (159)248,043 - (245,460) 2,583The accounting policies for financial instruments have been applied to the line items above.(f) Capital risk managementThe main objective of capital risk management is to ensure the Group operates as a going concern,meets debts as they fall due, maintains the best possible capital structure, and reduces the cost ofcapital. Group capital is regarded as equity as shown in the balance sheet. This quantifies capitalas reference to the balance sheet. To maintain or alter the capital structure the Group has the abilityto review the size of the dividends paid to shareholders, return capital or issue new shares, reduce orincrease debt or sell assets.TotalThere are a number of external bank covenants in place relating to debt facilities which are alsoused to monitor capital internally. These covenants are calculated monthly and <strong>report</strong>ed to the bankquarterly. The principal covenants relating to capital management are the earnings before interestand taxation (EBIT) fixed cover charge ratio and the cash flow gearing ratio. There have been nobreaches of these covenants for the current or prior period.26 CommitmentsThe Group has commitments for future capital expenditure at 31 July <strong>2012</strong> of $3.7 million(2011: $1.0 million).The Group leases various retail outlets under non-cancellable operating lease agreements.The leases reflect normal commercial arrangements with varying terms, escalation clauses andrenewal rights.27 ContingenciesConsolidated at Parent at31 July<strong>2012</strong>31 July201131 July<strong>2012</strong>As at 31 July <strong>2012</strong> the parent entity and Group had no contingent liabilities or assets (2011:$Nil).28 Events occurring after the balance sheet dateAs at 27 September <strong>2012</strong> there have been no significant events subsequent to 31 July <strong>2012</strong>.31 July2011$’000 $’000 $’000 $’000Commitments for minimum lease payments in relation tonon-cancellable operating leases are payable as follows:Within one year 40,648 50,813 2,753 2,811Later than one year but not later than five years 92,388 124,684 10,747 10,813Later than five years 15,198 30,577 12,054 14,738148,234 206,074 25,554 28,36299
Independent Auditors’ Reportto the shareholders of <strong>Pumpkin</strong> <strong>Patch</strong> LimitedIndependent Auditors’ ReportReport on the Financial Statementsto the shareholders of <strong>Pumpkin</strong> <strong>Patch</strong> LimitedWe have audited the financial statements of <strong>Pumpkin</strong> <strong>Patch</strong> Limited (“the Company”) on pages42 to 99, which comprise the balance sheets as at 31 July <strong>2012</strong>, the income statements,statements of comprehensive income, statements of changes in equity and statements of cashflows Report for the on year the then Financial ended, and Statementsthe notes to the financial statements that include a summaryof We significant have audited accounting the financial policies statements and other of explanatory <strong>Pumpkin</strong> <strong>Patch</strong> information Limited for (“the both Company”) the Company on pages and42 the to Group. 99, which The Group comprise comprises the balance the Company sheets as at and 31 the July entities <strong>2012</strong>, the it controlled income statements,31 July <strong>2012</strong> orfrom statements time to of time comprehensive during the financial income, statements year. of changes in equity and statements of cashflows for the year then ended, and the notes to the financial statements that include a summaryDirectors’ Responsibility for the Financial Statementsof significant accounting policies and other explanatory information for both the Company andthe The Group. Directors The are Group responsible comprises for the the Company preparation and of the these entities financial it controlled statements 31 in accordanceJuly <strong>2012</strong> orfrom with generally time to time accepted during accounting the financial practice year. in New Zealand and that give a true and fair view ofthe matters to which they relate and for such internal controls as the Directors determine areDirectors’ necessary Responsibility enable the preparation for the of Financial financial statements Statements that are free from materialThe misstatement, Directors are whether responsible due to for fraud the or preparation error. of these financial statements in accordancewith generally accepted accounting practice in New Zealand and that give a true and fair view ofAuditors’ Responsibilitythe matters to which they relate and for such internal controls as the Directors determine areOurnecessaryresponsibilityto enableistheto expresspreparationan opinionof financialon thesestatementsfinancialthatstatementsare free frombasedmaterialon our audit. Weconductedmisstatement,ourwhetheraudit in accordancedue to fraudwithor error.International Standards on Auditing (New Zealand) andInternational Standards on Auditing. These standards require that we comply with relevantAuditors’ ethical requirements Responsibility and plan and perform the audit to obtain reasonable assurance aboutOur whether responsibility the financial is to statements express an are opinion free from on these material financial misstatement. statements based on our audit. Weconducted our audit in accordance with International Standards on Auditing (New Zealand) andAn audit involves performing procedures to obtain audit evidence about the amounts andInternational Standards on Auditing. These standards require that we comply with relevantdisclosures in the financial statements. The procedures selected depend on the auditors’ethical requirements and plan and perform the audit to obtain reasonable assurance aboutjudgement, including the assessment of the risks of material misstatement of the financialwhether the financial statements are free from material misstatement.statements, whether due to fraud or error. In making those risk assessments, the auditorsAn consider audit the involves internal performing controls procedures relevant to the to obtain Company audit and evidence the Group’s about preparation the amounts of and financialdisclosures statements that in the give financial a true and statements. fair view The of the procedures matters to selected which depend they relate, on the in order auditors’designjudgement, audit procedures including that the are assessment appropriate of in the the risks circumstances, of material but misstatement not for the of purpose the financial ofstatements, expressing an whether opinion due on to the fraud effectiveness or error. In of the making Company those and risk the assessments, Group’s internal the auditors control. Anaudit consider also the includes internal evaluating controls relevant the appropriateness to the Company of accounting and the Group’s policies preparation used and the of financialreasonableness statements that of give accounting a true and estimates, fair view of as the well matters as evaluating to which the they overall relate, presentation in order to of design thefinancial audit procedures statements. that are appropriate in the circumstances, but not for the purpose ofexpressing an opinion on the effectiveness of the Company and the Group’s internal control. AnWe believe that the audit evidence we have obtained is sufficient and appropriate to provide aaudit also includes evaluating the appropriateness of accounting policies used and thebasis for our audit opinion.reasonableness of accounting estimates, as well as evaluating the overall presentation of theWe financial have no statements. <strong>relations</strong>hip with, or interests in, <strong>Pumpkin</strong> <strong>Patch</strong> Limited or any of its subsidiariesother than in our capacities as auditors and providers of other assurance services.We believe that the audit evidence we have obtained is sufficient and appropriate to provide abasis for our audit opinion.Independent Auditors’ Report<strong>Pumpkin</strong> <strong>Patch</strong> LimitedOpinionIn our opinion, the financial statements on pages 42 to 99:(i)(ii)(iii)comply with generally accepted accounting practice in New Zealand; andcomply with International Financial Reporting Standards; andgive a true and fair view of the financial position of the Company and the Group asat 31 July <strong>2012</strong>, and their financial performance and cash flows for the year thenended.Report on Other Legal and Regulatory RequirementsWe also <strong>report</strong> in accordance with Sections 16(1)(d) and 16(1)(e) of the Financial Reporting Act1993. In relation to our audit of the financial statements for the year ended 31 July <strong>2012</strong>:(i)(ii)we have obtained all the information and explanations that we have required; andin our opinion, proper accounting records have been kept by the Company as far asappears from an examination of those records.Restriction on Distribution or UseThis <strong>report</strong> is made solely to the Company’s shareholders, as a body, in accordance with Section205(1) of the Companies Act 1993. Our audit work has been undertaken so that we might stateto the Company’s shareholders those matters which we are required to state to them in anauditors’ <strong>report</strong> and for no other purpose. To the fullest extent permitted by law, we do notaccept or assume responsibility to anyone other than the Company and the Company’sshareholders, as a body, for our audit work, for this <strong>report</strong> or for the opinions we have formed.Chartered Accountants27 September <strong>2012</strong>AucklandWe have no <strong>relations</strong>hip with, or interests in, <strong>Pumpkin</strong> <strong>Patch</strong> Limited or any of its subsidiariesother than in our capacities as auditors and providers of other assurance services.PricewaterhouseCoopers, 188 Quay Street, Private Bag 92162, Auckland 1142, New ZealandT: +64 (9) 355 8000, F: +64 (9) 355 8001, www.pwc.com/nz101
shareholder informationFOR THE YEAR ENDED 31 JULY <strong>2012</strong>size of holdings number of holders % number of shares %1 - 1,000 1,778 29.2 1,132,564 0.71001 - 5,000 2,672 43.8 7,565,901 4.55,001 - 10,000 922 15.1 7,072,144 4.210,001 - 100,000 664 10.9 17,266,709 10.3Over 100,000 61 1.0 135,249,090 80.3The details set out above were as at 31 August <strong>2012</strong>.Principal Shareholders6,348 100.00 167,786,408 100.00The names and holdings of the twenty largest registered shareholders as at31 August <strong>2012</strong> were:Ordinary Shares %New Zealand Central Securities Depository Limited 36,612,708 21.8Nigel P Smith & Wynyard Wood Services 20,000,000 11.9Jbwere (NZ) Nominees Limited 17,078,567 10.1Jbwere (NZ Nominees Limited 16,174,086 9.6Maurice John Prendergast & Kerry Donna Prendergast & Stuart Gavin Callender 9,620,000 5.7Sally Rene Synnott & Mark Joseph Synnott & The Gale Trustee Co Ltd 9,500,000 5.6Substantial Security HoldersPursuant to Section 26 of the Securities Markets Act 1988, the followingsubstantial security holders at 31 August <strong>2012</strong> were as follows:Nigel P Smith & Wynard Wood Services(notice dated 16 June 2006)Rodney Adrian Duke and Alaister John Wall(notice dated 8 June <strong>2012</strong>)Janet Heather Cameron(notice dated 29 April 2010)Accident Compensation Corporation(notice dated 17 May <strong>2012</strong>)Maurice J Prendergast and Kerry D Prendergast(notice dated 17 June 2011)Mark J Synnott and Sally R Synnott(notice dated 19 October 2010)AMP Capital Investors (New Zealand) Limited(notice dated 18 July <strong>2012</strong>)Ordinary Shares20,000,00016,674,08616,086,18115,122,41811,070,0009,506,8009,321,674Jbwere (NZ) Nominees Limited 6,000,000 3.6NZPT Custodians (Grosvenor) Limited 1,504,712 0.9Gregory John Muir & Debra Jane Muir & Geoffrey Alastair Lawrie 1,461,900 0.9Jbwere (NZ) Nominees Limited 1,250,000 0.7<strong>Pumpkin</strong> <strong>Patch</strong> Nominees Ltd 1,157,814 0.7Bruce Michael Walkley & Deborah Frances Walkley & Nigel Philip Smith 1,130,000 0.7Brendon Thomas & Katrina Mary Thomas & John Graham Turrall 1,000,000 0.6New Zealand Depository Nominee Limited 931,862 0.6Christine Conyngham 813,510 0.5Joanna Hickman & John Anthony Callaghan & Kevin James Hickman & John William Ryder 720,000 0.4Investment Custodial Services Limited 592,596 0.4Adrastea Limited 511,168 0.3Kay Gillard 510,289 0.3Custodial Services Limited 507,591 0.3103
executive teamcorporate directoryNeil Cowie................................................ Chief Executive OfficerChris Cardwell.................................... General Manager – PropertyChrissy Conyngham........... Group General Manager/Design DirectorDominique De Give......................... General Manager – WholesaleBrian De Gregory................... General Manager – Human ResourcesGlenys Hoffmann............................General Manager – OperationsBronny Jacobsen........................... General Manager – MerchandiseKate Tattersfield................................ General Manager – MarketingZarina Thesing................ General Manager – Information TechnologyBruce Walkley....................................... General Manager – DirectMatthew Washington.......Chief Financial Officer/Company SecretaryRegistered Office439 East Tamaki RoadAucklandNew ZealandContact DetailsPrivate Bag 94 310PakurangaAucklandNew ZealandPhone: +64 9 274 7088Facsimile: +64 9 274 1122Website: pumpkinpatchkids.comInvestor RelationsE-mail: <strong>investor</strong>@pumpkinpatch.co.nzWebsite: www.pumpkinpatch.bizShare RegistrarLink Market Services LimitedPO Box 384AshburtonNew ZealandPhone: +64 3 308 8887Facsimile: +64 3 308 1311SolicitorsSimpson GriersonPrivate Bag 92 518Shortland StreetAucklandNew ZealandAuditorsPricewaterhouseCoopersPrivate Bag 92 162AucklandNew Zealand105
celebrating kids,everywhere
see & shop more @pumpkinpatchkids.com