1. Refining and Petrochemicals - Rompetrol.com
1. Refining and Petrochemicals - Rompetrol.com
1. Refining and Petrochemicals - Rompetrol.com

You also want an ePaper? Increase the reach of your titles
YUMPU automatically turns print PDFs into web optimized ePapers that Google loves.
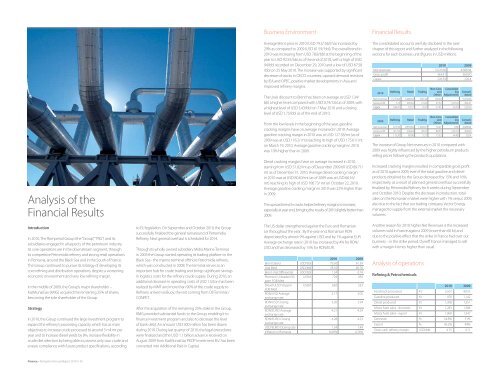
Analysis of the<br />
Financial Results<br />
Introduction<br />
In 2010, The <strong>Rompetrol</strong> Group (the“Group”,“TRG”) <strong>and</strong> its<br />
subsidiaries engaged in all aspects of the petroleum industry.<br />
Its core operations are in the downstream segment, through<br />
its <strong>com</strong>petitive Petromidia refinery <strong>and</strong> strong retail operations<br />
in Romania, around the Black Sea <strong>and</strong> in the South of France.<br />
The Group continued to pursue its strategy of developing its<br />
core refining <strong>and</strong> distribution operations, despite a worsening<br />
economic environment <strong>and</strong> very low refining margin.<br />
In the middle of 2009, the Group’s major shareholder –<br />
KazMunaiGas (KMG) acquired the remaining 25% of shares,<br />
be<strong>com</strong>ing the sole shareholder of the Group.<br />
Strategy<br />
In 2010, the Group continued the large investment program to<br />
exp<strong>and</strong> the refinery’s processing capacity which has as main<br />
objectives to increase crude processed to around 5 mil mt per<br />
year <strong>and</strong> to increase diesel yields by 8%, increase flexibility in<br />
crude diet selection by being able to process only sour crude <strong>and</strong><br />
ensure <strong>com</strong>pliance with future product specifications, according<br />
Finance « <strong>Rompetrol</strong> Annual Report 2010 // 39<br />
to EU legislation. On September <strong>and</strong> October 2010, the Group<br />
successfully finalized the general turnaround of Petromidia<br />
Refinery. Next general overhaul is scheduled for 2014.<br />
Through its wholly owned subsidiary Midia Marine Terminal,<br />
in 2009 the Group started operating its trading platform in the<br />
Black Sea - the marine terminal offshore Petromidia refinery,<br />
which was constructed in 2008. The terminal serves as an<br />
important hub for crude trading <strong>and</strong> brings significant savings<br />
in logistics costs for the refinery crude supply. During 2010, an<br />
additional decrease in operating costs of USD <strong>1.</strong>5/ton has been<br />
realized by MMT <strong>and</strong> more than 90% of the crude supply to<br />
Refinery arrived via Buoy, the rest <strong>com</strong>ing from Oil Terminal /<br />
CONPET.<br />
After the acquisition of the remaining 25% stake in the Group,<br />
KMG provided substantial funds to the Group, enabling it to<br />
finance investment program <strong>and</strong> also to decrease the level<br />
of bank debt. An amount USD 300 million has been drawn<br />
during 2010. During last quarter of 2010, the legal procedures<br />
were finalized <strong>and</strong> the USD <strong>1.</strong>1 billion advance received on<br />
August 2009 from KazMunaiGaz PKOP Investment B.V. has been<br />
converted into Additional Paid in Capital.<br />
Business Environment<br />
Average Brent price in 2010 (USD 79.5/ bbl) has increased by<br />
29% as <strong>com</strong>pared to 2009 (USD 6<strong>1.</strong>59/ bbl). The overall trend in<br />
2010 was increasing from USD 78.8/bbl at the beginning of the<br />
year to USD 92.55/bbl as of the end of 2010, with a high of USD<br />
94/bbl recorded on December 29, 2010 <strong>and</strong> a low of USD 67.58<br />
/bbl on 25 May 2010. The increase was supported by significant<br />
decrease of stocks in OECD countries, upward dem<strong>and</strong> revisions<br />
by IEA <strong>and</strong> OPEC, positive market developments in Asia <strong>and</strong><br />
improved refinery margins.<br />
The Urals discount to Brent has been on average at USD <strong>1.</strong>34/<br />
bbl a higher level <strong>com</strong>pared with USD 0.74/ bbl as of 2009, with<br />
a highest level of USD 3.43/bbl on 7 May 2010 <strong>and</strong> a closing<br />
level of USD <strong>1.</strong>75/bbl as of the end of 2010.<br />
From the low levels in the beginning of the year, gasoline<br />
cracking margins have on average increased in 2010. Average<br />
gasoline cracking margin in 2010 was at USD 127.58/mt (as of<br />
2009 was at USD 116.2/ mt) reaching its high of USD 175.61/ mt<br />
on March 19, 2010. Average gasoline cracking margin in 2010<br />
was 10% higher than in 2009.<br />
Diesel cracking margins have on average increased in 2010,<br />
starting from USD 5<strong>1.</strong>02/mt as of December 2009 till USD 89.71/<br />
mt as of December 31, 2010. Average diesel cracking margin<br />
in 2010 was at USD 80.63/mt (as of 2009 was at USD 66.16/<br />
mt) reaching its high of USD 106.73/ mt on October 22, 2010.<br />
Average gasoline cracking margin in 2010 was 22% higher than<br />
in 2009.<br />
The upward trend in cracks helped refinery margins to increase,<br />
especially at year end, bringing the results of 2010 slightly better than<br />
2009.<br />
The US dollar strengthened against the Euro <strong>and</strong> Romanian<br />
Lei throughout the year. By the year end, Romanian RON<br />
depreciated by almost 9% against USD <strong>and</strong> by 1% against EUR.<br />
Average exchange rate in 2010 has increased by 4% for RON/<br />
USD <strong>and</strong> has decreased by 15% for RON/EUR.<br />
2010 2009<br />
Brent Dated USD/bbl 79.50 6<strong>1.</strong>59<br />
Ural Med USD/bbl 78.16 60.76<br />
Brent-Ural Differential USD/bbl <strong>1.</strong>34 0.74<br />
Premium Unleaded 50<br />
ppm FOB Med<br />
USD/t 729 583<br />
Diesel ULSD 50 ppm<br />
FOB Med<br />
USD/t 682 533<br />
RON/USD Average<br />
exchange rate<br />
3.17 3.05<br />
RON/USD Closing<br />
exchange rate<br />
3.20 2.94<br />
RON/EURO Average<br />
exchange rate<br />
4.21 4.24<br />
RON/EURO Closing<br />
exchange rate<br />
4.28 4.23<br />
USD/EURO Closing rate <strong>1.</strong>34 <strong>1.</strong>44<br />
Inflation in Romania 6.09% 4.74%<br />
Financial Results<br />
The consolidated accounts are fully disclosed in the next<br />
chapter of this report <strong>and</strong> further analyzed in the following<br />
sections for each business unit (figures in USD million).<br />
2010 2009<br />
Net revenues 5,070.66 4,688.94<br />
Gross profit 363.41 360.00<br />
Capex 226.59 220.4<br />
2010<br />
<strong>Refining</strong> Retail Trading Non-Core<br />
<strong>and</strong><br />
Others<br />
Consolidating<br />
Adjustments Consolidated<br />
Net revenues 572.5364 3,488.49 900.34 109.30 5,070.66<br />
Gross profit 7.74 299.44 2<strong>1.</strong>42 57.32 (22.52) 363.41<br />
Capex 184.41 19.77 0.47 27.41 (5.47) 226.59<br />
2009<br />
<strong>Refining</strong> Retail Trading Non-Core<br />
<strong>and</strong><br />
Others<br />
Consolidating<br />
Adjustments Consolidated<br />
Net revenues 473.34 2,859.66 1,284.97 70.97 0.00 4,688.94<br />
Gross profit (25.72) 299.44 30.41 80.55 (39.37) 360.00<br />
Capex 115.30 89.06 5.21 15.32 (4.48) 220.4<br />
The increase of Group Net revenues in 2010 <strong>com</strong>pared with<br />
2009 was highly influenced by the higher petroleum products<br />
selling prices following the products quotations.<br />
Increased cracking margins resulted in <strong>com</strong>parable gross profit<br />
as of 2010 against 2009, even if the total gasoline <strong>and</strong> diesel<br />
products obtained by the Group decreased by 15% <strong>and</strong> 16%,<br />
respectively, as a result of planned general overhaul successfully<br />
finalized by Petromidia Refinery for 6 weeks during September<br />
<strong>and</strong> October 2010. Despite this decrease in production, total<br />
sales on the Romanian market were higher with 1% versus 2009,<br />
also due to the fact that our trading <strong>com</strong>pany Vector Energy<br />
managed to supply from the external market the necessary<br />
volumes.<br />
Another reason for 2010 higher Net Revenues is the increased<br />
volumes sold in France against 2009 (more than 60 kt) <strong>and</strong><br />
due to the positive effect that the strike in France had over our<br />
business – in the strike period, Dyneff France managed to sell<br />
with a margin 4 times higher than usual.<br />
Analysis of operations<br />
<strong>Refining</strong> & <strong>Petrochemicals</strong><br />
2010 2009<br />
Feedstock processed Kt 3,507 4,033<br />
Gasoline produced Kt 970 1,142<br />
Diesel produced Kt 1,308 1,551<br />
Motor fuels sales - domestic Kt 1,283 1,386<br />
Motor fuels sales - export Kt 1,060 1,347<br />
Domestic % 54.8% 51%<br />
Export % 45.2% 49%<br />
Gross cash refinery margin USD/bbl 4.75 4.11<br />
RPT_2010 Annual Report_1024x768.indd 39 22/11/2011 10:35 AM

![Scrisoarea Directorului General de Opera]iuni - Rompetrol.com](https://img.yumpu.com/4907398/1/184x260/scrisoarea-directorului-general-de-operaiuni-rompetrolcom.jpg?quality=85)