evaluation of stencil foil materials, suppliers and ... - IPC Outlook
evaluation of stencil foil materials, suppliers and ... - IPC Outlook
evaluation of stencil foil materials, suppliers and ... - IPC Outlook

Create successful ePaper yourself
Turn your PDF publications into a flip-book with our unique Google optimized e-Paper software.
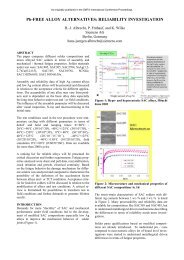
As originally published in the SMTA International Conference Proceedings.OBSERVATIONSDimensional AccuracyThe measurements shown in tables 2 <strong>and</strong> 3 are grouped bymaterial type. The electr<strong>of</strong>ormed <strong>stencil</strong>s exhibited thegreatest amount <strong>of</strong> variation in aperture size, with a range <strong>of</strong>approximately 0.001”; the laser cut nickel <strong>foil</strong>s showedabout half that at 0.0005”, <strong>and</strong> the laser cut SS <strong>foil</strong>s showedabout one-tenth the size variation <strong>of</strong> the electr<strong>of</strong>ormedapertures, with a 0.0001” spread from smallest to largestmeasured sizes.Transfer Efficiency110%100%90%80%70%60%Effect <strong>of</strong> Coating on SS30.004" <strong>foil</strong>3 ‐ A uncoated3 ‐ A coated3 ‐ D uncoated3 ‐ D coatedThickness variation also trended with material type. Theelectr<strong>of</strong>ormed <strong>foil</strong>s showed more thickness variation thanthe rolled <strong>foil</strong>s. Of the electr<strong>of</strong>ormed <strong>stencil</strong>s, supplier C’s<strong>foil</strong>s showed the greatest deviation from its specification,measuring almost 25% thicker than desired. Of theelectr<strong>of</strong>ormed <strong>foil</strong>s that were laser cut, both supplier B’s <strong>and</strong>C’s submissions showed considerable deviation from thespecification (4–19%). Supplier D’s <strong>stencil</strong>s did notdemonstrate as much thickness variation in theelectr<strong>of</strong>ormed <strong>materials</strong> as the other electr<strong>of</strong>ormed samples.Supplier A did not submit any electr<strong>of</strong>ormed samples. AllSS <strong>foil</strong>s showed extremely low thickness variation.Positional accuracy was not measured on the <strong>stencil</strong>s, butpaste print <strong>of</strong>fsets were measured <strong>and</strong> recorded as part <strong>of</strong> thesolder paste inspection routine.Transfer Efficiencies <strong>and</strong> Area RatiosPlotting TE against Area Ratio (AR) is an industry-acceptedmethod <strong>of</strong> measuring the release characteristics <strong>of</strong> a <strong>stencil</strong>.For all <strong>stencil</strong>s, the two data points generated by the BGA<strong>and</strong> 0201 measurements form the endpoints <strong>of</strong> the trend line<strong>and</strong> the basis for the comparison. The BGA ARs aredesigned to be in the 0.60 to 0.66 range, depending on <strong>foil</strong>thickness; the 0201 ARs are designed to be in the 0.71 to0.80 range, again depending on <strong>foil</strong> thickness.All the data was plotted <strong>and</strong> reviewed. The more notablecomparisons include: Comparisons <strong>of</strong> release performance with <strong>and</strong>without surface coatings Comparisons <strong>of</strong> two specialized stainless steelalloys Comparison <strong>of</strong> electr<strong>of</strong>ormed <strong>and</strong> laser cut nickel<strong>stencil</strong>s50%0.64 0.66 0.68 0.70 0.72 0.74 0.76 0.78Area RatioFigure 2. Comparison <strong>of</strong> print performance <strong>of</strong> SS #3<strong>stencil</strong>s from two <strong>suppliers</strong> with <strong>and</strong> without coatingTransfer Efficiency110%100%90%80%70%60%50%Effect <strong>of</strong> Coating on SS40.004" <strong>foil</strong>0.64 0.66 0.68 0.70 0.72 0.74 0.76 0.78 0.80Area Ratio4 ‐ A uncoated4 ‐ A coated4 ‐ D uncoated4 ‐ D coatedFigure 3. Comparison <strong>of</strong> print performance <strong>of</strong> SS #4<strong>stencil</strong>s from two <strong>suppliers</strong> with <strong>and</strong> without coatingWhen comparing the release characteristics <strong>of</strong> each <strong>stencil</strong>,performance differentiation is noted for the low area ratiosassociated with the BGA, but the release properties allappear to converge at the higher area ratios associated withthe 0201s. This trend was seen in all data sets.Also seen in all datasets were the slightly lower transferefficiencies <strong>of</strong> the coated <strong>stencil</strong>s on the low AR (BGA)deposits, regardless <strong>of</strong> the material type, as seen in figures 2<strong>and</strong> 3. This trend appears to counter popular beliefs aboutthe coating’s ability to improve transfer efficiency, but isconsistent on all 13 pairs <strong>of</strong> <strong>stencil</strong> tests.