Diego Mas Ivars
Diego Mas Ivars
Diego Mas Ivars
- No tags were found...

You also want an ePaper? Increase the reach of your titles
YUMPU automatically turns print PDFs into web optimized ePapers that Google loves.
BONDED PARTICLE MODELFOR JOINTED ROCK MASS<strong>Diego</strong> <strong>Mas</strong> <strong>Ivars</strong>January 2010TRITA-LWR PHD 1058ISSN 1650-8602ISRN KTH/LWR/PHD 1058-SEISBN 978-91-7415-559-4
Bonded Particle Model for Jointed Rock <strong>Mas</strong>sPREFACEThis Doctoral Thesis consists of an overview of the researchwork on the development and application of the Synthetic Rock<strong>Mas</strong>s approach. This work has been mainly published in the ninepapers listed below:Paper I. <strong>Mas</strong> <strong>Ivars</strong> D, Pierce M, Potyondy DO, Cundall PA. 2007.A new modelling approach for the study of deformation, yieldand failure of jointed rock masses. In: Proceedings Bergmekanikdag2007. Stockholm: SveBeFo.Paper II. Pierce M, <strong>Mas</strong> <strong>Ivars</strong> D, Cundall P, Potyondy D. 2007. Asynthetic rock mass model for jointed rock. In: Proc 1st Can-USRock Mech Symp, Vancouver, Eberhardt E et al, eds., London:Taylor & Francis, pp 341-349.Paper III. <strong>Mas</strong> <strong>Ivars</strong> D, Deisman N, Pierce M, Fairhurst C. 2007.The synthetic rock mass approach – a step forward in the characterizationof jointed rock masses. In: Proc 11 th Cong Int Soc RockMech, Lisbon, Ribeiro e Sousa, Olalla, Grossmann, eds. London:Taylor & Francis, vol 1, pp 485-490.Paper IV. <strong>Mas</strong> <strong>Ivars</strong> D, Pierce M, DeGagné D, Darcel C. 2008.Anisotropy and scale dependency in jointed rock-mass strength— A synthetic rock mass study. In: Proc 1st Int FLAC/DEMSymp Numer Modelling, Hart R, Detournay C, Cundall P, eds.Minneapolis: Itasca Consulting Group, Paper 06-01, pp 231-239.Paper V. <strong>Mas</strong> <strong>Ivars</strong> D, Potyondy DO, Pierce M, Cundall PA.2008. The smooth-joint contact model. In: Proc 8 th World CongComp Mech / 5 th Eur Cong Comp Meth Appl Sci & Eng, Venice,paper a2735.Paper VI: Deisman N, <strong>Mas</strong> <strong>Ivars</strong> D, Pierce M. 2008. PFC2Dsmooth joint contact model numerical experiments. In: ProcGeoEdmonton ’08, Edmonton, Canada, Paper 83.Paper VII: Cundall PA, Pierce M, <strong>Mas</strong> <strong>Ivars</strong> D. 2008. Quantifyingthe size effect of rock mass strength. In: Proc 1 st South HemisphereInt Rock Mech Symp (SHIRMS), Perth, Australia, Y Potvin,J Carter, A Dyskin, R Jeffrey, eds, vol 1, pp 3-15.Paper VIII. <strong>Mas</strong> <strong>Ivars</strong> D, Pierce M, Darcel C, Reyes-Montes J,Potyondy DO, Young RP, Cundall PA. 2010. The synthetic rockmass approach for jointed rock mass modelling. Submitted to theInternational Journal of Rock Mechanics and Mining Sciences.Paper IX. Potyondy DO, Pierce M, <strong>Mas</strong> <strong>Ivars</strong> D, Deisman N andCundall PA. 2010. Adding joints to a bonded-particle model forrock. (In preparation).v
<strong>Diego</strong> <strong>Mas</strong> <strong>Ivars</strong> TRITA LWR PHD 1058The following papers and reports are also related to the researchdescribed in this Doctoral Thesis.a) PapersDeisman N, <strong>Mas</strong> <strong>Ivars</strong> D, Darcel C, Chalatrunik RJ. 2009. Empiricaland numerical approaches for geomechanical characterizationof coal seam reservoirs. Int J Coal Geol.doi:10.1016/j.coal.2009.11.003.Tawadrous AS, DeGagne D, Pierce M, <strong>Mas</strong> <strong>Ivars</strong> D. 2009. Predictionof uniaxial compression PFC model micro-properties usingneural networks. Int J Numer Anal Meth Geomech. 33:15-25.Pierce M, <strong>Mas</strong> <strong>Ivars</strong> D, Sainsbury BL. 2009. Use of Synthetic Rock<strong>Mas</strong>ses (SRM) to investigate jointed rock mass strength and deformationbehavior. In: Proc of the Int Conf on Rock Joints andJointed Rock <strong>Mas</strong>ses, Kulatilake PHSW, ed. Tucson, Arizona,USA, special paper.Deisman N, Clalaturnyk RJ, <strong>Mas</strong> <strong>Ivars</strong> D. 2009. An adaptive continuum/discontinuumcoupled reservoir geomechanics simulationapproach for fractured reservoirs. In: Proceedings of the SPE ReservoirSimulation Symposium held in The Woodlands, Texas,USA, SPE 119254-MS, doi: 10.2118/119254-MS.Deisman N Chalaturny RJ, <strong>Mas</strong> <strong>Ivars</strong> D, Darcel C. 2008. Geomechanicalcharacterization of coalseam reservoirs: the SRM approach.In: Proc Asia Pacific Coalbed Methane Symposium, 22-24Sept, 2008, <strong>Mas</strong>sarotto P, Golding SD, Fu X, Wei C, Wang GXand Randolph V, eds. Brisbane, Australia, Paper No 003.Sainsbury BL, Pierce M, <strong>Mas</strong> <strong>Ivars</strong> D. 2008. Analysis of caving behaviorusing a synthetic rock mass (SRM) - Ubiquitous Joint Rock<strong>Mas</strong>s (UJRM) Modelling Technique. In: Proc 1 st Southern HemisphereInternational Rock Mechanics Symposium, Potvin Y, CarterJ, Dyskin A and Jeffrey R, eds. Perth, Australia, Vol. 1, pp.243-253.Sainsbury BL, Pierce M, <strong>Mas</strong> <strong>Ivars</strong> D. 2008. Simulation of rockmassstrength anisotropy and scale effects using a Ubiquitous-JointRock <strong>Mas</strong>s (UJRM) Model. In: Proc 1st Int FLAC/DEM SympNumer Modelling, Hart R, Detournay C, Cundall P, eds. Minneapolis:Itasca Consulting Group, Paper 06-02, pp 241-250.b) Reports<strong>Mas</strong> <strong>Ivars</strong> D, Pierce M, Reyes-Montes JM, Young RP. 2008. CavingMechanics — Executive Summary, Itasca Consulting Group,Inc., Report to <strong>Mas</strong>s Mining Technology (MMT) Project, ICG08-2292-1-T9-12R2.vi
Bonded Particle Model for Jointed Rock <strong>Mas</strong>s<strong>Mas</strong> <strong>Ivars</strong> D, Pierce M, DeGagné D, Deisman N, Sainsbury B-A,Cundall PA, Darcel C. 2007. <strong>Mas</strong>s Mining Technology Project: Sixmonthly Technical Report, Sub-Project No. 4.2: Research and MethodologyImprovement & Sub-Project No. 4.3: Case Study Application,ICG07-2292-4-46-T4.<strong>Mas</strong> <strong>Ivars</strong> D, Pierce M, Cundall PA, Darcel C, Young RP, Reyes-Montes JM, Pettitt WS. 2007. <strong>Mas</strong>s Mining Technology Project:Six monthly Technical Report, Sub-Project 4.3: Case Study Application,ICG07-2292-14-Task 4-4.Pierce M, Cundall PA, <strong>Mas</strong> <strong>Ivars</strong> D, Darcel C, Young RP, Reyes-Montes JM, Pettitt WS. 2006. <strong>Mas</strong>s Mining Technology Project:Six monthly Technical Report, Sub-Projects 4.2: Research andMethodology Improvement & 4.3: Case Study Application,ICG06-2292-1-Tasks2-3-14.vii
<strong>Diego</strong> <strong>Mas</strong> <strong>Ivars</strong> TRITA LWR PHD 1058viii
Bonded Particle Model for Jointed Rock <strong>Mas</strong>sACKNOWLEDGEMENTSThe research presented in this thesis has been conducted in thelast four years. During that time a large number of people at theEngineering Geology and Geophysics Research Group in KTHand in Itasca Offices worldwide have contributed with their assistance,advice and support. If you are one of these people, pleaseaccept my utmost gratitude.I would like to express my most sincere gratitude to my main supervisor,Associate Professor Joanne Fernlund at the Royal Instituteof Technology (KTH) in Sweden, and to my secondary supervisor,Prof. Robert Zimmerman at Imperial College in London,UK, for their guidance and support throughout the duration of mystudies.The <strong>Mas</strong>s Mining Technology project (MMT) and the Large OpenPit (LOP) project are greatly acknowledged for sponsoring the developmentof the SRM method. Rio Tinto, Northparkes mine, Palaboramine and Bingham Canyon mine are sincerely acknowledgedfor providing data and assistance in the study casespresented in the thesis. Mr. Andre van As, from Rio Tinto, Dr.Alan Guest, and Professor Gideon Chitombo at the SustainableMinerals Institute in the University of Queensland, Australia, aregreatly acknowledge for their endless support and encouragementon the development and application of the SRM technology.I am deeply grateful to Professor Ove Stephansson at GeoForschungsZentrum(GFZ), Germany, and associate professor LanruJing, at the Royal Institute of Technology (KTH), in Sweden, forsupervising my previous studies and for introducing me to themeaning of research.I am deeply in debt to Dr. David O. Potyondy and Dr. MatthewPierce, my co-supervisors at Itasca Consulting Group, Inc. and toDr. Peter A. Cundall at Itasca Consulting Group, Inc. The countlesshours of fruitful discussions and arguments have marked thepace of the development and application of the SRM method.I am also deeply thankful to Dr. Eva Hakami at Itasca GeomekanikAB, for the trust in my work, the valuable advice, and the endlessencouragement during the whole duration of this work. She,together with my colleges Dr. Thushan Ekneligoda, Dr. HosseinHakami, Malin Johansson and Anna Termine, have heavily enduredmy own complaints about my research during countlesslunches and coffee breaks at work. I am thankful to all of them forcreating a very friendly and stimulating atmosphere in which towork.Mrs. Bre-Anne Sainsbury at Itasca Australia Pty Ltd, Dr. CarolineDarcel at Itasca Consultants SAS, Mr. Nathan Deisman at Universityof Alberta, Canada, Mr. David DeGagné at Itasca ConsultingGroup, Inc, Dr. Juan Reyes-Montes at Applied Seismology Consultants,UK, Professor R. Paul Young at Lassonde Institute, Universityof Toronto, Canada and Applied Seismology Consultants,UK, and Professor Charles Fairhurst at University of Minnesota,ix
<strong>Diego</strong> <strong>Mas</strong> <strong>Ivars</strong> TRITA LWR PHD 1058USA, are deeply thanked, for they are part of the reason why theSRM approach has been successful thus far.During these years, I have had many remarkable colleagues at theRoyal Institute of Technology (KTH) in Sweden. I thank all ofthem for making this experience an unforgeatable one. AssistantProfessor Ki-Bok Min at the College of Engineering, Seoul NationalUniversity, South Korea, and Assistant Professor TomofumiKoyama at Kyoto University, Japan, are sincerely thanked for theirfriendship and support in academic and personal matters.I wish to thank my parents and my brother. Without their support,love and trust this would have not been possible.Last but not least I would like to thank my wife, Julia, withoutwhom nothing of this makes sense.Stockholm, November 2009.<strong>Diego</strong> <strong>Mas</strong> <strong>Ivars</strong>x
Bonded Particle Model for Jointed Rock <strong>Mas</strong>sTABLE OF CONTENTAbstract ........................................................................................................................... iiiPreface .............................................................................................................................. vAcknowledgements ........................................................................................................ ixTable of Content ............................................................................................................. xi1. Introduction............................................................................................................ 11.1. Background .................................................................................................................. 11.2. Objective of the thesis ................................................................................................. 21.3. Disposition of the thesis .............................................................................................. 31.4. Extent and limitations of the thesis ............................................................................ 42. Literature review .................................................................................................... 53. Synthetic Rock <strong>Mas</strong>s components ...................................................................... 103.1. Intact rock representation ......................................................................................... 11Bonded –particle model ................................................................................................................... 11Scale effects ..................................................................................................................................... 12Resolution effects ............................................................................................................................ 153.2. Joint representation ................................................................................................... 15Smooth-joint Contact Model (SJM) .................................................................................................. 15Discrete Fracture Network (DFN) Simulation ................................................................................. 174. SRM sample generation and Testing ................................................................. 204.1 Sample generation ..................................................................................................... 204.2 Subjecting spherical SRM sample to non-trivial stress path .................................. 204.3 Subjecting a prismatic SRM sample to standard laboratory stress path ............... 264.4 Tracking plastic strains ............................................................................................. 295. Use of SRM to Characterize Rock <strong>Mas</strong>s Properties and Behavior .................. 315.1 Damage threshold, peak strength and modulus ..................................................... 315.2 Nature of damage and fracturing ............................................................................. 40General deformation, yield, failure and disintegration of SRM samples............................................. 40Slip on joints .................................................................................................................................... 41Fracture analysis .............................................................................................................................. 43Fragmentation ................................................................................................................................. 45Brittleness ........................................................................................................................................ 465.3 Anisotropy and scale effect ....................................................................................... 506. Discussion ............................................................................................................ 666.1 Input data ................................................................................................................... 666.2 Methodology .............................................................................................................. 67Intact rock calibration ...................................................................................................................... 67Primary fragmentation ..................................................................................................................... 676.3 Numerical aspects ..................................................................................................... 67Joint intersection and joint hierarchy ................................................................................................ 67Intact rock friction angle and tensile strength vs UCS ratio .............................................................. 69Fracture toughness........................................................................................................................... 717. Conclusions .......................................................................................................... 758. Recommendations for future work ..................................................................... 77References ...................................................................................................................... 79Apendix I ........................................................................................................................ 86Apendix II ...................................................................................................................... 91xi
<strong>Diego</strong> <strong>Mas</strong> <strong>Ivars</strong> TRITA LWR PHD 1058xii
Bonded Particle Model for Jointed Rock <strong>Mas</strong>s1. INTRODUCTION1.1. BackgroundThe caving mining method attempts to achieve rock mass disintegrationwithout blasting by relying instead on the induced stressredistribution around the unsupported opening. Predicting caveevolution is a challenging task. Successful use of the caving miningmethod requires an understanding of what is required to carry arock mass from peak to residual strength (i.e. post-peak behavior).Many of the factors that control post-peak behavior are a challengeto measure or estimate. The primary factors that describecaving mechanics are sketched in Figure 1 and include brittleness,modulus softening, dilation angle and bulking limit.To be able to predict caving, one has to be able to understand andpredict the evolution of the four distinct zones formed during theprocess (Figure 1, left):• Elastic zone: rock mass behavior and properties are thoseof an “undisturbed” rock mass. Induced stresses in thisregion may be high enough to affect infrastructure.• Seismogenic zone: microseismic (and sometimes seismic)activity will be concentrated in this region primarilydue to discontinuity damage (discontinuities going frompeak to residual strength) and the initiation of new fractures.• Yielded zone: the rock mass in this region surroundingthe cave is fractured and has lost some or all of its cohesivestrength and provides minimal support to the overlyingrock mass. Rock mass within the yielded zone will beElasticSeismogenicIn Situ StressDamage ThresholdElasticJoint SlipCrack GrowthYieldFailureAir GapCavedPeak StrengthResidual Strength50σ 1σ 3Cohesive/TensileWeakeningFrictionalStrengtheningDilation,BulkingModulusSofteningFully BulkedFigure 1. Mechanics of caving.0 101
<strong>Diego</strong> <strong>Mas</strong> <strong>Ivars</strong> TRITA LWR PHD 1058subject to significant damage i.e., open holes will be cutoff,TDRs (Time-Domain Reflectometer) will break, andcracking will be observable in infrastructure.• Mobilized zone: this zone gives an estimate of the portionof the orebody that has moved and may be recoverablewith continued draw.The results of a scoping study performed at the beginning of the<strong>Mas</strong>s Mining Technology project (MMT) (Cundall et al. 2005)concluded that current caving prediction methodologies, mostlyempirical and continuum in nature, would benefit from an improvedconsideration of the in-situ joint fabric (i.e., joint orientation,joint density and joint persistence) and a better understandingof the nature of fracturing as the rock mass deforms, fails anddisintegrates. Discontinuum modelling approaches are well suitedto this problem, allowing for the explicit consideration of the heterogeneousblocky structure of rock masses and to predict andtrack the fragmentation of these blocks.The Synthetic Rock <strong>Mas</strong>s (SRM) approach (Pierce et al. 2007; <strong>Mas</strong><strong>Ivars</strong> et al. 2007; <strong>Mas</strong> <strong>Ivars</strong> et al. 2008a) was therefore developedwithin the <strong>Mas</strong>s Mining Technology project (<strong>Mas</strong> <strong>Ivars</strong> et al.2008c). This project aimed at improving our understanding of themain factors influencing the successful operation of cave mines(cavability, fragmentation, gravity flow, draw control, and undercutand extraction level design).The scheme in Figure 2 presents the whole caving prediction methodology.It would be ideal to be able to produce a large scale threedimensionalSRM model of several km side length encompassingthe whole mine. Present computational limitations prevent thispossibility. Therefore the SRM approach is used as a virtual laboratoryfor jointed rock mass behavior characterization. The behaviorsobserved in the SRM tests, including brittleness, anisotropyand scale effect, are used to calibrate the constitutive behavior ofthe rock units encompassing the three-dimensional mine scalecontinuum model used for caving prediction (Sainsbury et al.2008a; Sainsbury et al. 2008b). As such, the SRM methodology isonly part of the whole SRM-UJRM (Synthetic Rock <strong>Mas</strong>s-Ubiquitous Jointed Rock <strong>Mas</strong>s) caving prediction methodology.1.2. Objective of the thesisThe objective of this thesis is the development and testing of arobust methodology, based on particle mechanics, for jointed rockmass characterization. The methodology should be able to considerexplicitly the effect of the in situ joint fabric. Special emphasishas to be placed on the prediction of not only the rock mass prepeakbehavior but also the post-peak behavior, one of the key factorsin cave mining.2
Bonded Particle Model for Jointed Rock <strong>Mas</strong>sJoint OrientationJoint Frequency &PersistenceSRM standard test suite(direct tension, UCS, triaxial)Cave-Scale ModelDiscreteFractureNetwork (DFN)Intact UCS,Tensile Strength,Y. Modulus& Poisson’s ratioSpherical - SRMCave-induced stressesFigure 2. SRM-UJRM Caving prediction methodology.Rock <strong>Mas</strong>sPropertiesPrimaryFragmentationInducedFracturing vs.microseismicityFLAC 3DUJRMcalibration1.3. Disposition of the thesisIn order to get an overview of this thesis a brief description of itscontents follows.The first part of the thesis is a brief background to introduce themotivation behind this thesis and its main objective.The thesis continues in chapter two with a literature review of thetechniques available for the characterization of jointed rock massbehavior. The aim is to identify what, in the opinion of the author,is missing in current practice, and to justify the development of anew methodology that can be used to incorporate those missingfactors in the future practice.Chapter three concerns the constituent components of a SRMsample; intact rock represented via the Bonded Particle Model forrock (Potyondy and Cundall, 2004) and in situ joint fabric generatedvia Discrete Fracture Network modelling and embedded intothe SRM samples with the smooth-joint contact model (<strong>Mas</strong> <strong>Ivars</strong>et al. 2008b).Chapter four presents the SRM testing environments, clearly statingtheir capabilities.Chapter five presents application examples highlighting the typeof output that can be generated during the application of the SRMapproach. The aim of this chapter is to show how the SRM approachcan be used to gain insight into different rock mechanicsproblems.3
<strong>Diego</strong> <strong>Mas</strong> <strong>Ivars</strong> TRITA LWR PHD 1058A discussion about the current limitations of the SRM approach ispresented in chapter six.Conclusions are presented in chapter seven, and chapter eightcontains a few suggestions for future work.1.4. Extent and limitations of the thesisThis thesis focuses on the Synthetic Rock <strong>Mas</strong>s (SRM) approach.This approach has been used in combination with the UbiquitousJointed Rock <strong>Mas</strong>s (UJRM) approach for prediction of caving.The UJRM approach is used to represent, in continuum terms, thebehaviors observed from the application of the SRM method. Thematerial dealing with the UJRM method and the combined SRM-UJRM methodology is out of the scope of this thesis and it istherefore presented elsewhere (Sainsbury et al. 2008a; Sainsbury etal. 2008b).Even though Discrete Fracture Network simulation is one of themain components of a SRM sample, the methodology followedfor the generation of a Discrete Fracture Network representativeof a site specific in situ joint fabric will not be discussed in detail,as this is an established technique that can be found elsewhere.4
Bonded Particle Model for Jointed Rock <strong>Mas</strong>s2. LITERATURE REVIEWRock masses are large volumes of rock that contain discontinuities.The behavior of a rock mass depends on the ensemble behaviorof the constituents, namely, intact material and discontinuities.The term “discontinuity” generally includes fractures, fissures,joints, faults and bedding planes; however, in this paper we willuse the term joint to designate pre-existing discontinuities and theterm fracture for newly formed discontinuities. Typical joints aresofter and have lower strength than the surrounding material; as aconsequence, their presence produces regions that are softer andweaker than the intact rock in which they are embedded (Figure3). Typical joints also form systematic patterns that produce regionswith anisotropic response. These joint attributes also inducea “scale effect”, whereby the stiffness and strength of a region decreasewith increasing region size up to the point at which a representativevolume is reached.Estimating rock mass behavior is one of the most challengingtasks in designing engineering structures in moderately to heavilyjointed rock. The characterization of jointed rock mass behaviorin the laboratory would require testing numerous large volumes ofrock of different sizes having a number of different known jointconfigurations at significant stress levels under different stresspaths. Undertaking such an experimental program would be prohibitivebecause of the required size of the laboratory testingequipment and the costs involved. Direct measurements by in situexperiments with samples of large sizes, although technically possible,are costly, frequently not large enough, and often involve uncertaintiesrelated to control of the boundary conditions and interpretationof results (Bieniawski, 1978).Due to the inherent difficulty in direct full-scale testing of a rockmass, progress in estimating the behavior of rock masses has beenσ?εFigure 3. Stress-strain curve of intact rock vs. rock mass.5
<strong>Diego</strong> <strong>Mas</strong> <strong>Ivars</strong> TRITA LWR PHD 1058slow, and reliance has been placed on empirical classification rulesand systems derived from practical observations (Bieniawski,1978; Barton et al. 1974; Barton, 2002; Hoek and Brown, 1997;Palmstrom, 1996a; Palmstrom, 1996b; Ramamurthy, 1993). Rock<strong>Mas</strong>s Classification (RMC) systems were developed for use in civiland mining engineering in response to the need for ways to ‘rank’a specific rock mass, based in large part upon the joints and theirweakening and softening effect on the rock. By compiling historiesof rock mass ranking relative to performance, it has beenpossible to develop relations for quantitative prediction of rockmass strength and modulus. RMC systems continue to evolve, andrecently Cai et al. (2004; 2007) proposed a new system (based onthe Geologic Strength Index (Hoek, 1994; Hoek et al. 1995)) thataccounts for the impacts of joint structure and joint surface conditionsin a more quantitative manner and allows for the determinationof residual strength parameters of jointed rock masses. Themethod relies on block size as a metric for interlock. In additionto estimating the peak strength of a rock mass, it is also necessaryto estimate the rate of its post-peak degradation and whether ornot residual state is reached. Despite the fact that RMC systemsand relations are in widespread use in engineering design, theirability to consider strength anisotropy (resulting from a preferredjoint fabric orientation), scale effect (resulting mainly from thecombined effect of joint density and joint persistence), and strainsoftening/weakening remains limited. Furthermore, their ability toconsider the effects of stress on rock mass deformability has onlyrecently been incorporated and is not well established (Deismanand Chalaturnyk, 2008).Numerous efforts have been made to find analytical solutions forestimating the macroscopic properties of jointed rock masses.These approaches consider the rock as the combination of twocomponents: intact rock and joints. In this manner, the global behaviorof the jointed rock mass can be derived assuming that itsresponse is the summation of each component behavior (intactrock and joints). The analytical solutions include cases with simplejoint system geometry such as stratified rock (Salomon, 1968),staggered joint sets (Singh, 1973), orthogonally jointed rockmasses (Amadei and Goodman, 1981), stratified orthorhombiclayers (Gerrard, 1982) and randomly jointed rock masses (Fossum,1985). These closed-form solutions are available only for regular,and often persistent and orthogonal joint systems. The exceptionis the crack tensor theory that has been applied to find anisotropicelastic properties with irregular joint systems of different sizes,orientations and mechanical properties (Oda, 1986). However, itdoes not consider the stress redistribution due to the existence ofdiscontinuities (i.e., without discontinuities the stress distributionis just uniform whereas the presence of discontinuities generatesareas of stress concentration/relaxation), which may have a significantimpact on the mechanical behavior of the rock mass, becausethe joint intersections are often the locations with largeststress and deformation gradients, damage and failure. Further-6
Bonded Particle Model for Jointed Rock <strong>Mas</strong>smore, analytical methods do not provide information about thepost-peak behavior of jointed rock masses.On the larger scale, the processes of discontinuous slip on jointsand fracture formation in intact rock regions between the jointsare complex (Fairhurst et al. 2007) and difficult to represent incontinuum terms. Results from laboratory model studies haveshown the many different failure modes in jointed rock masses aswell as the complex internal stress distribution of even rather simplejoint configurations Brown, 1970a; Brown, 1970b; Einsteinand Hirschfeld, 1973; Chappel, 1974; Kulatilake et al. 1997; Singhet al. 2002; Tiwari and Rao, 2006). Enhancing our understandingof such behaviors requires the use of discontinuum modelling soas to capture the essential nature of the fracturing and disintegrationbehavior. The relatively recent development of numericalmodels based on particle mechanics, as well as the remarkable advancesin computer power, allow detailed examination of suchphenomena. Numerical experiments can be conducted to simulatejointed rock masses, and to obtain considerable insight into theirconstitutive behavior.In recent years, discontinuum approaches based on the discreteelement method (DEM) using UDEC (Itasca, 2009) and 3DEC(Itasca, 2008c) have been used for the characterization of rockmass behavior (Kulatilake et al. 1993; Min and Jing, 2003; Min,2004). The embedment of non-persistent joints in UDEC and3DEC is an elaborate process that can be tedious and difficult ifthe joint network is densely populated. If the expected rock massfailure mechanism involves block breakage (which would be particularlyrelevant at small scales), the presence and propagation ofincomplete joints inside of large blocks (and, hence, the blockstrength) could have a significant contribution to rock mass behaviorand should not be eliminated. Currently block breakagethrough fracture growth can be simulated using UDEC, but not3DEC.Recently, a state of the art hybrid continuum–discontinuum techniquebased on the hybrid finite-discrete element method (FEM-DEM) (Munjiza et al. 1995) and fracture mechanics has been appliedon a two dimensional analysis of surface subsidence associatedwith cave mining (Vyazmensky et al. 2007; Vyazmensky etal. 2008). The analysis was performed using ELFEN (RockfieldSoftware Ltd.), an advanced numerical code originally developedfor the dynamic modeling of impact loading on brittle materialssuch as ceramics, but being increasingly used in rock mechanics.ELFEN is capable of simulating jointed media behavior with explicitrepresentation of in-situ jointing and rock block breakage.The finite element-based analysis of continua is merged with discreteelement-based transient dynamics, contact detection andcontact interaction dynamics (Munjiza, 2004). Failure bands candevelop between or within single elements, and when the load carryingcapacity across such bands decreases to zero, a fracturepropagates within the continuum finite element mesh. The meshis consequently updated and this results in the formation of a dis-7
<strong>Diego</strong> <strong>Mas</strong> <strong>Ivars</strong> TRITA LWR PHD 1058crete element rock fragment. By using a combination of Mohr-Coulomb yield function with a tension cut-off, Crook et al. (2003)could model brittle, tensile axial splitting fractures and more ductileshear fractures in ELFEN. At present the approach has beenmainly applied to two-dimensional problems and its computationalefficiency is limited by the number of initial joints it can incorporatedue to the necessarily fine mesh discretization.PFC 2D (Itasca, 2008a) and PFC 3D (Itasca, 2008b) had previouslyshown the ability to reproduce the essential, and more subtle, featuresof the initiation and propagation of fracturing in rocks andjointed rock masses (Potyondy and Cundall, 2004). Kulatilake etal. (2001) demonstrated the use of PFC 3D in modelling jointedrock block behavior under uniaxial loading. Their model geometrywas relatively simple, involving a few persistent through-goingjoints in a lab-scale sample. Park et al. (2004) created more denselyjointed two-dimensional rock mass models in PFC 2D by incorporatingup to 100 impersistent joints from a Discrete Fracture Networkinto a 30 m × 30 m block. The results from these simulationswere encouraging, allowing direct measurement of rock massstrength and brittleness. They also demonstrated that the numberof joints has a significant impact on the strain-softening behavior,changing from brittle to ductile with an increase in the number ofjoints. Plots of damage patterns in the models suggest that the degreeof fracturing internal to the rock blocks versus coalescence ofexisting joints plays a critical role in determining the brittleness. Itis also expected that the direction of loading relative to the joint fabricwill have a significant impact on brittleness. The advantage ofPFC is that it allows for consideration of block breakage, includingthe impact of incomplete (non-block-defining) joints on blockstrength and deformability (Figure 4). It was decided, consequently,that PFC 3D would provide a perfect vehicle to permit more rigorousstudy of the impact of joint persistence and orientation,nature of fracturing, and rock mass brittleness on caving behavior.This thesis presents the Synthetic Rock <strong>Mas</strong>s (SRM) approach(Pierce et al. 2007; <strong>Mas</strong> <strong>Ivars</strong> et al. 2007; <strong>Mas</strong> <strong>Ivars</strong> et al. 2008a).The SRM approach is based on distinct-element modelling as implementedin PFC 3D (Itasca, 2008b) and can be used to characterizethe mechanical behavior of jointed rock masses. This novelmethodology brings together two well-established techniques: theBonded Particle Model (BPM) for rock for the simulation of intactrock behavior (Potyondy and Cundall, 2004), and DiscreteFracture Network (DFN) modelling. This new technique can beused as a virtual laboratory to conduct numerical experiments toobtain qualitative and quantitative insight into the constitutive behavior(both pre- and post-peak) of rock masses. The SRM approachhas been developed to apply to rock masses at the scale of10-100 m. Consequently, factors that affect the rock mass behaviorat the grain-scale (e.g., grain size, mineralogical composition,metal content, porosity, pore structure, intergranular and graincleavage, etc.) are not addressed explicitly.8
Bonded Particle Model for Jointed Rock <strong>Mas</strong>sFigure 4. Three increasingly detailed views of a two –dimensional Synthetic Rock<strong>Mas</strong>s sample. The colors denote intact rock blocks bounded by joints. Notice the internalnon through-going jointing in the “intact” rock blocks.9
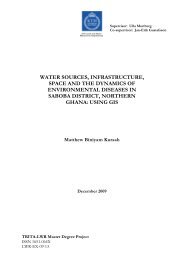
Bonded Particle Model for Jointed Rock <strong>Mas</strong>sFigure 7. Scale effect on uniaxial compressive strength of intact rock (after Hoekand Brown, 1980). Vertical axis is strength ratio normalized by strength of 50-mmdiameterspecimen.−( ) 0.18σc = σc.50 d / 50(1)where σ c.50 is the uniaxial compressive strength of a cylindrical specimenwith diameter d = 50 mm, and σ c is the uniaxial compressivestrength of a specimen with an arbitrary diameter, d (10–200 mm).Yoshinaka et al. (2008) note a similarity in the form of Hoek &Brown’s function to the relation between strength and volume ofa solid that may be derived from Weibull’s statistical theory:( / ) 1mσc = σc V V(2)0 0−where V is the volume of a specimen, m is a material constantcalled the Weibull modulus, and V 0 is the volume of a standardsizespecimen. In order to compare test results on samples ofshapes and sizes that differ from the standard 2:1 cylindrical coresample, Yoshinaka et al. suggest a scale effect equation that employsequivalent length, d e = V 1/3 , and an exponent, k = 3/m, asfollows:( d d )−kσc / σc⋅ 0 = e / e0(3)13
<strong>Diego</strong> <strong>Mas</strong> <strong>Ivars</strong> TRITA LWR PHD 1058joint model at all contacts between particles that lie upon oppositesides of the joint. The joint contact is described as smooth becauseparticle pairs joined by a smooth-joint contact may overlap and“slide” past each other, instead of being forced to move aroundone another (Figure 11). The effective joint geometry of a singlesmooth joint consists of two initially coincident planar surfaces.The two contacting particles are permanently associated with thetwo surfaces, one per side. During each time step, the relativetranslational displacement increment between the two particle surfacesis decomposed into components that are normal and tangentialto the joint surfaces. These components are multiplied by thesmooth-joint normal and shear stiffnesses to produce incrementsof joint force. The force-displacement law operates in the jointcoordinate system and provides either Coulomb sliding with dilation,or bonded behavior (i.e. joint cohesion and tensile strength).Figure 9. Traditional way of representing interfaces in particlebased models (“bumpy joint” in green).Figure 10. (a) Effective joint geometry, and (b) 3D specimen with frictionlessthrough-going joint loaded by gravity (the bottom red layer of particles is fixed)—large shearing motion results in the creation of new smooth-joint contacts along thejoint plane.16
<strong>Diego</strong> <strong>Mas</strong> <strong>Ivars</strong> TRITA LWR PHD 1058Networks can be generated by external software (Itasca, 2006a;Dershowitz et al. 1995) from the measured in situ joint data comingfrom sources like borehole logging, tunnel and outcrop scanlineor window mapping, and then imported into the SRM samplesto represent the joint network. In this manner, the rock blockstructure can be represented explicitly in the SRM samples. In caseswhere two or more joints intersect at a single contact, the propertiesand the orientation of only one of the joints (the first jointto be inserted) are assigned to the single smooth-joint contactmodel, effectively introducing a large asperity on the remainingjoint, or joints, that is controlled by the particle size. Asperities atjoint intersections have an infinite strength and a size that is afunction of particle size. The shear strength behavior of jointswith asperities needs further research and development.Joint termination, joint intersection and joint hierarchy must alsobe considered when constructing a DFN and embedding it withinan SRM sample. Joints are created by specific stress mechanismsassociated with geological events. These geological events generatesets of joints in different directions at different times. In nature,pre-existing nearby joints can modify the sizes and orientations oflater joints. Structural geologists study the cross-cutting relationsbetween different joint sets in order to determine their relativeage. A variety of rules have been established to help determine therelative age of joints. Early joints tend to be long, relatively continuousand infilled with vein material, whereas later joints are barren,abut against earlier ones and are consequently shorter(Hudson and Cosgrove, 1997) (Figure 12). In cases where a jointhierarchy is evident, this can be accounted for in the order of insertionof joints in the SRM sample. The first joint (or joint set)inserted will always be “continuous” in its entirety becoming dominant,while subsequent joints (or joint sets) intersecting the firstone will have large asperities in the shared contacts at the intersectionsand thus be “discontinuous”. In some sense, this is equivalentto Figure 12a and Figure 12c in which the secondary joint setis “discontinuous”. However, in the SRM sample the behavior inthe intersection will be controlled by the size of the asperity (i.e.the particle size). Joints terminating in other joints will also have alarge asperity of infinite strength in the shared contact which sizewill depend on the model particle size. If no data on joint hierarchyis available, or if there is no evidence of joint hierarchy,then the choice is made randomly, effectively mimicking a randomjoint hierarchy.18
Bonded Particle Model for Jointed Rock <strong>Mas</strong>s(a)(from Harries, 2001)(b)(from Harries, 2001)(c)(from Harries, 2001)(d)(from Hudson and Cosgrove, 1997)Figure 12. Joint interaction age determination rules (Harries, 2001): (a) where shearfractures cut and displace another discontinuity set, the discontinuity set that hasbeen displaced is obviously the older fracture set; and (b) where discontinuities terminateon other discontinuities, the discontinuity set that terminates is the youngerset and the discontinuity set that stops the other discontinuity from propagating isthe older discontinuity set. (c) Fracture network of the Holderbank quarry, and (d)fracture patterns in a limestone pavement at Lilstock, North Somerset, SW England.The older fracture sets are the most continuous and, as the sets become progressivelyyounger, they become less continuous and less well oriented.19
<strong>Diego</strong> <strong>Mas</strong> <strong>Ivars</strong> TRITA LWR PHD 10584. SRM SAMPLE GENERATION AND TESTINGThis section presents the procedures followed for the generationand testing of SRM samples. There are two SRM testing environments:spherical and prismatic. The spherical SRM environmentallows for the SRM to be subjected to any stress path and loadedthrough to complete disintegration, so that pre-peak properties(modulus, damage threshold, peak strength) and post-peak properties(brittleness, dilation angle, residual strength, fragmentation)can be measured. The potential power of the method is that it allowsfor site-specific consideration of loading conditions, materialproperty variations and in situ joint fabric and its evolution as the rockmass deforms, fails and disintegrates. By using the prismatic SRMtesting environment (also called the Standard Test Suite), SRMsamples of different sizes can be submitted to standard laboratorytests (UCS, triaxial loading, and direct tension tests) in differentaxial directions allowing for systematic and full rock-mass behaviorcharacterization, thereby capturing the effect of scale and anisotropyin a quantifiable manner.4.1 Sample generationOnce the microproperties of the BPM have been calibrated, intactrock samples of the desired size and shape are generated using theprocedures outlined by Potyondy and Cundall (2004) for the creationand testing of a parallel-bonded material. If the sample containsa large number of particles, it can be generated using theAC/DC logic (Billaux et al. 2004). The approach is based on theuse of a small unit of particles (called a “pbrick”) that can be generatedand brought to equilibrium quickly. The pbrick is generatedin a periodic cell and thus is special in that the geometrical arrangementof particles on one side is a negative image of that onits opposite side. Pbricks can be assembled to generate large intactSRM samples rapidly. Using this approach, SRM models containingapproximately one million particles can be created in a fewhours. After the large intact rock sample is generated, the insertionof the smooth joints from the appropriate DFN breaks the periodicnature of the system (see Figure 13).4.2 Subjecting spherical SRM sample to non-trivial stress pathThe behavior of a jointed rock mass is a function of the stresspath to which it is subjected (Martin et al. 1999a; Kaiser et al.2001; Cai, 2008). Consequently, for a given rock mass, excavationinduced failure and evolution of damage depends on the stresspath. The potential strain and stress path applied in standard laboratorytests (such as uniaxial or triaxial compression) attempt toemulate relatively simple loading conditions that may notrepresent the in situ conditions surrounding a cave (Figure 14).To be able to study the effect of non-trivial stress paths in jointedrock mass response making use of the SRM approach, a sphericalSRM environment has been developed (Pierce et al. 2007; <strong>Mas</strong><strong>Ivars</strong> et al. 2007). The spherical SRM environment allows a sphericalSRM sample to be submitted to complex stress paths that in-20
Bonded Particle Model for Jointed Rock <strong>Mas</strong>s(a) (b) (c)Figure 13. Pbrick sample generation logic: (a) small pbrick generated rapidly; (b)small pbricks combined to form intact periodic assembly; and (c) DFN inserted.volve changes in both magnitude and orientation. This is usefulfor characterizing strength, brittleness and fragmentation of therock mass when the in situ stress path is well known (or can be estimatedwith some confidence) and differs from those typicallyemployed in laboratory studies. This environment has proven particularlyrelevant to the study of cave mining, during which rockmasses are typically subject to increasing major principal stressand decreasing minor principal stress. Much of the rock is alsosubject to a rotation in principal stresses in both the pre- andpost-peak range. The success of the cave is strongly dependent onthe brittleness and fragmentation of the rock mass (Pierce et al.2007) and these properties are best measured under site-specificstress paths. The spherical SRM testing environment also providesinformation on the deformability and the peak and residualstrength envelopes, and can gauge sensitivity to quality/volume ofdata.In order to force a spherical SRM sample to undergo a realisticstress path corresponding to a desired engineering activity use ismade of the “strain probe” concept (Potyondy and Hazzard, 2004;Potyondy and Hazzard, 2008). The strain-probe logic permits controlof the velocities of particles on the boundary of a PFC 3Dspherical sample so that the boundary motion conforms to a specifiedstrain tensor that does not vary with position. Strain, ratherthan stress, is chosen as the controlling parameter to ensure stablebehavior in the post-peak range. Strain boundary conditions alsomore closely reproduce conditions in a large assembly than dostress boundary conditions (Cundall et al. 1982). A spherical sampleis used to eliminate the shape effects that would otherwise resultduring rotation of the principal strains, and to reduce thenumber of particles required to achieve a given material resolution.The strain-probe logic is described in Appendix I.21
<strong>Diego</strong> <strong>Mas</strong> <strong>Ivars</strong> TRITA LWR PHD 1058Laboratory conditionIn-situ condition(a)Figure 14. Stress state evolution in: (a) standard laboratory testing, and (b) in-situduring caving (Conventional laboratory stress or strain paths may not emulate whatis experienced in situ).Because the strain probe uses strain boundary conditions, a methodologyhas been developed to derive a strain path based on aninput stress path. The methodology allows for the compliance matrixand plastic strain, at desired locations along the stress path, tobe recorded, so that the developing anisotropy, inelastic behaviorand irrecoverable damage can be monitored.The spherical SRM testing methodology encompasses the followingsteps.Step 1: Deriving the compliance matrix of the SRM sample. The compliancematrix within the spherical sample is derived by applying aseries of strain perturbations and measuring the induced stressperturbations making use of the stress measurement procedurepresented by Potyondy and Cundall (2004) (the formal procedureto derive the compliance matrix is presented in Appendix II). Todecrease the simulation times during spherical SRM testing, weuse the full strain-application mode (or full-strain mode) of thePFC 3D strain probe (see Appendix I), whereby the velocities of allparticles are controlled to conform to a specified uniform straintensor. An equilibration stage occurs after each strain perturbationis applied. During the equilibration stage, the boundary particlesare fixed and the interior particles are freed and allowed to rearrangethemselves to accommodate the imposed strain field.(b)22
Bonded Particle Model for Jointed Rock <strong>Mas</strong>sTwo different types of compliance matrices can be obtained, dependingon whether or not elastic conditions are enforced duringthe strain excursions. If the particle friction coefficients and thebond strengths, as well as the smooth-joint contact friction coefficientsand smooth-joint bond strengths, are set to infinity, thenthe elastic compliance matrix can be obtained, which will be independentof strain magnitude. If the bond strengths and frictioncoefficients on particles and smooth-joint contacts are low enoughto fail, then the inelastic compliance matrix can be obtained,where the components can be dependent on the strain magnitudes,such that if the system is on the “yield surface”, then, ingeneral, a loading increment will produce a smaller componentthan an unloading increment. The inelastic compliance matrix willbe used to impose the desired stress path to failure to the SRMsample. The elastic compliance matrix will be used to track theplastic strain increments during softening (see section 4.4).Step 2: Installing in situ stress. The initial inelastic compliance tensor(calculated at point r in Figure 15) can be used to derive the firstfour or five strain tensor increments that need to be applied in orderto reach in situ stress (step n in Figure 15) as these incrementsshould not significantly change the compliance tensor becausethey do not cause any bond breakage or joint yield. This isachieved in the following manner:dε= Sσr+ 1 r r+1ij ijkl kl− εrij(4)rr+1where Sijklis the inelastic compliance tensor at initial state r, σklris the desired stress state at stage r+1, εijis the measured strainr+1tensor at stage r, and dεijis the incremental strain tensor thatneeds to be applied to the SRM sample in order to induce thestress state r+1.Step 3: Going from stress state n to stress state n+1 along the desired stresspath to failure. Once in situ stress state is reached (i.e. step n in Figure15), the SRM can then be advanced along the stress path thatwould be encountered during the desired engineering activity. Thesame procedure followed for achieving in situ stress is then appliedin order to advance from one stress state to another along thestress path. Consequently, the necessary incremental strain tensorsare determined in the following manner:dε= Sσn+ 1 n n+1ij ijkl kl− εnij(5)nSijklis the inelastic compliance tensor at state n,wheredesired stress state at stage n+1,at stage n, andn+1σklis thenεijis the measured strain tensorn+1dεijis the incremental strain tensor that needs to23
<strong>Diego</strong> <strong>Mas</strong> <strong>Ivars</strong> TRITA LWR PHD 1058StrengthEnvelopetσ 1t+1n+1Empirical DamageThreshold (Diederichs, 1999)[ 0.3to 0.] ∗UCSlabσ 1 − σ 3=4n21rσ 3Figure 15. Stress path to failure and disintegration followed byspherical SRM sample.be applied to the SRM sample in order to induce the desired stressstate n+1.Step 4: Stress control. Rock masses exhibit damage and seismicitywell before peak strength is reached. Diederichs (1999) discussesthis in great detail, and provides evidence of a damage threshold( σ 1 −σ3 = [0.3 to 0.4] ×UCSlab). Even in the pre-damage thresholdregion, the compliance of the SRM will change continuouslywith applied strain due to small particle rearrangement and jointdisplacement. Therefore, at each step n along the desired stresspath, the inelastic compliance tensor is measured and used to predictthe incremental strain tensor that needs to be applied in orderto reach the next desired stress state (Figure 15).Along the stress path, pre-existing joints will slip, and new internalcracks will form and propagate. These internal cracks will interactwith each other and with the pre-existing joints, changing thestiffness response of the SRM and weakening it. As a consequence,the imposed (measured) stress field will not exactly matchthe target stress field.To ensure that the stress field achieved is within a reasonable toleranceat each intended stress step of the desired stress path, the( n+1) actual stress response σ ′ijof the SRM sample is measured oncethe necessary incremental strain field has been applied. Then the( ) ′n+1σijn+1measured stress state σijis compared with the intendedto determine if the difference lies within an acceptable tolerance.24
Bonded Particle Model for Jointed Rock <strong>Mas</strong>s( ) ′n+1A proposed method to check if σ is within an acceptable to-n+1lerance of σijis through comparison of each individual stresscomponent. This can be achieved through the criterionijσ n+1 (n+1)′ij −σ ijσn+1ij< tol , (6)where each stress component is evaluated individually and comparedto a tolerance, tol.An alternative tolerance measure can be employed through thecalculation of the third stress invariant:σxxzxσxyzyσxzI3 = σyxσyyσyz(7)σ σ σzzThe measure of tolerance could then be calculated throughI3 − I 3′I3< tol , (8)wheren+1(n+1)′I3= σijand I 3 ′ = σ ij .If the measured stress state complies with the tolerance criterion,the next stress increment along the intended stress path can beimposed on the system. Otherwise, the strain increment taken istoo large and has significantly damaged the SRM sample. Subsequently,the present compliance tensor no longer is able to acceptablydefine the stress-strain behavior of the SRM sample oversuch a large strain increment. In this case, the present desiredstress field increment will be reduced in the following manner:∆σ ijn+1/ 2 = 1 2 (σ ij n+1 −σ ij n ) (9)σ ijn+1/ 2 = (∆σ ijn+1 2 + σ ij n ) (10)At this point, the stress path discretization should be resetn 1 +1/ 2through σ+ = nijσij, and the necessary strain field increment toachieve this new stress field recalculated. The system will be restoredto the state before the too-large strain field was applied and25
<strong>Diego</strong> <strong>Mas</strong> <strong>Ivars</strong> TRITA LWR PHD 10580.0E+00Octahedral Shear Stress, (toct, J2)0.0.E+00 2.0.E+06 4.0.E+06 6.0.E+06 8.0.E+06 1.0.E+07 1.2.E+07 1.4.E+07 1.6.E+07-5.0E+06Mean Stress (I/3)-1.0E+07-1.5E+07-2.0E+07-2.5E+07Intended Stress StateActual Stress StateFigure 16. Example of intended stress path vs. actual stress path followedby a spherical SRM sample in terms of mean stress vs. octahedral shearstress (units are in Pascal).the new and smaller strain field increment is applied. Figure 16shows an example of intended and actual stress path followed by aspherical SRM sample.Step 5: Straining to residual strength. Moving towards the failureenvelope (step t in Figure 15), once the stress state has surpassedthe damage threshold proposed by Diederichs (1999), significantdamage will begin to occur and accumulate in the SRM sample(i.e. significant joint slip, cracking and dilation begin). At thispoint,S will begin to change noticeably with damage (plastictijklstrain accumulation) and the “stress control” proposed procedurewill be needed to ensure arrival at the desired stress state throughthe chosen stress path. Once the peak strength is reached, theSRM samples must be driven through a softening or hardeningpath in a trial an error fashion through direct control of the inputincremental strain tensor and its response at each step.4.3 Subjecting a prismatic SRM sample to standard laboratory stresspathNumerous laboratory studies performed using physical modelshave shown that preferred rock mass joint fabric orientation caninduce marked anisotropy (Singh et al. 2002; Tiwari and Rao,2006). Rock mass behavior can exhibit a significant scale effectbecause larger volumes contain more blocks, which provide greaterfreedom to develop failure mechanisms. In a similar way, small-26
Bonded Particle Model for Jointed Rock <strong>Mas</strong>ser volumes of rock must involve intact rock failure, thus increasingthe overall strength, whereas larger volumes are more likely tocontain through-going pathways comprised of existing joints,which supply a weakening and softening effect. Overall failure ofrock masses involves failure of intact material and failure on discontinuities;rock bridges must break. Consequently, stability predictionsof engineered rock structures must be based on the ensemblestrength.Rock mass scale effect and anisotropy are site dependent. The degreeof strength reduction and the softening effect with size aregoverned by such factors as joint frequency and joint length, intactrock and joint mechanical properties. Rock mass anisotropy iscontrolled by the joint geometrical configuration, intact rock andjoint mechanical properties. To obtain conclusive results forjointed rock mass mechanical characterization, many large volumesof rock, with different known joint configurations andproperties should be tested at significant stress levels under differentstress paths. Such an experimental program is impractical tocarry out because it would be difficult, time consuming, and veryexpensive. Numerical simulation offers an attractive alternative.With this in mind, a second SRM testing environment, termed theSRM Standard Test Suite, has been developed (<strong>Mas</strong> <strong>Ivars</strong> et al.2008a).Three industry-standard tests, a direct tensile test, a uniaxial compressivestrength test, and a triaxial test, have been selected toprovide measures of rock-mass tensile strength, unconfined compressivestrength, and compressive strength at several confinementlevels. This ensures that the material constitutive propertiesderived from this technique are not specific to one particularstress path, and may be applied to a number of different largescalemining/geological processes. This set of standard tests canbe performed on parallelepiped SRM samples of different sizes,and in different axial directions. In this manner, the SRM StandardTest Suite for PFC 3D allows for systematic and full rock-mass behaviorcharacterization, capturing the effect of scale and anisotropyin a quantifiable manner (<strong>Mas</strong> <strong>Ivars</strong> et al. 2008a).The SRM Standard Test Suite uses parallelepiped SRM samples.As their spherical counterpart, these samples are formed of intactrock (represented via the BPM for rock (Potyondy and Cundall,2004)) and a DFN formed of individual joints represented via thesmooth-joint contact model (<strong>Mas</strong> <strong>Ivars</strong> et al. 2008b; Potyondy etal. 2010).Once SRM parallelepiped specimens are ready, they are submittedto numerical simulations of direct tension, unconfined compression(UCS) and triaxial compression at different confinement levels.In order to make test simulation times reasonable, instead ofusing the standard platen velocity-based testing procedure (Itasca,2008a; Itasca, 2008b), the novel, more rapid-loading methodologytermed full-strain (full strain-application mode), previously introduced,has been used. In this case this approach assigns linearly27
<strong>Diego</strong> <strong>Mas</strong> <strong>Ivars</strong> TRITA LWR PHD 1058varying (face to center) axial velocities to all specimen particlessuch that they achieve a very small, defined degree of axial strainover a specified number of model calculation steps (e.g. one step).In this way, particle strains occur more rapidly, because fewer calculationsteps are required. In this case, small subsets of particlesat the top and bottom regions of the specimen form the “grips”.After each induced strain stage, the “grip” particles are not allowedto displace, whereas the “non-grip” (internal) particles arefreed (with zeroed velocities) and the system is cycled until staticequilibrium is re-established, permitting the model to respond naturally.This process is repeated until the residual state is reached.The inherent rough nature of the walls of the periodically generatedSRM does not allow the use of boundary walls to apply confinementto the sample. The constant confinement in the triaxialtests is achieved by applying the necessary force to the particleslocated within a “skin-sleeve” region surrounding the specimen.The skin sleeve is elastic and softer than the rock mass sample,similar to the rubber membranes used in the laboratory, allowingfor large deformations to occur. Using the full-strain approach, ithas been demonstrated that model run-times can be decreased byup to a factor of ten. A schematic of the full-strain concept, togetherwith a comparison between a UCS test conducted on an intactrock sample using the standard boundary-based strain testing procedureand the new full-strain method, is shown in Figure 17. Thecurve obtained with the full-strain method can be further refined byincreasing the number of steps over which the velocity is appliedto the particles (e.g. ten steps rather than one). It is important tonote that this is only valid when applying very small strain increments(e.g. 5×10 -5 ). The magnitude of the maximum applicablestrain increment will depend on the strength and stiffness of theSRM specimen being tested. Parallelepiped samples with an aspectratio of 2:1 are used to minimize the frictional effects caused byboundary “grip” particles.WALL SERVOFULL STRAIN180160140Y-Axial Stress (MPa)1201008060(a)(b)402000.0000 0.0005 0.0010 0.0015 0.0020 0.0025 0.0030 0.0035 0.0040Y-Axial Strain(c)Wall ServoFulll StrainFigure 17. (a) Wall servo (boundary-strain-based) UCS testing with particle velocityvectors being applied under load; (b) full-strain UCS testing with particle velocityvectors being applied under load (The red particles form the “grips”.); and (c)stress-strain curve during a UCS test using the standard PFC 3D boundary-basedstrain application (blue) and the corresponding one using the new full-strain method(red).28
Bonded Particle Model for Jointed Rock <strong>Mas</strong>s4.4 Tracking plastic strainsIncremental and total plastic strains can be tracked within an SRMsample during testing. To obtain a measure of the plastic strain incrementthat has occurred from ε toε (Figure 15), the particlefriction coefficient and the bond strengths (normal and shear), aswell as the joint friction coefficient and joint bond strengths of theSRM sample at stage t are set to infinity to make the sample behavefully elastically. The strain perturbation procedure (AppendixII) is then applied to obtain the fully elastic compliance tensor atstage t,StEijkltijt+1ij, using the following expression:∆ ε = ∆(11)tEijSijklσklThe fully elastic compliance tensor is then used to determine thefully elastic strain increment required to achieveσ :t+1ij( t+1 ) E tE ( t+1)Edε = S dσ(12)ijijklijwheredσ( t+ 1) E ( t+1) E ( t )ij= σij−σij(13)The classical theory of plasticity states that the total strain is asummation of the plastic and elastic strain. The elastic strain incrementand the total strain increment from step t to step t+1 areknown. Therefore, we can determine the plastic strain incrementgoing from t to t+1 using the following expressions:dε = dε+ dε(14)ijEijPij( t+1 ) P ( t+1) ( t+1)Edε = dε− dε(15)ijijij( )Pt+1t+1where dε ijprovides the increment of plastic strain and dεijis the total strain increment between t and t+1.Accumulated plastic shear strain (more specifically, the second invariantof the deviatoric plastic strain tensor, γ p ) is a common metricfor irreversible shear strains in geomaterials (see section onBrittleness in section 5.2). In a more general sense it can be consi-( )29
<strong>Diego</strong> <strong>Mas</strong> <strong>Ivars</strong> TRITA LWR PHD 1058dered as a measure of damage. Accumulated plastic shear straincan be obtained through Eq. 16:γ p ⎡= 1 ⎛⎜6 (ε xxp p−ε yy)2 p p+ (ε yy −εzz ) 2 p p+ (ε zz −εxx)2 p+ (ε xy)2 p+ (ε yz ) 2 p+ (ε xz )2⎞⎤⎢⎟⎣ ⎝⎠ ⎥⎦1 2 (16)Note that all the strain components are plastic strain components.30
Bonded Particle Model for Jointed Rock <strong>Mas</strong>s5. USE OF SRM TO CHARACTERIZE ROCK MASS PROPERTIESAND BEHAVIORThe unique capabilities of the SRM approach make it a valid candidateto study a number of challenging rock mechanics problems.This section presents illustrative application cases showing howthe SRM approach has been applied in a qualitative and quantitativemanner to improve our understanding of rock mass behavior,and particularly of caving mechanics.5.1 Damage threshold, peak strength and modulusThe spherical SRM testing methodology, presented in section 4.2,has been used to characterize the caving behavior of differentrock domains at Rio Tinto’s Northparkes E26 mine in Australia(Pierce et al. 2007). Lift 2 of the E26 orebody is being minedthrough block caving. In block caving, a horizontally oriented tabularslot (or undercut) is blasted to produce fracturing and disintegrationin the overlying rock mass induced by shear yield (fromhigh horizontal stresses) or tensile yield (from gravity). As thefractured rock is drawn from the undercut, the cave grows upwardand will continue to do so as long as shear and/or tensile yield inthe cave back is sufficient to prevent the formation of a stablearch. The undercut level at Northparkes Lift 2 is located at adepth of 830 m and is approximately 200 m in diameter. Asshown in Table 1, the rock mass domains for characterizationwere defined according to lithology and location relative to theadvancing cave (which controls the stress path).The intact rock properties for the four lithologies in Lift 2 wereobtained from standard uniaxial compression tests on 5 cm diametercore samples and then scaled to account for the average insitu rock block size. An approximate measure of the average rockblock size in Lift 2 was obtained from the mean joint spacing,which is approximately 20 cm. According to the empirical relationdeveloped by Hoek and Brown (1980), a 20 cm diameter specimenshould have a UCS that is approximately 80% that of a 5 cmdiameter specimen. Based on these guidelines, the laboratorymeasuredintact rock strengths were multiplied by 80% to obtain atarget rock block strength for the SRM samples. These target values,along with the target moduli and Poisson’s Ratios are listed inTable 2.Table 1. Geomechanical domains at Northparkes E26 Lift 2.DomainIDLithology Location Elevationabove Lift 2UndercutMining stage1 Volcanics Back 50m Early undercutting2 BQM SE Haunch 100m Late undercutting3 QMP Back 100m Late undercutting4 QMP Back 200m Early draw5 Diorite NW Haunch 200m Early draw31
<strong>Diego</strong> <strong>Mas</strong> <strong>Ivars</strong> TRITA LWR PHD 1058Table 2. Target (Lab) and calibrated (Cal.) intact rock block properties forthe four lithologies (Northparkes Lift 2).VolcanicLab* CalQMPLab* CalBQMLab* CalMean Measured UCS (MPa) 99 115 144 81Estimated Rock-BlockStrength* (MPa)DioriteLab* Cal79.2 80 92 93 115 116 64.8 64Young’s Modulus, E (GPa) 64.2 64 62 63 61 61 59 59Poisson’s Ratio, v 0.26 0.26 0.24 0.25 0.26 0.26 0.37 0.36*Scaled Lab. UCS (80%) to account for the average in situ block size.Using the procedures outlined by Potyondy & Cundall (2004) forcreation and testing of parallel-bonded material, a series of uniaxialcompression tests were conducted on 1m diameter × 2 m longcylinders of PFC 3D material to obtain a match to the target properties.In order to minimize particle size effects, the particle sizeused in the simulated tests was the same as that used in the SRMsamples. The UCS, modulus and Poisson’s ratio values obtainedfor the PFC 3D material are listed in Table 2.Using the calibrated microproperties listed in Table 3, a 12 m diameterspherical assembly, containing roughly 255,000 bondedparticles with a uniform distribution in diameter from 12.4 to 20.6cm, representing solid intact rock, was constructed for each of thefour lithologies. This sample size was considered large enough tobe representative of the rock mass under consideration but smallenough to ensure rapid solution times.Discrete Fracture Networks (DFNs) were developed for theNorthparkes lithologies from both borehole and tunnel scanlinemapping information using 3FLO (Itasca, 2006a). The jointing isstatistically similar among the domains and so a single DFN wasproduced as base case for use in the SRM samples.Table 3. Microproperties used in PFC 3D for the four lithologies (NorthparkesLift 2).Volcanics QMP BQM DioriteParticeprope-Density(kg/m 3) 4109 4109 4109 4109Particle contact modulus (GPa) 72 64 68 98Ratio of particle normal to shear stiffness (kn/ks) 2.85 2.5 2.61 6.67Particle friction coefficient 2.5 2.5 2.5 2.5Parallel bondpropertiesParallel-bond radius multiplier 1.0 1.0 1.0 1.0Parallel bond modulus (GPa) 72 64 68 98Ratio of parallel-bond normal to shear stiffness 2.85 2.5 2.61 6.67Mean value of bond normal strength (MPa) 79 80 110 69Standard deviation of bond normal strength (MPa) 15.8 16 22 13.8Mean value of bond shear strength (MPa) 79 80 110 69Standard deviation of bond shear strength (MPa) 15.8 16 22 13.832
Bonded Particle Model for Jointed Rock <strong>Mas</strong>sThe DFN volume of study, whose center corresponds to that ofthe SRM sphere, was made large enough (cube of 15 m sidelength) to allow transfer of joint geometries to the SRM samplewithout introducing boundary truncation effects. The joint orientationdistribution used in the DFN production process is shownin Figure 18a. Subvertical jointing is clearly predominant, with apreferred orientation striking roughly East-West.(a)(b)Figure 18. (a) Stereonet of poles to joint planes from borehole loggingand mapping within Lift 2. (These orientations are used as inputto the DFN generation process and are considered representativeof all domains). (b) Two-dimensional (E-W) vertical section (15m × 15 m) through the DFN used in the Northparkes Lift2 SRMsamples.33
<strong>Diego</strong> <strong>Mas</strong> <strong>Ivars</strong> TRITA LWR PHD 1058The goodness of fit of the DFN, both in terms of joint densityand persistence is controlled by performing scanline “mapping”on the simulated DFN traces in the same manner as in the in situmapping campaign. As shown in Figure 19, the match betweenjoint frequencies between the mapped and simulated joint traces isexcellent.The in situ jointing at Northparkes Lift 2 is characterized by apredominance of joints of short length (i.e. joints larger than 3 mdiameter count for approximately 5% of the total 20.225 jointswithin the DFN volume of study (15 m), and their mean diameteris 7.6 m). Because of the relatively low number of large joints andin order to avoid the scenario in which a single large persistentjoint dominates sample behavior, all joints with a diameter largerthan 3 m were excluded from the SRM sample. These larger jointswere accounted for within the larger mine-scale model employingSRM-based properties.The properties assigned to the smooth-joints (see Table 4) werebased on assessment of the roughness and planarity of the jointsin Lift 2. No information on joint hierarchy was available, so thejoint insertion order was random, effectively mimicking a randomjoint hierarchy.Once the jointed synthetic rock mass samples were generated,they were subjected, making use of the full-strain approach (seeAppendix I), to stress paths that are representative of the changesin stress orientation and magnitude that accompanied caving atNorthparkes. The expected induced stress changes at various locationsrelative to the cave were obtained from a mine-scale contiFigure 19. Comparison between joint frequencies measured in situat Lift 2 and in the simulated DFN (average of 40 simulations).34
Bonded Particle Model for Jointed Rock <strong>Mas</strong>sTable 4. Estimated joint properties in SRM samples (NorthparkesLift 2).Friction angle (degrees) 30Cohesion (MPa) 0Normal stiffness (GPa/m) 150Shear stiffness (GPa/m) 30nuum model in FLAC 3D (Itasca, 2006b) in which cave advance issimulated through an imposed draw at the undercut level. The farfieldstresses in Lift 2 are outlined in Table 5. The induced stressfield is governed by the location relative to the cave and thesize/shape of the undercut/cave at the stage of interest. An exampleof the stress-change estimates obtained from the continuumnumerical model is shown in Figure 20.Although the samples from each domain experience the same basicstress path (simultaneous increase in Sigma1/Sigma2 and decreasein Sigma3), there are distinct differences in the stresschanges at each location. The first difference relates to the actualorientation of the principal stresses, which is governed by theshape of cave back in that particular domain. Sigma1 must remainparallel to the cave back; thus, in the haunches of the cave (as inDomains 2 and 5), Sigma 1 rotates upward and azimuthally towardthe centre of the cave from its initial horizontal orientation.This is indicated in Figure 20 by the significant changes in shearstress at these locations. In contrast, Domains 1, 3 and 4 experiencevery little rotation in principal stresses, as they lie above relativelyflat portions of the undercut and cave (see Figure 21).The second main difference is seen in the ratio of Sigma 1 to Sigma2. Domain 1 experiences a high ratio, as, in early undercutting,the long narrow profile of the undercut (oriented N-S) promotes alarger increase in E-W stresses (Sigma 1) than N-S stresses (Sigma2). As the undercut is advanced, however, the aspect ratio approaches1, and increases in Sigma 1 and Sigma 2 are more equal.As a result, Domains 3 and 4 (positioned further to the east) experiencemuch lower ratios of Sigma 1/Sigma 2. This is illustrated inFigure 22. Because most of the structure in Lift 2 is verticallyoriented, this ratio plays a critical role in governing which structuresexperience slip and shear under the increasing stresses abovethe undercut and cave back, as will be demonstrated later.Table 5. Far-Field Stresses at Northparkes Lift 2.Stress Trend (°) Plunge (°) Magnitudeσ 1 290 0 0.065 MPa/m (2.40 * σ 3)σ 2 200 0 0.04 MPa/m (1.49 * σ 3)σ 3 0 90 0.027 MPa/m35
<strong>Diego</strong> <strong>Mas</strong> <strong>Ivars</strong> TRITA LWR PHD 1058Stress Magnitude (MPa)Stress Magnitude (MPa)Stress Magnitude (MPa)Stress Magnitude (MPa)Stress Magnitude (MPa)sxxsyyszzsxysxzsyzFigure 20. Estimates of undercut/cave-induced stress changes at sample locationswithin each domain (from Northparkes Lift 2 continuum large scale model).A total of nineteen domain-specific Synthetic Rock <strong>Mas</strong>s (SRM)samples were created and tested in PFC 3D . This includes five basecasesamples (one for each domain) and fourteen samples for sensitivityanalysis. Each test, involving application of a completestress path on a single SRM sample, took approximately fortyeighthours to complete on a single-processor 3-GHz PC. Resultsfrom the base-case tests as well as some results form the sensitivityanalyses are discussed in the following paragraphs.36
Bonded Particle Model for Jointed Rock <strong>Mas</strong>sPFC samples of interestin each stageFigure 21. SRM sample locations relative to the main stages of mining defined(Northparkes Lift 2 study case).Figure 22. Sigma1/Sigma2 ratio in the back of as a function of mining stage. (Thisratio is higher in early undercutting (at Location 1 in Volcanics — location andtrend in green) than late undercutting and early draw (at Locations 3 and 4 inQMP — location and trends in blue and orange, respectively)) (Northparkes Lift 2study case).37
<strong>Diego</strong> <strong>Mas</strong> <strong>Ivars</strong> TRITA LWR PHD 1058The onset of damage in all SRM samples occurred well beforepeak strength was reached, and was indicated by joint slip and thebreakage of inter-particle bonds, also referred to as cracks. Afterapproximately 1000 cracks (< 1 % of the total number of cracksthat ultimately develop within the sample), the samples began todilate and deviate from the desired stress path (due to changes incompliance). As shown in Figure 23 and Figure 24 , there is goodcorrespondence between this point and the lower limit of the empiricaldamage threshold criterion discussed by Diederichs (1999):σ 1 = σ 3 + [0.3 to 0.4]UCS lab (17)Figure 23 also shows how a second stress path was used to intersectthe peak strength envelope for the SRM material and to softenit to its residual state. More SRM tests could be conducted tobetter define the shape of the envelope, particularly at low stressvalues, so that the tensile strength can be better defined.Following the procedure outlined in Figure 23 the peak and residualstrength envelopes of all the rock domains were obtained (seeFigure 24). Empirical approaches generally only estimate an isotropicmodulus or a ‘directional modulus’ and do not directly accountfor non-linear behavior from the effects of stress, damageFigure 23. Stress paths, fitted peak-strength envelope and damage threshold observedin SRM sample of Domain 5 at Northparkes Lift2.38
Bonded Particle Model for Jointed Rock <strong>Mas</strong>s(a)Figure 24. Stress paths, fitted peak-strength envelope and onset of damage(1000 cracks) observed in SRM sample tests from: (a) Domain 2 (BQM in SEhaunch of late undercut) and (b) Domain 3 (QMP in back of late undercut).(The empirical damage threshold also is plotted for comparison to predictedonset of damage).(b)or joint closure. Making use of the spherical SRM testing methodologythe full elastic/inelastic compliance matrix can be easily derivedat any stage along the stress path giving account of modulussoftening, developing anisotropy and non-linearity.39
<strong>Diego</strong> <strong>Mas</strong> <strong>Ivars</strong> TRITA LWR PHD 10585.2 Nature of damage and fracturingGeneral deformation, yield, failure and disintegration of SRM samplesJointed rock masses consist of joints and intact rock. Therefore,being able to monitor slip on joints and fracture of intact rock inducedby the stress path can help to improve our understandingof rock mass failure mechanisms. Using the SRM approach, shearslip in the pre-existing joints, propagation, interaction and coalescence,as new cracks are developed in the sample can be monitoredat any stage during the stress path to failure, and used to understandthe behavior of the rock mass as it deforms, yields, failsand disintegrates.The basic behavior observed during testing of the base case SRMsamples from each of the five domains can be outlined as follows:1. elastic deformation (initial stress changes are accommodatedelastically, with no joint slip or fracture formation);2. joint slip (eventually, the stresses reach a level that permitsslip on a small subset of joints within the sample);3. initial fracture development (tensile stresses develop at thetips of slipping joints, allowing wing cracks to form. These wingcracks are initially short in length and isolated from one another.The formation of a wing crack from a pre-existing flaw or fractureis illustrated in Figure 25. The tendency is for wing cracks tostart on the side of the crack tip in tension, and then to propagatein the direction of σ 1 . This is a very robust mechanism that canbe demonstrated clearly in a simple PFC 2D model of rock (withFigure 25. Wing crack growth mechanism and orientation relativeto principal stresses.40
Bonded Particle Model for Jointed Rock <strong>Mas</strong>sembedded fracture) subject to unconfined compression (Figure26));4. fracture coalescence (with continued straining, the wingcracks coalesce to form large-scale macro-cracks.); and5. sample disintegration. (the macro cracks ultimately dividethe sample into a number of large blocks that slip relative to oneanother and subdivide further as the sample is strained.Slip on jointsThe previous section outlined the common behavior observedduring testing of the base case SRM samples from each of the fivedomains in Table 1. The following paragraphs describe the differencesbetween them.Slip on in situ joints was monitored during the Northparkes SRMspherical tests described in the previous section. A small subset ofjoints was found to be slipping at the point of intersection withthe failure envelope (peak strength). By plotting the poles to theseslipping joints on a stereonet, it is possible to see the impact ofdiffering stress magnitudes and orientations relative to the jointfabric (Figure 27). The differences observed are attributed to theevolving shape of the undercut.• In early undercutting (Domain 1), joints of both intermediateand sub-vertical dip are slipping (peaks atdip/dd=46/350 and dip/dd = 74/252 respectively). Slipon the intermediate dipping joints is encouraged by theirorientation relative to σ 1 (horizontal) and σ 3 (vertical). Slipon the sub-vertical joints is encouraged by the increasedratio of σ 1 /σ 2 in the horizontal plane that results from thehigh aspect ratio of the undercut (see Figure 22).Figure 26. Wing crack development in simulated UCS test onPFC 2D material (σ 1 vertical). Smooth-joint in black and wingcracks in red.41
<strong>Diego</strong> <strong>Mas</strong> <strong>Ivars</strong> TRITA LWR PHD 1058• In the haunch during late undercut, Domain 2 exhibits slipprimarily on vertically oriented joints (peaks atdip/dd=87/354 and dip/dd = 76/146. This is encouragedby the rotation of σ 1 relative to the dipping cave back inthis domain.• In later undercutting and early draw (Domains 3 and 4), itis primarily joints of intermediate dip that are slippingDomain 1 (Volcanics aboveearly undercut back)Domain 2 (BQM in SEhaunch of late undercut)Domain 3 (QMP in backof late undercut)Domain 4 (QMP inback of early cave)Domain 5 (Diorite in NWhaunch of early cave)Figure 27. Stereonet plots of poles to joints slipping in the SRMsamples after the onset of damage (Northparkes Lift 2 study case).The legend is the same for all the pole plots.42
Bonded Particle Model for Jointed Rock <strong>Mas</strong>s(peaks at dip/dd=49/348 and dip/dd = 50/347 respectively).In this case, slip on the sub-vertical joints (whichwas observed in early undercutting) is inhibited by the lowaspect ratio of the undercut, which keeps the ratio of Sigma1/Sigma 2 at lower levels (see Figure 22).• In early cave, Domain 5 exhibits slip on both horizontaland vertical structures. This is attributed to the stress rotationwithin the NW haunch that promotes slip on a widerrange of joints.Fracture analysisNew fracture development within the SRM samples is indicatedby the breakage of inter-particle bonds, also referred to as cracks.By the end of each of the Lift 2 SRM tests, samples exhibited over100,000 cracks. Because of the large number of cracks and thepresence of a significant number of isolated (non-interacting)cracks, it is very difficult to track the evolution and orientation offracture coalescence within the sample through 3D computer visualizationand analysis with the unaided eye.Microseismic monitoring was used in Lift 2 to track the progressionof the seismogenic zone that marks the leading edge of theupward advancing cave (see Figure 1). Slip on pre-existing jointsand the new fracture growth patterns developed within the SRMsamples during testing can be correlated with observations on slipon joints, fracture geometry and growth evolution derived fromhigh resolution microseismic data (Pierce et al. 2007; Reyes-Montes et al. 2007). This technique involves the fitting of threepointplanes to the clouds of cracks produced in the SRM testsand to the microseismic events monitored during caving. In thismanner, it allows for validation of the SRM approach throughcomparison of the fracture orientations derived from recordedmicroseismicity during undercutting and cave propagation withfracture orientations derived from the cloud of cracks (i.e. bondbreakages) developed during SRM testing. Overall, the dominantfracture orientations within the SRM samples are in very goodagreement with the dominant structure inferred from microseismicdata analysis in five separate domains studied within the Lift 2block (Figure 28). The mode of failure was examined in detail andwas shown to consist of three main stages: (1) slip on a small subsetof pre-existing joints; (2) formation of new tensile fractures aswing cracks from these slipping joints and finally (3) coalescenceinto large macro-fractures.The joints that are able to slip within the sample control the firstsets of cracks that form within the SRM material. The alignmentof wing cracks with 1 exerts a strong control on the ultimateorientation of new fractures that form in the rock mass. As shownin the PFC 2D (Itasca, 2008a) example in Figure 29, joints at intermediatedip will be inclined to slip under stress conditions typicalof an advancing cave (increasing horizontal σ 1 , vertical σ 3 ) and43
<strong>Diego</strong> <strong>Mas</strong> <strong>Ivars</strong> TRITA LWR PHD 1058Figure 28. Stereographs showing the relative density of poles to the planes fitting themicroseismic events induced at different stages of cave development at NorthparkesMine. The time period and corresponding mining operation is shown in the histogramof daily seismic activity rate shown in the top-right corner. In each pane, theupper stereograph represents the density plot calculated for in-situ induced microseismicitywhile the lower stereograph is calculated for the synthetic model constructedfor the corresponding geomechanical domain. The results show a good correspondencebetween in-situ and synthetic seismicity. The diagrams show theinterpreted dominant planar structures. After Reyes-Montes et al. (2008).form wing cracks that propagate and coalesce horizontally. This isadvantageous in an orebody such as Lift 2, where there is a paucityof pre-existing horizontal joints to encourage caving. Based onthe seismic data analysis this appears to have happened in the latestages of undercutting and early stages of draw within the QMP(Domains 3 and 4) and Diorite (Domain 5) (Figure 28). It can bedemonstrated that the stress conditions particular to late undercutting(low ratio of σ 1 to σ 2 in the horizontal plane, see Figure22) promote clamping of vertical joints in the QMP (Domains 3and 4) when compared to early undercutting in the Volcanics(Domain 1).In early undercutting there is a strong shear component to seismicitythat suggests significant joint slip and this is supported bythe observations of slip on both vertical and sub-horizontal jointsin the SRM sample (Figure 27). The stress conditions at this earlystage (high ratio of Sigma 1 to Sigma 2, see Figure 22) also maypromote growth of new vertical fractures. This appears to have44
Bonded Particle Model for Jointed Rock <strong>Mas</strong>sFigure 29. Wing crack development and coalescence (in red) frompre-existing joints (in blue) in a PFC 2D material (Sigma 1 horizontal).happened in the early stages of undercutting within the Volcanics,as the seismic data analysis indicates strong vertical and horizontalstructure.FragmentationCaving results in primary fragmentation, which defines the size ofthe blocks that form in the failure zone of the advancing cave.Secondary fragmentation is the reduction in size of the primaryrock blocks during the drawdown of the cave (in the draw column).For this comminution to occur, the stresses in the cavezone/draw column must exceed the strength of the weakest portionsof the primary rock block.The main controlling factors in the primary fragmentation are theorientation and relative strength of the joints with respect to theinduced stresses in the cave back.A second technique that can be used to assist in understanding themacroscopic fracturing (coalescence of existing joints and newfractures) that accompanies softening from peak strength to residualstate involves examination of contiguous blocks or clusterswithin the SRM material — i.e. isolated blocks of intact rock withinthe sample whose component grains can all be reached via oneanother through bonded contacts (Figure 30). Clusters are notnecessarily intact rock; they can still have internal joints (nonthrough-going).With this technique, it is possible to see how the initially intactrock mass disintegrates and to visualize the fractures (in the formof block defining features) that lead to this disintegration (Figure31). The evolving fragment size distribution that accompaniesfracturing was estimated for the Notrthparkes SRM samples byconverting the volume of each cluster to an equivalent sphericaldiameter. As shown in Figure 31, the size distribution at the residualstate (zero cohesion) compares well with visual observationsof fragmentation made in the drawpoints at Northparkes Lift 2.45
<strong>Diego</strong> <strong>Mas</strong> <strong>Ivars</strong> TRITA LWR PHD 1058Figure 30. Two-dimensional Synthetic Rock <strong>Mas</strong>s. The colors denoteintact rock blocks (clusters) bounded by joints. Notice the internalnon through-going jointing in the “intact” rock blocks.BrittlenessA jointed rock mass may exhibit strain softening, strain hardeningor elastic perfectly plastic behavior, depending upon the joint configurationand the confining stress level causing failure (Tiwari andRao, 2006) (Figure 32). Even when the maximum load bearing capacity(i.e. peak strength) of a rock mass surrounding an excavationhas been surpassed, the excavation as a structure may remainstable. The rock mass may be able to accommodate further strainingbefore reaching its residual state (total rupture or final disintegration).Brittleness is not a material property, as it depends on the stresspath the rock mass follows before and after failure. Confiningstress is an important consideration, since it affects brittle fracturestrength by suppressing the growth of dilatant microcracks, aprocess which is generally enhanced by deviatoric stress and suppressedby mean stress. Consequently, increase in confinementstress increases the peak strength and makes the rock mass postpeakresponse more ductile.Due to lack of large-scale test data, representing the strainsofteningbehavior of jointed rock masses is an extremely challengingand difficult task. Brittleness is generally accounted forwithin continuum analyses of rock mass behavior by consideringrock as a strain-softening material in which the cohesion of therock mass degrades with accumulated plastic shear strain, which is46
Bonded Particle Model for Jointed Rock <strong>Mas</strong>sFigure 31. (top) Evolution of fracturing in Domain 1 sample on a vertical crosssectionthrough the centre (top). Solid colours denote contiguous blocks of bondedmaterial (i.e. isolated rock blocks). (bottom) Comparison of fragmentation in SRMtest to that measured in the drawpoints at Northparkes Lift 2. Note that Q1Q2 2005is primary fragmentation comparable to that produced in the SRM test; Q3Q4 2005and Q1Q2 2006 are secondary fragmentations.a common metric for irreversible shear strains in geomaterials and,in a more general sense, can be considered as a measure of damage.In these models, the determination of the size of the plasticzones and the associated rock mass deformation depends on theresidual strength and the rate of post-peak strength (i.e. cohesivestrength) degradation of the rock mass. Martin et al. (1999b) demonstratedthat it is reasonable to assume perfectly brittle behavior(i.e. instantaneous cohesion loss) in cases where the failure process47
<strong>Diego</strong> <strong>Mas</strong> <strong>Ivars</strong> TRITA LWR PHD 1058HardeningFigure 32. Possible failure mechanisms of rock masses (modifiedfrom Crowder and Bawden, 2004).is dominated by new stress-induced fracturing (e.g. in massive ormoderately jointed rock at the tunnel-scale). The assumption ofperfectly brittle behavior may not be valid in cases where the preexistingjoint fabric exerts a stronger control on the failureprocess, such as in large-scale slopes or caves. In these cases, rockmasses tend to exhibit a less brittle response and the strains requiredfor complete cohesion loss become more important in theprediction of rock mass behavior. For example, Hajiabdolmajid &Kaiser (2002) demonstrated that slope stability in jointed rock issensitive to rock mass brittleness. Their work also suggested thatthe extent of the failed zone within a slope is proportional to brittleness,with more brittle rock masses displaying a more deepseatedfailure surface. Unfortunately, we know very little about therelations between cohesion loss and plastic shear strain that controlrock mass failure in such cases. To date, engineers have reliedmainly on back-analysis of well-documented case histories as ameans to constrain these relations. Even though nowadays thereare some guidelines given from researchers for estimation of brittleness,there is no standard manner to quantify it.The SRM spherical testing environment provides a new and powerfultool to estimate jointed rock mass brittleness.As damage accumulates plastic shear strain increases. Critical plasticstrain is defined as the total plastic shear strain required to dropthe cohesion of a rock to zero (i.e. complete disintegration andcaving) and is analogous to brittleness; the smaller the critical plasticstrain, the more brittle a rock mass is, as it takes less strain forthe rock mass to disintegrate. The brittleness of the SRM samples48
Bonded Particle Model for Jointed Rock <strong>Mas</strong>sis measured by tracking the plastic shear strains as the samplesdrop from their peak strength to residual strength and completedisintegration (e.g. from step t to step t+1 in Figure 15).Once complete disintegration has been achieved, the softeningstress path from peak strength to complete disintegration is dividedinto regular intervals (e.g. peak strength to 66% peakstrength, 66% to 33% peak strength, and 33% peak strength to residualstrength) in order to quantify the accumulated plastic shearstrain. Then the incremental plastic strain tensor is determined ateach of those intervals following the steps presented in section4.4. After that, making use of Eq. 16, the accumulated plasticshear strain is calculated from the obtained incremental plasticstrain tensors at each of the chosen intervals.The obtained cohesion versus accumulated plastic shear strain relation(here we assume cohesion is being lost as the sample disintegrates)can then be used as input into a strain-softening constitutiverelation in a large-scale model (Pierce et al. 2007).This technique was applied in the Northparkes Lift 2 study case.The cohesion versus plastic shear strain curves obtained in thismanner are normalized to cohesion for comparative purposes inFigure 33. There is a significant variation in brittleness betweenthe various domains; Domains 1 and 5 exhibit the most brittle responseand Domain 2 the least brittle. The lower brittleness ofDomain 2 is attributed to both the higher intact strength withinthe BQM lithology and the rotation of stresses towards vertical inFigure 33. Estimates of brittleness obtained from SRM testing of base case samplesfrom the five domains at Northparkes Lift 2. (Steep lines indicate high brittleness —i.e. less plastic strain required to lose cohesion).49
<strong>Diego</strong> <strong>Mas</strong> <strong>Ivars</strong> TRITA LWR PHD 1058this location as the cave advances. Since the joint fabric is predominantlysub-vertical, one would expect the rock mass to bestronger under application of a sub-vertical major principal stress.Because the SRM model samples would only represent small andselected portions of the entire orebody volume in a cave mine, theresults of the SRM tests and the insight gained from them ultimatelymust feed into tools that can be used to predict the behavior(in terms of caveability) of an entire orebody. In the continuum(finite difference) numerical approach used in this casestudy,the rock mass modulus, peak strength, damage threshold,and brittleness derived from the small-scale sample tests (SRMtests) were represented directly on a zone-by-zone basis within anorebody-scale model of Lift 2. The larger joints not accounted forwithin the SRM tests (i.e. joints larger than 3 m in diameter) wereconsidered in the larger mine-scale model employing SRM-basedproperties. Other features such as major structures, adjacent cavedareas, true undercut direction, size and shape, and surface topographywere also included in the continuum model. The minescalemodel successfully simulated the observed progress of theseismogenic, yield and cave zones in Lift 2 as inferred from in situmonitoring via geophones, TDRs and open holes (Pierce et al.2006; Cundall, 2008). This indicates that a large-scale model employingSRM-derived properties is capable of properly capturingthe mechanism, rate and extent of rock-mass softening and disintegration.5.3 Anisotropy and scale effectThe SRM Standard Test Suite (previously introduced in section 4.3)has been applied to a back-analysis study of caving behavior at RioTinto’s Palabora mine in South Africa (Figure 34). The Palaboramine began operations as an open cut copper mine in 1964. Todayit is the world’s deepest open cut mine, approximately 450 mdeep and nearly two km in diameter. A change in mining methodto block caving was implemented in 2000. Soon after the breakthroughof the block cave to the base of the open pit, a significantpit slope failure occurred on the north wall, as illustratedin Figure 34. The open pit failure has jeopardized the integrity ofcritical infrastructure and leads to potential sterilization and diluFigure 34. The Palabora pit slope failure mechanism reproduced by the SRM–UJRMapproach for representing jointed rock masses (Sainsbury et al. 2008b).50
Bonded Particle Model for Jointed Rock <strong>Mas</strong>stion of the ore reserve. Based upon initial back-analyses of thefailure, the failure mechanism has been attributed to a persistentjoint set that intersects the cave volume at depth (Brummer et al.2006).This case study presented a new challenge for the SRM technology.Due to the particular characteristics of the in-situ joint fabric(very low joint frequency combined with very large joint persistence),significant scale effects and anisotropy were expected inrock mass behavior. Therefore the SRM Standard Test Suite methodologywas employed.As in the previous study case the DFN was generated using 3FLO(Itasca, 2006a) and the input data were derived from analysis ofopen joint data collected from pit wall mapping, undergroundmapping and core logging. The study case domains in this casewere chosen according to the main rock types in the mine. Thepole plots in Figure 35 show that the joints at Palabora are predominantlysubvertical in orientation and exhibit two dominantstrike directions (WNW and NNE). The joint spacing varies considerably.Table 6 and Table 7 indicate the data ranges for all thelithologies. It was difficult to estimate the joint size distribution atPalabora because, in most cases, the joint traces cut completelyacross the faces being mapped. In the absence of further informationto constrain joint size (e.g. through measurement of tracelengths and terminations over multiple benches), it was necessaryto make a significant assumption about the joint size distribution;a power-law model with a length exponent equal to -4 ultimatelywas employed. Due to the large joint sizes present in such a DFN,a large generation volume equal to a cube of edge-length 100 mwas employed for the Carbonatite, and Micaceous Pyroxenite. Asmaller cube of edge-length 50 m was used for the Dolerite, whichhad greater joint frequency and shorter mean joint diameter.The target intact rock properties (UCS, Young’s modulus andPoisson’s ratio) were established by scaling the properties obtainedfrom standard uniaxial-compression tests on core samplesto what might be expected for an average-sized rock block withineach lithology, estimated from the mean joint spacing. The relationproposed by Hoek and Brown (1980) was used to justify scal-Carbonatite Dolerite Micaceous PyroxeniteFigure 35. Stereonet of poles to joint planes within different lithologies in Palabora.51
<strong>Diego</strong> <strong>Mas</strong> <strong>Ivars</strong> TRITA LWR PHD 1058Table 6. Measured joint frequencies from underground mapping at Palabora.Lithology Approximate traverse orientation Mean joint frequency (min-max)Carbonatite West 0.83 m -1 (0.16-3.33)Carbonatite South 0.53 m -1 (0.04-3.64)Dolerite West 1.88 m -1 (0.02-4.80)Dolerite South 2.54 m -1 (0.16-10.00)Micaceous Pyroxenite West 0.39 m -1 (0.04-0.94)Micaceous Pyroxenite South -Table 7. Measured joint frequencies from open pit mapping andassumed joint sizes at Palabora.Lithology Mean joint frequency (min-max) Mean joint diameter (min-max)Carbonatite 0.77 m -1 (0.21-3.33) 15 m (10-354.7)Dolerite 2.26 m -1 (0.35-16.00) 7.5 m (5-658)Mic. Pyrox. 0.37 m -1 (0.12-0.73) 15 m (10-246)ing laboratory UCS by 80% to obtain rock-block strength. Theparticleassemblies followed a uniform particle size distributionwith diameters ranging from 6.81×10 -1 m to 11.31×10 -1 m for Carbonatiteand Micaceous Pyroxenite and 1.70×10 -1 m to 2.82×10 -1m for Dolerite. The target and calibrated values for UCS, Young’smodulus and Poisson’s ratio for the four rock types (Carbonatite,Dolerite, and Micaceous Pyroxenite) are listed in Table 8.After the microproperties for the bonded particle assembly wereestablished (see Table 9), cubic specimens of 80-m (Carbonatiteand Micaceous Pyroxenite) or 20-m (Dolerite) side length wereproduced. These SRM samples are among the largest PFC 3D modelsever generated in terms of number of particles (~ 1 millionparticles). Using the particle assemblage-generation method of theAC/DC logic previously introduced (Billaux et al. 2004), thesemodels were created in a few hours. Joint properties in this casestudy were estimated from the roughness and hardness of jointsmeasured during mapping, and are listed in Table 10. Joint dilationin all cases was assumed to be zero.The next step involved carving three 80 m × 40 m × 40 m parallelepipedsamples from the centre of the generic 80 m cube in thethree axial directions (a quarter of this size for the Dolerite samples).After that, each of these three large samples was divided intoeight medium-sized samples. Finally, one of the medium-sizedTable 8. Target (Lab.) and calibrated (Cal.) intact rock block propertiesfor the three main rock types at Palabora.Carbonatite Dolerite MicaceousPyroxeniteLab* Cal Lab* Cal Lab* CalMean Measured UCS (MPa) 139 320 90Estimated Rock-Block Strength* 111.2 112.7 256 257.5 72 72.7(MPa)Young’s Modulus, E (GPa) 58 58.4 90 92.5 72 72.5Poisson’s Ratio, v 0.33 0.33 0.30 0.30 0.35 0.35*Scaled Lab. UCS (80%) to account for the average in situ block size.52
Bonded Particle Model for Jointed Rock <strong>Mas</strong>sTable 9. Microproperties used in PFC 3D for the three lithologies (Palabora).ParticeproperiesCarbonatiteDoleriteMicaceousPyroxeniteDensity(kg/m 3) 4109 4109 4109Particle contact modulus (GPa) 74.5 140 96.8Ratio of particle normal to shearstiffness (kn/ks)2.4 3.8 2.74Particle friction coefficient 2.5 2.5 2.5Parallel bond propertiesParallel-bond radius multiplier 1.0 1.0 1.0Parallel bond modulus (GPa) 74.5 140 96.8Ratio of parallel-bond normal toshear stiffnessMean value of bond normalstrength (MPa)Standard deviation of bond normalstrength (MPa)Mean value of bond shear strength(MPa)Standard deviation of bond shearstrength (MPa)2.4 3.8 2.74170 429 10034 85.8 20170 429 10034 85.8 20Table 10. Estimated joint properties in SRM samples (Palabora).Carbonatite Dolerite MicaceousPyroxeniteNormal stiffness (GPa/m) 150 250 150Shear stiffness (GPa/m) 20 30 20Friction angle (degrees) 30 26 34Cohesion (MPa) 0 0 0samples in each of the axial directions was subdivided into eightsmall parallelepiped samples. In this manner, a total of fifty-onespecimens of 2:1 aspect ratio were generated for each lithology:twenty-four small-sized specimens (eight in each axial direction);twenty-four medium-sized specimens (eight in each axial direction);and three large-sized samples (one in each axial direction).The process of progressively subdividing specimens is illustratedin Figure 36. The distinct colours correspond to contiguousblocks, within which any particles may be reached from any othervia one or more intact bonds. Between such blocks, there are contactsassociated with smooth-joint segments. Although a block isidentified with a uniform color, it may contain many “dead-end”joints that may extend during loading (see Figure 36a).Once the SRM parallelepiped specimens of different sizes and indifferent axial directions were generated, they were submitted tonumerical simulations of direct tension, unconfined compression(UCS) and triaxial compression (1 MPa and 5 MPa confinement)following the procedure outlined in section 4.3. This allowed forthe estimation of the spatial variability induced by the DFN on thestrength, brittleness and elastic properties of the rock mass at differentscales and in different directions.Figure 37 shows the stress-strain response of the eight small-sizedspecimens in the y-direction (N-S) when subjected to UCS testing.53
<strong>Diego</strong> <strong>Mas</strong> <strong>Ivars</strong> TRITA LWR PHD 1058Figure 36. 3D cluster plots for: (a) three concentric 80m × 40m × 40m parallelepipedsamples in the three axial directions (Different colors denote clusters of particlesbonded together (intact rock blocks). Note the internal jointing inside the intact rockblocks; (b) the 80m × 40m × 40m parallelepiped sample in the y-direction (N-S); (c)the 80m × 40m × 40m parallelepiped sample in the y-direction subdivided into eightparallelepiped samples of 40m × 20m × 20m; and (d) the 40m × 20m × 20m parallelepipedsample named U2, subdivided into eight smaller 20m × 10m × 10m subsamples(Palabora study case).UCS carbonatite (10m x 10m x 20m) Y-direction (N-S)Axial Stress (MPa)8070605040302010L1L2L3L4U1U2U3U400.000 0.001 0.002 0.003 0.004 0.005 0.006 0.007 0.008 0.009 0.010Axial StrainFigure 37. Stress-strain response of the eight small-sized carbonatite specimens (10m× 10m × 20m) oriented in the y-direction (N-S) when subjected to UCS testing (Palaborastudy case).The large variation in the results is attributed to the small numberof joints present. The scarcity of joints in the small-scale samplescan cause failure along a possible number of preferential planes ofweakness. If an unfavorable orientation is present this can result54
Bonded Particle Model for Jointed Rock <strong>Mas</strong>sin much lower strength and/or more ductile behavior. Figure 38illustrates the stress-strain response from UCS tests on large SRMsamples of Carbonatite. Due to a dominant vertically orientedjoint set within the rock mass, strength anisotropy can be observedwhen the sample is loaded in different orthogonal directions.It is also noticeable in Figure 38 the more ductile nature ofthe stress-strain curves as compared with the ones in Figure 37.Figure 39 shows the unconfined compressive strength measuredfor synthetic samples of Carbonatite, Dolerite and Micaceous Pyroxenitesamples, respectively, versus sample widths. Table 11 listsmean unconfined peak strengths and standard deviations for twosample sizes for each of the three rock types. The variation decreaseswith increasing size, in each direction.The variation in unconfined strength is illustrated graphically inFigure 40a, in which each group of bars corresponds to a singlesample (10m × 10m × 20m) of a single rock type (Carbonatite). Ineach group, the anisotropy is reflected by the relative heights ofthe three bars corresponding to the X- (E-W), Y- (N-S) and Z-directions (vertical) of testing. Similar results for Young’s modulusare shown in Figure 40b. There is a strong correlation betweenUCS and Young’s modulus.A strong size effect is evident for the three synthetic rock masses,although each rock type exhibits its own particular shape ofstrength-size curve (e.g. contrast Figure 39c with Figure 39aandFigure 39b); clearly, the Micaceous Pyroxenite results have notyet become asymptotic). The main cause for the size effect seemsto be that considerable intact rock (rock bridge) failure is neces-UCS carbonatite (40m x 40m x 80m)35X (E-W) Y (N-S) Z (Vertical)3025Axial stress (MPa)201510500.000 0.001 0.002 0.003 0.004 0.005 0.006Axial strainFigure 38. Stress-strain response of the three large-sized carbonatite specimens (40mx 40m x 80m) in three orthogonal directions when subjected to UCS testing (Palaborastudy case).55
<strong>Diego</strong> <strong>Mas</strong> <strong>Ivars</strong> TRITA LWR PHD 1058(a)(b)(c)Figure 39. Numerically obtained average values of unconfinedcompressive strength of (a) carbonatite, (b) dolerite and (c)micaceous pyroxenite, versus sample thickness for three orientationsof the applied axial stress [The left-most point correspondsto intact rock; the next point represents the estimated strength ofthe mean block size (see Table 8)] (Palabora study case).56
Bonded Particle Model for Jointed Rock <strong>Mas</strong>s(a)Figure 41. Visualization of: (a) Carbonatite SRM sample and, (b)Mycaceous Pyroxenite SRM sample. Both are cubes of 80 m sidelength. (Palabora study case).In a rock mass, there are a multitude of joints of different sizesand different orientations. Sometimes, especially if the sample isnot large enough, there can be a dominant weak joint or plane. Ifthe dip direction of that joint is perpendicular to one of the con-(b)59
<strong>Diego</strong> <strong>Mas</strong> <strong>Ivars</strong> TRITA LWR PHD 1058(a)(b)Figure 42. Initial fragment (cluster) size distribution for 40 m × 40 m× 80 m parallelepiped samples in three axial directions (X (E-W), Y(N-S) and Z (vertical)) representing: (a) Carbonatite (BCB) and (b)Mycaceous Pyroxenite (MPY). (Palabora study case).finement stress orientations in a triaxial test, depending on the dipangle and the friction angle of the joint, a slight increase in confinementlevel might not be enough to increase the shear strengthon the joint plane such that it translates into a significant increasein the sample peak strength. However, a larger increase in confinementwill strengthen the joint shear response and cause therock mass peak strength to increase as well. This is possibly thecase of the Micaceous Pyroxenite SRM sample response in the60
<strong>Diego</strong> <strong>Mas</strong> <strong>Ivars</strong> TRITA LWR PHD 1058(a)Figure 44. Peak strength vs. confinement level of three large-sized (40 m × 40 m × 80m) Micaceous Pyroxenite (a) and Carbonatite (b) specimens in three orthogonal directions.(Palabora study case).(b)The results from the direct tension test simulations showed thatthe tensile behavior of rock masses is more complex than usuallyassumed in continuum models. It is well known that the ratio betweenthe UCS and tensile strength of an intact hard rock is in theorder of 10-25. Most of the joints in hard rock are partly or entirelyopen and have therefore negligible tensile strength. For this rea-62
Bonded Particle Model for Jointed Rock <strong>Mas</strong>sson, the UCS/tensile strength ratio in hard rock masses is usuallymuch larger than that of intact rock.Table 12 and Table 13 show the results of the direct tension simulationson the Carbonatite and Dolerite samples. These results arecharacterized by a marked anisotropy. In the case of the Carbonatite,in the y-direction (N-S), due to the predominantly sub-verticaljointing of very large persistence, there is no tensile strength exceptfor the medium-sized sample L3. Tests in the x-direction (E-W) show similar results, with only the middle-sized samples L4and U3 exhibiting any tensile strength. However, in the z-direction(vertical), there are only four small-sized samples with no tensilestrength. In the z-direction, the samples exhibit tensile strengthsthat vary with scale (tensile strength decreases with increasingsample size). These anisotropic results are in agreement with thedominant sub-vertical in-situ jointing. Similar conclusions can bedrawn from the results of direct tension tests on the Doleritesamples.The smaller SRM samples generally exhibit brittle behavior whenextended in the vertical direction (z-direction), whereas largersamples exhibit more ductile behavior. This is due to the fact that,in large rock mass volumes, interlocking contributes to tensilestrength, and more strain is required to achieve sufficient blockbreakage and/or rotation for complete loss of strength. Even ifthe ultimate failure has a brittle character, the stress-strain curve ofa direct tension test on a SRM sample can exhibit two or moresecondary peaks (Figure 45). This is due, in this particular case, toTable 12. Measured tensile peak strength from direct tensile testing on CarbonatiteSRM samples (Palabora).Mean Tensile PeakStrength (MPa)*10m x 10m x 20m(eight samples ineach axial direction)20m x 20m x 40m(eight samples in each axialdirection)40m x 40m x 80m(one sample in each axialdirection)X Y Z X Y Z X Y Z0 0 1.1 0.03 0.003 0.15 0 0 0.17Min-Max (MPa) 0-0 0-0 0-6 0-0.17 0-0.025 0.025-0.32 0-0 0-0 0.17-0.17Nr. of samples with 8/8 8/8 4/8 6/8 7/8 0/8 1/1 1/1 0/1no tensile str./nr. ofsamples tested* Mean Peak Tensile Strength calculated considering the 0 values.Table 13. Measured tensile peak strength from direct tensile testing on Dolerite SRMsamples (Palabora).Mean Tensile PeakStrength (MPa)*2.5m x 2.5m x 5m(eight samples in eachaxial direction)5m x 5m x 10m(eight samples in eachaxial direction)10m x 10m x 20m(one sample in each axialdirection)X Y Z X Y Z X Y Z0 0.003 3.51 0.05 0.006 0.13 0.1 0 0.55Min-Max (MPa) 0-0 0-0.025 0-16.5 0-0.23 0-0.05 0-0.48 0.1-0.1 0-0 0.55-0.55Nr. of samples with 8/8 7/8 4/8 5/8 7/8 4/8 0/1 1/1 0/1no tensile str./nr. ofsamples tested* Mean Peak Tensile Strength calculated considering the 0 values.63
<strong>Diego</strong> <strong>Mas</strong> <strong>Ivars</strong> TRITA LWR PHD 1058Direct Tension carbonatite (10m x 10m x 20m) Z-direction76U1 U2 U3 U4Axial stress (MPa)5432100.0000 0.0002 0.0004 0.0006 0.0008 0.0010 0.0012 0.0014 0.0016Axial strain(a)Direct Tension dolerite (2.5m x 2.5m x 5m) Z-direction1816L4 U2 U414Axial stress (MPa)1210864200.0000 0.0005 0.0010 0.0015 0.0020 0.0025 0.0030Axial strainFigure 45. Stress-strain response of the small-sized carbonatite (a) and dolerite (b)specimens oriented in the z-direction (vertical) that showed non-negligible tensilestrength when subjected to direct tension testing (Palabora study case).(b)64
Bonded Particle Model for Jointed Rock <strong>Mas</strong>sthe tabular nature of the SRM samples caused by the dominantsub-vertical jointing, by means of which, different parts of therock mass will fail at different strains during the test.Parallel to the development of the SRM test suite (see section 4.3), anew technique to account for anisotropy and scale effects (asquantified through SRM testing) within large-scale continuummodels in the form of a FLAC 3D testing environment [UbiquitousJoint Rock <strong>Mas</strong>s (UJRM) technique] has been developed by Sainsburyet al. (2008a). The new SRM and UJRM methodologies havebeen applied successfully to the Palabora study case and have providedgood insight into the rock mass behavior at different scales.The cave-scale model using the SRM-UJRM approach has beensuccessful in reproducing the slope failure mechanism at PalaboraMine in South Africa (Figure 34), and the predicted seismogeniczone has shown good correlation with the monitored seismicity(Sainsbury et al. 2008b). Furthermore, the application of this techniqueto the cave-scale analysis has shown that significant effectson cave shape and rate of progression can be obtained by variationsin the rock mass joint orientation and persistence.In addition to the study reported in this paper, the SRM suite oftests has been applied to the geomechanical characterization ofcoalseam reservoirs (Deisman et al. 2008b; Deisman et al. 2009),the study of the effect of sample size on rock mass strength(Esmaieli et al. 2009) and the study of the influence of veining inintact rock strength (Pierce et al. 2009). A similar approach, makinguse of the SRM concept, has been recently used by Hadjigeorgiouet al. (2009) for the stability analysis of vertical excavations inhard rock.65
<strong>Diego</strong> <strong>Mas</strong> <strong>Ivars</strong> TRITA LWR PHD 10586. DISCUSSIONThe previous chapters have shown the current capabilities of theSRM approach that overcome some of the limitations of othermethods for rock mass behavior characterization. These can besummarized as follows:• SRM samples represent rock mass volumes at the scale of10-100m. The joint fabric is explicitly included in the SRMsamples, thus capturing its influence in rock mass behavior.• SRM samples can be tested under laboratory conditions(UCS, triaxial, direct tension) or submitted to more specificstress paths representative of the engineering activityunder study.• Output from SRM tests includes peak and residualstrength, modulus, Poisson’s ratio, brittleness, fragmentationand nature of rock mass failure (e.g. slip on joints andnew fracture growth).• Anisotropy and scale effect in rock mass properties due toin situ joint fabric can be quantitatively characterized.Being an emergent methodology, the SRM approach has, atpresent, a number of limitations. These have been classified intodifferent categories. The following paragraphs discuss each one ofthem.6.1 Input dataPredictions of rock mass behavior using the SRM approach areonly as good as the input data available. Usually there is a relativeabundance of intact rock data compared to data on joint geometryand joint behavior. Scarcity or low quality in joint geometrical datacan lead to large uncertainty on the DFNs generated to representthe in situ joint fabric. This uncertainty will propagate all the waythrough from the SRM testing to the large-scale continuum modelwith material properties fitting the observed SRM behavior. Uncertaintyexists as well in joint behavior, as most often the only informationavailable in this sense is qualitative. The SRM methodcan be used to study the sensitivity of the rock mass behavior tojoint network geometry and joint properties. As an example, Figure46 shows the derived UCS value for SRM samples with differentjoint geometry and joint strength. This figure highlights theimportance of parameters like joint length and joint friction angle.66
Bonded Particle Model for Jointed Rock <strong>Mas</strong>sRock <strong>Mas</strong>s UCS (MPa)9080706050403020100BaselineDFN fromdifferentsimulationConstant jointorientationReduced jointfriction (25degrees vs. 30)Reduced jointpersistence(75% of baselinejoint diameters)Figure 46. Comparison of UCS values from sensitivity studies on SRM samples(Northparkes Lift 2 study case).6.2 MethodologyIntact rock calibrationThe intact rock response in a SRM sample is calibrated, at themoment, to that estimated for the average intact rock block size(see section 3.1). By doing this we might not be correctly capturingthe change in strength for intact rock blocks clearly smallerand larger than the average.Primary fragmentationAt present the cluster (rock fragment) size distribution is derivedbased only on the total volume of the clusters (see section 5.2).This does not give any information on the shape of the fragmentsfrom the primary fragmentation, which is of paramount importancewhen trying to predict secondary fragmentation.6.3 Numerical aspectsJoint intersection and joint hierarchyThe concept of joint intersection asperity, as explained in the SRMcomponents section (see section 3.2), can be seen as a limitationbut, far from that, it opens a whole range of possibilities for furtherresearch to improve our understating on the influence ofjoint hierarchy on jointed rock mass behavior. At the moment, inthe SRM approach, asperities at joint intersections have infinitestrength and an arbitrary size that is a function of particle size. Itcould certainly be an option in the future to allow the particles atjoint intersections to yield according to some strength thresholdcriteria, both in compression and in tension, and to disintegrateinto smaller particles.67
<strong>Diego</strong> <strong>Mas</strong> <strong>Ivars</strong> TRITA LWR PHD 1058The SRM approach has been used to explore the effect of jointhierarchy in rock mass behavior in a study performed for BinghamCanyon mine. In this case study, the rock mass exhibited asub-horizontal bedded structure combined with a couple of subverticaljoint sets (see Figure 47).There was no information on the hierarchical order of the twosub-vertical joint sets so it was decided to build and test two SRMsamples (hybrid B and hybrid B2) each of them with a differentsub-vertical joint hierarchy (Figure 48). In both cases, in order tomake the sub-horizontal bedding planes fully persistent they wereinserted first. In the hybrid B model joint set 1 was inserted insecond place (the next more continuous joint set) and joint set 2was last to be inserted (the least continuous). In the hybrid B2model the second most continuous was joint set 2 (inserted insecond place) and the least continuous was joint set 1 (inserted inlast place).Both joint sets had the same mechanical properties. The results ofa simulated UCS test on a hybrid B SRM sample and a hybrid B2SRM sample are shown in Figure 49.Figure 47. Scheme showing the sub-horizontal bedding structureand the two sub-vertical joint sets of the Quartzite unit at BinghamCanyon (Bingham Canyon study case).Hybrid BJoint set 1 Joint set 2Hybrid B2Joint set 1 Joint set 2Bedding planeBedding planeBedding planeBedding planeConceptual scheme, not actual DFNFigure 48. Scheme showing the two hierarchical conceptual models of the joint networkof the quartzite unit at Bingham Canyon mine.68
Bonded Particle Model for Jointed Rock <strong>Mas</strong>sFigure 49. Simulated axial stress vs. axial strain response during a UCS test performedon SRM samples representing Quartizite from Bingham Canyon mine withhybrid B joint network and hybrid B2 joint network (Bingham Canyon study case).The SRM model with hybrid B2 joint hierarchy (joint set 2 relativelymore continuous than joint set 1) is stiffer, stronger andmore brittle than the one with hybrid B joint hierarchy. Joint set 1is much more numerous than joint set 2 in the DFN. Joint set 1being broken in small joint segments with asperities (hybrid B2joint hierarchy) can cause increase in strength, brittleness, andstiffness.Intact rock friction angle and tensile strength vs UCS ratioWhen representing intact rock via the BPM for rock, there areseveral limitations that have to be considered. The macroscopicfriction angle is typically lower than that of actual hard rock, irrespectiveof the particle friction coefficient. In addition, theUCS/tensile strength ratio is generally lower (ca. 3-4) than that ofrock (>10). This has been attributed to the particle shapes employed;the BPM represents rock as an assembly of circular orspherical particles and, in this manner, lacks the effect of thecomplex-shaped and highly interlocked grain structure of hardrock. Previous attempts to solve these problems have made use ofclumped material (Potyondy and Cundall, 2004, Cho et al. 2007)or elliptical particles (Ting et al. 1993). More recently, Potyondyand co-workers (Potyondy, 2009; Potyondy et al. 2009) have successfullyovercome these limitations in 2D by simulating the actualgrain shape of the rock making use of the smooth-joint contactmodel to represent the grain boundaries. Their 2D grain-basedmodels mimic deformable, polygonal grains cemented at their interfaces,and models with unbreakable grains match the macroscopicresponse of hard rock and most of the mechanisms that occurduring direct tension and compression tests. Also, Schöpfer etal. (2009) have shown that it is possible to match both the frictionand the UCS/tensile strength ratios observed in rock by decreas-69
<strong>Diego</strong> <strong>Mas</strong> <strong>Ivars</strong> TRITA LWR PHD 1058ing the porosity and the proportion of initial bonded contacts inthe assembly.At present, clumped particles have not been explored in combinationwith smooth-joint contacts. Besides, the approach based onporosity reduction and proportion of initial bonded contacts isnot feasible for SRM samples at the moment, because it drasticallyincreases the number of particles and running times would becomeunreasonable. The consequence of this depends on the rockmass type under study. If the rock mass has a discontinuous nature(i.e. rock is divided in blocks by in situ jointing) the tensilestrength and “internal” friction of the intact rock may not playsuch a crucial role in the overall rock mass behavior. The behaviorin this case will be mainly controlled by rotation and interlockingof existing rock blocks and not much additional fracturing will beneeded for the rock to fail (the dependence on the intact rock behaviorwill increase as confinement increases though). On theother hand, if the rock mass has a continuous nature (i.e. in situjoint fabric consisting of relatively short joints not able to formisolated blocks) failing to match the UCS/tensile strength ratio ofα (°) Lab PFC030456075Figure 50. Results from SJM simulations on a single internal flawcompared with similar simulations conducted on laboratoryspecimens reported in Wong and Einstein (2006) (‘X’ indicates nomatch). The red lines indicate the SJ model, tensile bond failure isshown in black and shear failure is shown in blue. α is the angle indegrees measured from the horizontal axis.70
Bonded Particle Model for Jointed Rock <strong>Mas</strong>sthe intact rock may lead to an overestimation of the rock massstrength. In this sense, Deisman et al. (2008a) have shown thatPFC 2D samples with embedded flaws represented via the smoothjointcontact model can reproduce observed laboratory internalflaw behaviors including crack initiation, propagation and coalescence(Figure 50 to Figure 52). However, the average strength ofthe simulated specimens was found to be 1.26 times greater thanthe measured laboratory specimens, due to the fact that the tensilestrength and fracture toughness were unrealistically represented.Fracture toughnessThe concept of fracture toughness implies an internal length scale.This internal length scale in a BPM is the particle size. At present,in order to keep simulation times reasonable, the particle size ofany BPM model is much larger than the internal length scale(grain size) of the rock. In general, the particle size is always chosensuch that it is much smaller than any characteristic length ofthe analyzed problem, but large enough to allow acceptable modelsize and calculation times.The value of fracture toughness can be estimated by simulating adirect tension test on a sample with an initial crack (red color inFigure 53) (Damjanac et al. 2009). The fracture toughness canthen be calculated using the following analytical expression(Anderson, 1991) between the stress intensity factor, K I , and theapplied stress, σ:μTestID2-2 2-4 2-5 2-7 2-9 2-10PFC0.7LabPFC0.6LabFigure 51. Laboratory (Wong et al. 2001) and associated numerical simulation resultson samples containing two internal flaws with friction coefficients of 0.6 and 0.7.Specimens with an ‘X’ did not match the observed laboratory results (SJM in red,tensile bond failure in black and shear bond failure in blue).71
<strong>Diego</strong> <strong>Mas</strong> <strong>Ivars</strong> TRITA LWR PHD 1058μTestID3-2 3-3 3-4 3-6 3-7 3-8PFC0.7LabPFC0.6LabFigure 52. Laboratory (Wong et al. 2001) and associated numerical simulation resultson samples containing three internal flaws with friction coefficients of 0.6 and 0.7.Specimens with an ‘X’ did not match the observed laboratory results (SJM in red,tensile bond failure in black and shear bond failure in blue).KI = C(φ)σ πa (18)whereC(φ) = [ sec(πφ / 2) ] 1/ 2 ( 1− 0.025φ 2 + 0.06φ 4 ) (19)a is the fracture length, andφ is the ratio of crack length to sample width, taken to be 1/3in this set of simulations.If the stress is at incipient failure (crack extension), then the calculatedstress-intensity factor is the fracture toughness. During thissimulation exercise it was found that, for the calibrated bondstrength and the range of particle radii that allow a reasonablemodel size, the representation of intact rock in PFC 2D had a fracturetoughness (see Table 14) much greater that the expected targetvalue (most rocks have a fracture toughness on the order of1MPa · m 1/2 ).72
Bonded Particle Model for Jointed Rock <strong>Mas</strong>sFigure 53. Direct tension tests on a PFC 2D sample with an internal crack to obtainthe fracture toughness (Damjanac et al. 2009).Table 14. Relation between particle radius and fracture toughness(Damjanac et al. 2009).Particle Radius(m)Fracture toughness(MPa m 1/2 )0.02 13.180.045 21.390.09 25.59The fracture toughness, K IC , is a function of both, particle size, R,'and PFC particle contact tensile strength, σt, as described by thefollowing equation (Potyondy and Cundall, 2004):KIC= βσ ' παR(20)tand where α and β are two dimensionless parameters whose magnitudesare close to 1. The parameter α ≥ 1 increases with packingirregularity and strength heterogeneity. The parameter β < 1accounts for the weakening effect of the bending moment (andthe subsequent increase in maximum tensile stress at the bond periphery)that develops at the crack tip when using parallel bondedmaterial.Consequently, in order to calibrate a BPM to match both UCSand fracture toughness, it is necessary to adjust both PFC bondstrength and particle size. If the bond strength is chosen when calibratingthe UCS, as it is usually done, then the required fracturetoughness determines the particle radius.73
<strong>Diego</strong> <strong>Mas</strong> <strong>Ivars</strong> TRITA LWR PHD 1058Figure 54 shows the effect of changes in particle size on the valueof fracture toughness calculated from the PFC model (blue dots)based on data from Table 14. On the x-axis is R . According toEq. (20), there should be a linear relation between fracture toughness,K IC, and the square root of the minimum particle radius, R .The results in Figure 54 roughly confirm such relation. The BPMexhibits some randomness in its response, which is a consequenceof the variability in particle size and of the irregular particle packing.Similar variability is observed in the mechanical behavior ofactual rocks. A good fit is obtained for β α = 0. 83 (shown asthe red line in Figure 54).In this particular case, an estimate of the particle radius of thePFC material that would result in a fracture toughness of 1MPa ·m 1/2 is 0.1mm (the estimate was obtained using bond strength calibratedto UCS results and β α = 0. 83 ).This discussion shows that particle size cannot be chosen arbitrarilyif the problem requires matching the fracture toughness. Atpresent, this range of internal length scale (grain size) would imposesevere restrictions in the length scales and the simulationtimes when using the SRM approach if such a particle size is used.Although the qualitative mechanisms of rock behavior will still bethe same, this aspect must be taken into account when makingquantitative conclusions from SRM tests, as the simulated fracturetoughness is usually higher than in actual rocks.Figure 54. Model fracture toughness as a function of particle size.74
Bonded Particle Model for Jointed Rock <strong>Mas</strong>s7. CONCLUSIONSEstimation of rock mass behavior is a challenging problem. Foreach given project, ideally we would like to be able to characterizeand test numerous large rock mass samples in the laboratory underdifferent stress paths. However, the costs involved would beprohibitive, and most often the size of the samples required wouldbe too large to be tested in standard laboratory machines. Largescale field tests are costly, frequently not large enough, and havedifficulties associated with the control of the boundary conditionsand interpretation of results. Empirical methods, although widespreadin the engineering practice, are limited in their ability toconsider strength anisotropy (resulting from a preferred joint fabricorientation), scale effect (resulting mainly from the combined effectof joint density and joint persistence), and strain softening/weakening.Furthermore, they are only adequately suited forrock masses and in situ conditions similar to those from whichthey were derived. Analytical solutions, although useful and quickto apply, are, in general, only suited for idealized (regular, oftenpersistent and orthogonal) joint configurations, and they do notconsider the stress redistribution due to the presence of discontinuities.Continuum models, although powerful and flexible, cannot capturethe many different failure modes in jointed rock masses, aswell as the complex internal stress distribution of even rather simplejoint configurations. Discontinuum modeling can capture theessential nature of fracturing and disintegration and, in this manner,improve our understanding of these processes.The newly developed SRM approach is a discontinuum numericaltechnique based on particle mechanics for the estimation of rockmass behavior in three dimensions. It combines two wellestablishedtechniques, the Bonded Particle Model (BPM) forrepresenting intact rock (Potyondy and Cundall, 2004) and DiscreteFracture Network (DFN) modeling for representing the insitu joints, each of which is explicitly included in the model via thesmooth- joint contact model (<strong>Mas</strong> <strong>Ivars</strong> et al. 2008b). The SRMtechnique allows for rapid construction and testing of threedimensional10–100m-scale samples of moderately to heavilyjointed rock containing thousands of non-persistent joints. Thediscrete fracture network is generated from the available joint dataand embedded into the intact specimen to form an SRM sample.By these means, the in-situ joint fabric (and the scale effect andanisotropy induced by it) is accounted for explicitly in three dimensions,including consideration of joint stiffness, strength (bothcohesive and frictional) and dilation.The SRM technique is essentially used as a “virtual laboratory” toobtain estimates of rock mass strength, modulus and brittlenessfor use in predictive continuum large scale models. Unlike previousapproaches, the SRM methodology allows for considerationof a complex non-persistent joint network as well as block brea-75
<strong>Diego</strong> <strong>Mas</strong> <strong>Ivars</strong> TRITA LWR PHD 1058kage that includes the impact of incomplete joints (non-blockdefining)on block strength and deformability. Rock mass propertiesare not given directly, instead, the rock mass response arisesfrom the combined behavior of intact material and joints (whichincludes fracturing, joint shearing and opening, and joint propagationand coalescence).SRM samples can be subject to non-trivial, site-specific stresspaths and carried through to complete disintegration (i.e., residualstrength) so that both pre-peak properties (modulus, damage thresholdand peak strength) and post-peak properties (brittleness, dilationangle, residual strength and fragmentation) can be estimated.The power of the method is that it allows for site-specificconsideration of joint fabric, loading conditions and material property variations;three key factors in problems that are sensitive to post-peakproperties. The method has been validated through comparison ofmicroseismicity, fragmentation and yielding in SRM samples withrock mass response observed in a cave mining operation (Pierce etal. 2007).Of particular interest is the ability to obtain quantitative predictionsof rock mass scale effects, anisotropy and brittleness parametersthat cannot be obtained using empirical methods of propertyestimation. Furthermore, the SRM approach provides apossible means of developing a strength envelope that does not apriori rely on criteria such as Mohr-Coulomb or Hoek-Brown.To date, the method has been used to derive rock mass propertiesfor use in large-scale continuum models of cave mining (Pierce etal. 2007; <strong>Mas</strong> <strong>Ivars</strong> et al. 2007; Sainsbury et al. 2008a; Sainsbury etal. 2008b), to estimate fragment size distribution, to quantify theimpacts of scale on rock mass strength (<strong>Mas</strong> <strong>Ivars</strong> et al. 2008a;Esmaieli et al. 2009), to investigate failure mechanisms in largescaleopen pit slopes (Cundall 2008), to characterize the geomechanicalbehavior of coalseam reservoirs (Deisman et al. 2008b;Deisman et al. 2009), to study the influence of veining in intactrock strength (Pierce et al. 2009) and for stability analysis of verticalexcavations in hard rock (Hadjigeorgiou et al. 2009).The Synthetic Rock <strong>Mas</strong>s approach is a young technology. Therefore,there are at present a number of unresolved issues that havebeen highlighted in the discussion section. Some ways forward onthese areas are outlined in the next section on recommendationsfor future work.A large volume of data potentially useful for engineering prediction(e. g. slip on pre-existing joints, orientation and nature offracturing, rock mass stiffness, strength, brittleness and fragmentation)can be obtained from SRM virtual experiments. Overall, theSRM approach provides a basis for development of a rationalframework for estimation of rock mass deformation, strength andbrittleness and should be used routinely to supplement empiricalestimates.76
Bonded Particle Model for Jointed Rock <strong>Mas</strong>s8. RECOMMENDATIONS FOR FUTURE WORKThe SRM technique is a young technology and as such severalareas need further research and development. This section highlightsthe concepts and ideas that have come up during the courseof the PhD studies that could help overcome the current limitationsof the methodology.• The BPM for rock, used to represent intact rock behaviorin the SRM method, is, at the moment, incapable of reproducingthe UCS/tensile strength ratios observed inhard rocks. Further research is required in this area.• The intersection between joint planes in the SRM methodfollows a hierarchical model. An example of the effect ofdifferent joint hierarchy has been presented in the discussionsection. The SRM could be used in the future to betterunderstand the impact of joint hierarchy on rock massbehavior in a systematic way.• Currently the intact rock is calibrated to the estimated averagerock block strength. In this manner the existence ofscale effect on intact rock blocks of different sizes is neglected.Further research and development is required sothat the microproperties, and subsequently the macroproperties,of intact rock blocks of different sizes are automaticallyscaled to fit any pre-defined scaling law.• The effect of increasing confinement on the peak strengthof a jointed rock mass needs further investigation. Figure44a has shown that a slight increase in confinement leveldoes not always lead to a significant increase in rock masspeak strength. A possible explanation is the existence of adominant weak face dipping perpendicular to one of theconfinement orientations. A similar type of phenomenacan occur during a true triaxial test in which an increase inσ2(keeping the same level of σ3) can sometimes lead toshear failure along a joint that strikes parallel to σ2, and,therefore, a decrease in rock mass peak strength instead ofthe expected increase with increase in confinement. Thistype of phenomenon needs further investigation.• At present the primary fragmentation predictions onlytake into account the fragment volume. The shape of thefragments is of critical importance to be able to make predictionsof secondary fragmentation. A very elongatedfragment will exhibit a very different behavior from afragment that is close to spherical in shape. The primaryfragmentation prediction procedure should be enhancedto account for fragment shape as well as fragment volume.77
<strong>Diego</strong> <strong>Mas</strong> <strong>Ivars</strong> TRITA LWR PHD 1058• Although rock mass dilatancy is a natural outcome of aSRM test it has not been analyzed in any of the cases reported.It is suggested to study the dilatancy producedduring testing of a SRM sample in future study cases.• The explicit representation of the in situ joint network viaDFN simulation is one of the key components of theSRM method. The predictions of rock mass behavior obtainedusing the SRM approach are only as good as the representationof the in situ joint network by the DFN. TheSRM approach could be used to learn how the uncertaintyin DFN simulation due to scarce and/or low quality jointdata propagates and impacts rock mass behavior predictions.• The current approach for comparison of in situ microseismicityinduced by caving and SRM microcracking duringtesting does only take into account the orientation ofthe new fractures being formed. If the SRM models arerun in dynamic mode (currently they are run in quasi-staticmode) they could accurately represent the release of energyassociated with microfractures and slip on existingjoints. The methodology could then be enhanced to beable to compare the magnitudes and failure mode of themicroseismic events monitored in situ with the energy releasedand the mode of failure observed as the rock massyields and fails during SRM testing.• Time-dependant mechanisms can lead to rock mass yieldand failure. The impact of stress corrosion in intact rockand joints (Potyondy, 2007) and groundwater redistributiondue to change of loading could be included in the futurewithin the SRM method to gain insight into this typeof behavior.• Further study cases will help to build up confidence in themethodology, and will allow for improvement of its efficiency,robustness and usability.78
Bonded Particle Model for Jointed Rock <strong>Mas</strong>sREFERENCESAmadei B and Goodman RE. 1981. A 3-D constitutive relation for fractured rockmasses. In: Proc Int Symp Mech Behav Structured Media, Ottawa, SelvaduraiAPS, ed. B:249-268.Anderson TL. 1991. Fracture mechanics: fundamentals and applications. Boca Raton,Florida: CRC Press.Barton NR, Lien R and Lunde J. 1974. Engineering classification of rock masses forthe design of tunnel support. Rock Mech. 6(4):189-236.Barton NR. 2002. Some new Q-value correlations to assist in site characterizationand tunnel design. Int J Rock Mech Min Sci. 39(2):185-216.Bieniawski ZT. 1968a. The effect of specimen size on compressive strength of coal.Int J Rock Mech Min Sci Geomech Abstr. 5:325-335.Bieniawski ZT. 1968b. In situ strength and deformation characteristics of coal. EngGeol. 2(5):325-340.Bieniawski ZT and Van Heerden VL. 1975. The significance of in-situ tests on largerock specimens. Int J Rock Mech Min Sci Geomech Abstr. 12:101-113.Bieniawski ZT. 1978. Determining rock mass deformability: Experience from casehistories. Int J Rock Mech Min Sci Geomech Abstr. 15:237-247.Billaux D, Dedecker F and Cundall PA. 2004. A novel approach to studying rockdamage: the three dimensional adaptive continuum / discontinuum code. In:Proc Eurock 2004, Salzburg, W Schubert, ed. Essen: Verlag Glückauf, pp723-728.Brown ET. 1970a. Strength of models of rock with intermittent joints. J Soil MechFound Div ASCE. 96:1935-1949.Brown ET. 1970b. Modes of failure in jointed rock masses. In: Proc 2 nd Cong Int SocRock Mech, Belgrade. 2:3-42.Brummer RK, Li H and Moss A. 2006. The transition from open pit to undergroundmining: An unusual slope failure at Palabora. The South African Institute ofMining and Metallurgy, International Symposium on Stability of Rock Slopesin Open Pit Mining and Civil Engineering, pp. 411–420.Cai M, Kaiser PK, Uno H, Tasaka Y and Minami M. 2004. Estimation of rock massdeformation modulus and strength of jointed hard rock masses using the GSIsystem. Int J Rock Mech Min Sci. 41:3-19.Cai M, Kaiser PK, Tasaka Y and Minami M. 2007. Determination of residualstrength parameters of jointed rock masses using the GSI system. Int J RockMech Min Sci. 44:247-265.Cai M. 2008. Influence of stress path on tunnel excavation response – Numericaltool selection and modeling strategy. Tunnel Undergr Space Tech. 23:618-628.Chappel PA. 1974. Load distribution and deformational response in discontinua.Geotechnique. 24:641-654.Cho N, Martin CD and Sego DC. 2007. A clumped particle model for rock. Int JRock Mech Min Sci. 44:997–1010.Crook A, Wilson JG, Yu J and Owen R. 2003. Computational modelling of the localizeddeformation associated with borehole breakout in quasi-brittle materials.J Petrol Sci Eng. 38:177-186.79
<strong>Diego</strong> <strong>Mas</strong> <strong>Ivars</strong> TRITA LWR PHD 1058Crowder JJ and Bawden WF. 2004. Review of post-peak parameters and behavior ofrock masses: current trends and research.http://www.rocscience.com/library/rocnews/fall2004/Crowder_Bawden.pdfCundall PA, Drescher A and Strack ODL. 1982. Numerical experiments on granularassemblies, measurements and observations. In: Deformation and Failure ofGranular Materials, PA Vemeer, HJ Luger, eds. Rotterdam: Balkema. pp 355-370.Cundall PA, Gómez P, Lorig L, Pierce M, Sainsbury D, Young RP and Napier J.2005. Caving mechanics scoping study. Itasca Consulting Group, Inc., Reportto <strong>Mas</strong>s Mining Technology (MMT) Project, ICG06-2292-1-8D, Caving MechanicsResearch Area.Cundall PA, Pierce M and <strong>Mas</strong> <strong>Ivars</strong> D. 2008. Quantifying the size effect of rockmass strength. In: Proc 1 st South Hemisphere Int Rock Mech Symp(SHIRMS), Perth, Australia, Y Potvin, J Carter, A Dyskin, R Jeffrey, eds, vol1, pp 3-15.Cundall PA. 2008. Recent advances in numerical modelling for large-scale miningprojects. In: Austral Centre Geomech Newsletter, vol 30.Damjanac B, Pierce M and Gil I. 2009. Numerical simulation of rock-mass preconditioningthrough fluid injection. Itasca Consulting Group, ICG09-2487-8D.Deisman N, <strong>Mas</strong> <strong>Ivars</strong> D and Pierce M. 2008a. PFC2D smooth joint contact modelnumerical experiments. In: Proc GeoEdmonton ’08, Edmonton, Canada, Paper83.Deisman N, Chalaturnik RJ, <strong>Mas</strong> <strong>Ivars</strong> D and Darcel C. 2008b. Geomechanical characterizationof coalseam reservoirs: the SRM approach. In: Proc Asia PacificCoalbed Methane Symposium, 22-24 Sept, 2008, <strong>Mas</strong>sarotto P, Golding SD,Fu X, Wei C, Wang GX and Randolph V, eds. Brisbane, Australia, Paper No003.Deisman N and Chalaturnyk RJ. 2008. A methodology for hydrogeomechanical characterizationof coalseam reservoirs. In: Proc GeoEdmonton ’08, Edmonton,Canada, Paper 82.Deisman N, <strong>Mas</strong> <strong>Ivars</strong> D, Darcel C and Chalatrunik RJ. 2009. Empirical and numericalapproaches for geomechanical characterization of coal seam reservoirs.Int J Coal Geol. doi:10.1016/j.coal.2009.11.003.Dershowitz W. 1984. Rock joint systems. PhD thesis, MIT, Cambridge, <strong>Mas</strong>s.Dershowitz WS and Einstein HH. 1988. Characterizing rock joint geometry withjoint system models. Rock Mech Rock Eng. 21:21-51.Dershowitz WS, Lee G, Geier J, Foxford T, LaPointe P and Thomas A. 1995. Frac-Man. Interactive discrete feature analysis, geometric modelling and explorationsimulation. User documentation, Golder Associates Inc, Redmond,Washington.Diederichs MS. 1999. Instability of Hard Rockmasses: The role of tensile damageand relaxation. PhD thesis, Univ Waterloo, Canada.Einstein HH and Hirschfeld RC. 1973. Model studies on mechanics of jointed rock. JSoil Mech Found Div ASCE. 99:229-242.Esmaieli K, Hadjigeorgiou J and Grenon M. 2009. Estimation of synthetic rock massstrength accounting for sample size. In: Proc Int Conf Rock Joints and80
Bonded Particle Model for Jointed Rock <strong>Mas</strong>sJointed Rock <strong>Mas</strong>ses, Kulatilake PHSW, ed. Tucson, Arizona, USA, PaperNo 1034.Fairhurst C, Damjanac B and Brandshaug T. 2007. Rock mass strength and numericalexperiments. In: Proc 35 th Geomech Colloq, Tech Univ Freiberg, InstitutsheftGeotechnik.Fossum AF. 1985. Effective elastic properties for a randomly jointed rock mass. Int JRock Mech Min Sci Geomech Abstr. 22(6):467-470.Gerrard CM. 1982. Equivalent elastic moduli of a rock mass consisting of orthorhombiclayers. Int J Rock Mech Min Sci Geomech Abstr. 19:9-14.Hadjigeorgiou J, Esmaieli K and Grenon M. 2009. Stability analysis of vertical excavationsin hard rock by integrating a fracture system into a PFC model. TunnellUndergr Space Tech. 24:296-308.Hajiabdolmajid V and Kaiser PK. 2002. Modelling slopes in brittle rock. In: ProcNARMS-TAC 2002, R Hammah et al, eds. Toronto: Univ Toronto Press, vol1, pp 331-338.Harries NJ. 2001. Rock mass characterisation for cave mine engineering. PhD thesis,University of Queensland, Brisbane, Australia.Hazzard JF and Young RP. 2000. Simulating acoustic emissions in bonded-particlemodels of rock. Int J Rock Mech Min Sci. 37:867-872.Hazzard JF and Young RP. 2002. Moment tensors and micromechanical models.Tectonophysics. 356:181-197.Hazzard JF and Young RP. 2004. Dynamic modelling of induced seismicity. Int JRock Mech Min Sci. 41:1365-1376.Heuze FE. 1980. Scale effects in the determination of rock mass strength and deformability.Rock Mech Rock Eng. 12:167-192.Hoek E and Brown ET. 1980. Underground excavations in rock. London: Inst MinMetall.Hoek E. 1994. Strength of rock and rock masses. 1SRM News J. 2(2):4-16.Hoek E, Kaiser PK and Bawden WF. 1995. Support of underground excavations inhard rock, p.215. Rotterdam: Balkema.Hoek E and Brown ET. 1997. Practical estimates of rock mass strength. Int J RockMech Min Sci. 34(8):1165-1186.Holt RM, Kjolaas J, Larsen I, Li L, Pillitteri AG and Sonstebo EF. 2005. Comparisonbetween controlled laboratory experiments and discrete particle simulationsof the mechanical behavior of rock. Int J Rock Mech Min Sci. 42:985-995.Hudson JA and Cosgrove JW. 1997. Integrated structural geology and engineeringrock mechanics approach to site characterization. Int J Rock Mech Min Sci.34(3-4): paper No. 136.Itasca Consultants SAS. 2006a. 3FLO, version 2.2. Lyon, ICSAS.Itasca Consulting Group, Inc. 2006b. FLAC 3D – Fast Lagrangian Analysis of Continuain 3 Dimensions, Ver. 3.1. Minneapolis.Itasca Consulting Group Inc. 2008a. PFC 2D – Particle Flow Code in 2 Dimensions,Version 4.0. Minneapolis.Itasca Consulting Group Inc. 2008b. PFC 3D – Particle Flow Code in 3 Dimensions,Version 4.0. Minneapolis.Itasca Consulting Group Inc. 2008c. 3DEC – Three Dimensional Distinct ElementCode, Version 4.1. Minneapolis.81
<strong>Diego</strong> <strong>Mas</strong> <strong>Ivars</strong> TRITA LWR PHD 1058Itasca Consulting Group Inc. 2009. UDEC - Universal Distinct Element Code, Version4.0. Minneapolis.Jaeger JC, Cook NGW and Zimmerman RW. 2007. Fundamentals of rock mechanics(Fourth Edition). Blackwell Publishing Ltd., 475 pp.Kaiser PK, Yazici S and Maloney S. 2001. Mining-induced stress change and consequencesof stress path on excavation stability – a case study. Int J Rock MechMin Sci. 38:167-180.Koyama T and Jing L. 2007. Effects of model scale and particle size on micromechanicalproperties and failure processes of rocks – A particle mechanicsapproach. Eng Anal Boundary Elements. 31:458-472.Kulatilake PHSW, Wang S and Stephansson O. 1993. Effect of finite size joints onthe deformability of jointed rock in three dimensions. Int J Rock Mech MinSci. 30(5):479-501.Kulatilake PHSW, He W, Um J and Wang H. 1997. A physical model study ofjointed rock mass strength under uniaxial compressive loading. Int J RockMech Min Sci. 34(3-4):paper 165.Kulatilake PHSW, Malama B and Wang J. 2001. Physical and particle flow modelingof jointed rock block behavior under uniaxial loading. Int J Rock Mech MinSci. 38:641-657.Martin CD, Tannant DD, Yazici S and Kaiser PK. 1999a. Stress path and instabilityaround mine openings. In: Proc 9th Cong Int Soc Rock Mech, Paris, VouilleG, Berest P, eds. Rotterdam: A A Balkema, vol 1, pp 311-315.Martin CD, Kaiser PK and McCreath R. 1999b. Hoek-Brown parameters for predictingthe depth of brittle failure around tunnels. Can Geotech J. 36:136-151.<strong>Mas</strong> <strong>Ivars</strong> D, Deisman N, Pierce M and Fairhurst C. 2007. The synthetic rock massapproach – a step forward in the characterization of jointed rock masses. In:Proc 11 th Cong Int Soc Rock Mech, Lisbon, Ribeiro e Sousa, Olalla, Grossmann,eds. London: Taylor & Francis, vol 1, pp 485-490.<strong>Mas</strong> <strong>Ivars</strong> D, Pierce M, DeGagné D and Darcel C. 2008a. Anisotropy and scale dependencyin jointed rock-mass strength — A synthetic rock mass study. In:Proc 1st Int FLAC/DEM Symp Numer Modelling, Hart R, Detournay C,Cundall P, eds. Minneapolis: Itasca Consulting Group, Paper 06-01, pp 231-239.<strong>Mas</strong> <strong>Ivars</strong> D, Potyondy DO, Pierce M and Cundall PA. 2008b. The smooth-jointcontact model. In: Proc 8 th World Cong Comp Mech / 5 th Eur Cong CompMeth Appl Sci & Eng, Venice, paper a2735.<strong>Mas</strong> <strong>Ivars</strong> D, Pierce M, Reyes-Montes J and Young RP. 2008c. Caving mechanics —executive summary, Itasca Consulting Group, Inc., Report to <strong>Mas</strong>s MiningTechnology (MMT) Project, ICG08-2292-1-T9-12R2.Min K-B and Jing L. 2003. Numerical determination of the equivalent elastic compliancetensor for fractured rock masses using the distinct element method.Int J Rock Mech Min Sci. 40:795-816.Min K-B. 2004. Fractured rock masses as equivalent continua – a numerical study.PhD thesis, Royal Inst Tech (KTH), Stockholm, Sweden.Munjiza A, Owen DRJ and Bicanic N. 1995. A combined finite/discrete element methodin transient dynamics of fracturing solids. Int J Engng Comput.12(2):145-174.82
Bonded Particle Model for Jointed Rock <strong>Mas</strong>sMunjiza A. 2004. The combined finite-discrete element method. Chichester: Wiley,348 pp.Oda M. 1986. An equivalent continuum model for coupled stress and fluid flowanalysis in jointed rock masses. Water Resour Res. 22(13):1845-1856.Palmstrom A. 1996a. Characterizing rock masses by the RMi for use in practical rockengineering, Part 1: the development of the rock mass index (RMi). TunnelUndergr Space Tech. 11(2):175-188.Palmstrom A. 1996b. Characterizing rock masses by the RMi for use in practical rockengineering, Part 2: some practical applications of the rock mass index (RMi).Tunnel Undergr Space Tech. 11(3):287-303.Park E-S, Martin CD and Christiansson R. 2004. Simulation of the mechanical behaviorof discontinuous rock masses using a bonded-particle model. In: Proc6th North Amer Rock Mech Symp, Houston, Yale D, et al, eds, paperARMA 04-480.Pierce M, Young RP, Reyes-Montes JM and Pettit WS. 2006. Six Monthly TechnicalReport, Caving Mechanics, Sub-Project No. 4.2: Research and MethodologyImprovement, & Sub-Project 4.3, Case Study Application, Itasca ConsultingGroup, Inc., Report to <strong>Mas</strong>s Mining Technology Project, 2004-2007, ICG06-2292-1-T3-40.Pierce M, <strong>Mas</strong> <strong>Ivars</strong> D, Cundall P and Potyondy D. 2007. A synthetic rock massmodel for jointed rock. In: Proc 1st Can-US Rock Mech Symp, Vancouver,Eberhardt E et al, eds., London: Taylor & Francis, pp 341-349.Pierce M, Gaida M and DeGagne D. 2009. Estimation of rock block strength. In:Proc. of the 3rd Canada-U.S. Rock Mechancis Symposium and 20th CanadianRock Mechanics Symposium (RockEng 09 - Rock Engeneering in DifficultConditions), Toronto, ON.Potyondy DO and Cundall PA. 2004. A bonded-particle model for rock. Int J RockMech Min Sci. 41:1329-1364.Potyondy DO and Hazzard JF. 2004. Comparison of modeled and measured staticand dynamic moduli from the Imperial College polyaxial experiment. In Annex5.6 of Final Technical Report (01-09-2001 to 31-08-2004) for SAFETI(Seismic Validation of 3-D Thermo-Mechanical Models for the Prediction ofthe Rock Damage Around Radioactive Spent Fuel Waste), EURATOM Programme,project FIKW-2001-00200, 31-10-2004.ftp://ftp.cordis.europa.eu/pub/fp5-euratom/docs/fp5-euratom_safeti_projrep_en.pdfPotyondy DO. 2007. Simulating Stress Corrosion with a Bonded-Particle Model forRock. Int J Rock Mech Min Sci. 44: 677-691.Potyondy DO and Hazzard JF. 2008. Effects of stress and induced cracking on thestatic and dynamic moduli of rock. In: Proc 1st Int FLAC/DEM Symp NumerModelling, Hart R, Detournay C, Cundall P, eds. Minneapolis: ItascaConsulting Group, Paper 04-03, pp 147-156.Potyondy DO. 2009. Simulating spalling, phase II: feasibility assessment. Itasca ConsultingGroup, ICG09-2502-3F.Potyondy DO, Ekneligoda T and Fälth B. 2009. Simulating spalling, phase II: preliminaryfeasibility assessment. Itasca Consulting Group, ICG08-2502-5F.Potyondy DO, Pierce M, <strong>Mas</strong> <strong>Ivars</strong> D and Cundall PA. 2010. Adding joints to abonded-particle model for rock. (In preparation).83
<strong>Diego</strong> <strong>Mas</strong> <strong>Ivars</strong> TRITA LWR PHD 1058Pratt HR, Black AD, Brown VS and Brace WF. 1972. The effect of specimen size onthe mechanical properties of unjointed diorite. Int J Rock Mech Min SciGeomech Abstr. 9:513-529.Ramamurthy T. 1993. Strength and modulus responses of anisotropic rocks. In:Comprehensive Rock Engineering, vol 1, Hudson JA, ed. Oxford: Pergamon,pp 313-329.Reyes-Montes J, Pettitt W and Young RP. 2007. Validation of a synthetic rock massmodel using excavation induced microseismicity. In: Proc 1st Can-US RockMech Symp, Vancouver, Eberhardt E et al, eds. London: Taylor & Francis,pp 365-369.Reyes-Montes JM, Pettitt WS and Young RP. 2008. Enhanced spatial resolution ofcaving-induced microseismicity. In: Proc 5 th Int Conference and Exhibitionon <strong>Mas</strong>s Mining (<strong>Mas</strong>sMin 2008), Luleå, Sweden, Schunnesson and Nordlund,eds. Luleå University of Technology Press, Luleå, Sweden, pp. 961-970.Rockfield Software Ltd. ELFEN. http://www.rockfield.co.uk/elfen.htm.Sainsbury BL, Pierce M and <strong>Mas</strong> <strong>Ivars</strong> D. 2008a. Simulation of rock-mass strengthanisotropy and scale effects using a Ubiquitous-Joint Rock <strong>Mas</strong>s (UJRM)Model. In: Proc 1st Int FLAC/DEM Symp Numer Modelling, Hart R, DetournayC, Cundall P, eds. Minneapolis: Itasca Consulting Group, Paper 06-02, pp 241-250.Sainsbury BL, Pierce M and <strong>Mas</strong> <strong>Ivars</strong> D. 2008b. Analysis of caving behavior using asynthetic rock mass (SRM) - Ubiquitous Joint Rock <strong>Mas</strong>s (UJRM) ModellingTechnique. In: Proc 1 st Southern Hemisphere International Rock MechanicsSymposium, Potvin Y, Carter J, Dyskin A and Jeffrey R, eds. Perth, Australia,Vol. 1, pp.243-253.Salamon MDG. 1968. Elastic moduli of a stratified rock mass. Int J Rock Mech MinSci Geomech Abstr. 5:519-527.Schöpfer MPJ, Abe S, Childs C and Walsh JJ. 2009. The impact of porosity and crackdensity on the elasticity, strength and friction of cohesive granular materials:Insights from DEM modeling. Int J Rock Mech Min Sci. 46:250-261.Singh B. 1973. Continuum characterization of jointed rock masses. Int J Rock MechMin Sci Geomech Abstr. 10:311-335.Singh M, Rao KS and Ramamurthy T. 2002. Strength and deformational behaviourof jointed rock mass. Rock Mech Rock Engng. 35(1):45-64.Tawadrous AS, DeGagne D, Pierce M and <strong>Mas</strong> <strong>Ivars</strong> D. 2009. Prediction of uniaxialcompression PFC model micro-properties using neural networks. Int J NumerAnal Meth Geomech. 33:15-25.Ting JM, Khwaja M, Meachum LR and Rowell JD. 1993. An ellipse-based discreteelement model for granular materials. Int J Numer Anal Methods Geomech.17:603–23.Tiwari RP and Rao KS. 2006. Post failure behaviour of a rock mass under the influenceof triaxial and true triaxial confinement. Eng Geol. 84:112-129.Vyazmensky A, Elmo D, Stead D and Rance JR. 2007. Combined finite-discrete elementmodelling of surface subsidence associated with block cave mining. In:Proc 1st Can-US Rock Mech Symp, Vancouver, Eberhardt E et al, eds., London:Taylor & Francis, pp 467-475.84
Bonded Particle Model for Jointed Rock <strong>Mas</strong>sVyazmensky A, Elmo D, Stead D and Rance JR. 2008. Numerical analysis of the influenceof geological structures on the development of surface subsidence associatedwith block caving mining. In: Proc 5 th Int Conference and Exhibitionon <strong>Mas</strong>s Mining (<strong>Mas</strong>sMin 2008), Luleå, Sweden, Schunnesson andNordlund, eds. Luleå University of Technology Press, Luleå, Sweden, pp.857-866.Wong RHC, Chau KT, Tang CA, and Lin P. 2001. Analysis of crack coalescence inrock-like materials containing three flaws – Part 1: Experimental approach.Int J Rock Mech Min Sci. 38:909-24.Wong LNY and Einstein HH. 2006. Fracturing behaviour of prismatic specimenscontaining single flaws. In ARMA/USRMS 06-899.Yoshinaka R, Osada M, Park H, Sasaki T and Sasaki K. 2008. Practical determinationof mechanical design parameters of intact rock considering scale effect. EngGeol. 96:173-186.Yoon J, Stephansson O and Dresen G. 2004. Application of design of experimentsto process improvement of PFC model calibration in uniaxial compressionsimulation. In: 4th Asian Rock Mechanics Symposium (ARMS-4), Singapore,Paper 91-ARMS-A0464, 8p.85
<strong>Diego</strong> <strong>Mas</strong> <strong>Ivars</strong> TRITA LWR PHD 1058APENDIX I(David O. Potyondy, Itasca Consulting Group, Inc)All vector and tensor quantities are expressed using indicial notationwith respect to a fixed right-handed rectangular Cartesiancoordinate system. The Einstein summation convention is employed;thus, the repetition of a lower-case index in a term denotesa summation with respect to that index over its range. A dot over avariable indicates a derivative with respect to time.A.1. Strain-application procedure (Strain probe)The strain-application procedure, termed strain probe, applies astrain path to a spherical particle ensemble that has been extractedfrom a discrete-element model. The strain path is described by alist of m strain tensorspεij; p= 1, 2, , m.(21)pThe εijare uniform over the spherical region — i.e., they do notvary with position. The strain is applied in m stages such that thetotal applied strain at the end of stage m is given bymm−1 0∑ ∑ ( ) , 0.(22)ε = ∆ ε = ε − ε ε =m p p pij ij ij ij ijp= 1 p=1There are two modes of strain application that correspond withmoving either all particles (the full mode) or a set of particles thatlie on the ensemble boundary (the boundary mode). In the followingsections, we describe the procedures by which the strain is measuredand applied, summarize the entire strain-application procedure,and show that an exact match between applied and measuredstrain cannot, in general, be achieved while also maintaining forceequilibrium for each interior particle in the system.A.2. Measuring the strainStrain is measured within the spherical region using the velocitygradienttensor measurement procedure of Potyondy and Cundall(2004). The velocity-gradient measurement procedure computesthe velocity-gradient tensor ( αij) that provides a best-fit to thetranslational velocities of all particles with centroids in the region.The displacement-gradient tensor ( α ) that describes movementoccurring over a time interval t * is found by approximating thetime integral of the velocity-gradient tensor as a summation overthe timesteps of size ∆ t comprising the intervalij86
Bonded Particle Model for Jointed Rock <strong>Mas</strong>s*tij= ∫ ijdt ≅∑ij∆ t, *where t = ∑∆t.(23)0α α αThe strain tensor ( εij) that describes movement occurring over atime interval t * is the symmetric portion of the displacementgradienttensorA.3. Applying the strain1εij = ( αij + αji ).(24)2Denote the strain increment to be applied during stage p by∆ ε = ε − ε , ε = 0.(25)p p p−1 0ij ij ij ijThe strain is applied in a proportional fashion such that the totalapplied strain during the stage is given byp−1( )pε λ = ε + λ∆ε , 0 ≤λ≤ 1.(26)ij ij ijBy enforcing the condition that λ increases linearly with time, wecan writetλ ( t) = (27)*t*where t is the elapsed time since the start of the stage, and t isthe total time of strain application. It is convenient to choose t*to satisfy* * 0t = N ∆ t(28)*where N is the approximate number of timesteps during the0stage, and ∆ t is the size of the timestep at the start of the stage.*The rate of strain application is controlled by N . The total appliedstrain during the stage is expressed as a function of time bysubstituting (27) into (26) to obtainp−1 ⎛ t ⎞ p*εij ( t) = εij + ⎜ ε , 0 .* ⎟∆ ij≤t ≤t⎝t⎠(29)87
<strong>Diego</strong> <strong>Mas</strong> <strong>Ivars</strong> TRITA LWR PHD 1058The strain rate corresponding with this strain field is constant andequal to ε ∂ 1 pij ( ij ) .* ijtε ⎛ ⎞= = ⎜ ⎟∆∂ ⎝t⎠ε(30)The velocity field corresponding with this strain field varies withposition ( xj) and is equal to⎛ 1 ⎞ pi=i+ ∆ε* ij j−j( )v v ⎜ ⎟ x x⎝t⎠(31)where xjand viare the position and velocity of the sphere center.This velocity field is derived as follows.The velocity-gradient tensor relates the velocities v i= u iat twoneighboring points. Let the points be located instantaneously at xiand xi+ dxi. The difference in velocity between these two pointsis∂vdv = dx = v dx = α dx = ε − ω dx (32)( )ii j i,j j ij j ij ij j∂xjwhereαijhas been decomposed into the strain-rate (symmetric: εij = εji) and spin (antisymmetric: ω ij= − ω ji) tensors. Thevelocity at an arbitrary point ( xj) is found by substituting1 p⎛ ⎞εij= ⎜ * ⎟∆εij⎝t⎠ ω = 0 (no rigid-body rotation)ij(33)into (32) and integrating to obtainv1 1⎝t⎠ ⎝t⎠ij⎛ ⎞ p ⎛ ⎞ p∫dvi = vi − vi = ⎜ * ⎟∆ εij ∫ dxj= ⎜ ε* ⎟∆ ij ( xj−xj ) (34)vixxj88
Bonded Particle Model for Jointed Rock <strong>Mas</strong>sp∆ ε ijdoes not vary with posi-where we make use of the fact thattion.A.3. Procedure summaryThe strain-application procedure is implemented as a probe thatoperates upon a spherical particle ensemble. The procedure consistsof probe initialization followed by strain-path application.The probe is initialized as follows. (a) The probe center and diameterare specified. All particles outside of the probe region are deleted,and a set of boundary particles is identified. A measurementsphere encompassing the interior particles is placed at the probecenter. The measurement sphere is used to compute average strainas described above. (b) The strain path is specified. (c) The approximatenumber of steps over which to apply the strain incrementduring each stage ( N ) is specified. (d) The strain-application*mode is specified as either full ( SA= 1) or boundary ( SA= 0 ). Theset of controlled particles to be used when applying the strain aredefined as either all particles (when SA= 1) or only the boundaryparticles (when SA= 0 ). (e) The rotational velocities of all particlesare freed, and the translational velocities of all boundary particlesare fixed. These fixity conditions remain constant throughout theprobe event. (f) The translational velocities of the interior particlesare freed, the translational velocities of all particles are set to zero,and the system is cycled until a state of static equilibrium is obtained.This step eliminates any rigid-body motion from the particleensemble and justifies setting vi= 0 in (31).The strain is applied in m stages. During each stage: (a) compute* * 0t = N ∆ t ; (b) fix the translational velocity of the controlled particlesto satisfy (31); (c) cycle the system until the elapsed time*reaches t ; (d) free the translational velocity of each interior particle,set the translational velocity of all particles to zero, and cyclethe system until a state of static equilibrium is obtained.A.4. Procedure behaviorDenote the total strain applied to the controlled particles and theAMtotal strain measured within the particle ensemble by εijand εij,*respectively, and assume that N is chosen large enough to ensurequasi-static response. Consider the system behavior during eachstage while cycling to reach t * . During this period, the motion ofM Athe controlled particles is imposed. When SA= 1, then εij= εijas expected; but when SA= 0 , thenMεijtracks withAεijbut doesnot match it exactly. This is caused by the inability of the particleensemble to accommodate an imposed strain field while maintainingforce equilibrium for each particle; the interior particles adjustto the imposed strain field in order to maintain static equilibrium.These adjustments perturb the internal strain field. Similar adjust-89
<strong>Diego</strong> <strong>Mas</strong> <strong>Ivars</strong> TRITA LWR PHD 1058*ments occur when t > t while cycling to reach static equilibrium.Therefore, for both strain-application modes, we find thatM Aεij≅ εij— i.e., the measured strain approximately matches theimposed strain; an exact match cannot be achieved while alsomaintaining force equilibrium for each interior particle in the system.90
Bonded Particle Model for Jointed Rock <strong>Mas</strong>sAPENDIX IIB.1. Compliance-measurement procedure (Strain perturbation method)The compliance-measurement procedure measures the compliancetensor of a spherical particle ensemble that has been extractedfrom a discrete-element model. The methodology is termed “strainperturbation method” because it is based on the application of sixseparate strain perturbations to the SRM sample. To do this, andto decrease the simulation times, we use the full strain-applicationmode of the PFC 3D strain probe (see Appendix I), whereby the velocitiesof all particles are controlled to conform to a specified uniformstrain tensor. An equilibration stage occurs after each strainperturbation is applied. During the equilibration stage, the boundaryparticles are fixed and the interior particles are freed and allowedto rearrange themselves to accommodate the imposed strainfield. Each time that a strain perturbation is applied, the inducedstress perturbation is measured within a spherical region centeredwithin the SRM sample using the stress and velocity-gradient tensormeasurement procedures described in (Potyondy and Cundall,2004).B.2. Measuring the stressThe stress-measurement procedure of Potyondy and Cundall(2004) computes the average stress, σij, within the region basedon the contact forces, contact orientations and region porosity.The expression used to compute the average stress is derived byassuming that (a) body forces are absent, (b) each particle is in fullforce equilibrium, and (c) parallel-bond moments do not contributeto the average stress. Violation of assumption (b) manifestsitself in a non-symmetry of the stress tensor, and parallel-bondmoments can also produce a nonsymmetric stress tensor. Thestresses used by the probe are made symmetric by setting1σ ← σ + σ . The effect of neglecting the parallel-bond2ij( )ijmoment is not known.B.3. Measuring the compliancejiThe procedure for measuring the compliance matrix is based onthe generalized stress strain relationshipε = S σ(35)ij ijkl klwhere strain and stress are 2 nd order tensors and the compliancetensor is of 4 th order. Because of the symmetry of strain and stress(they both have only six independent components) there are actuallyonly 36 compliance coefficients in the most general form ofHooke’s law, from which only 21 coefficients are independent91
<strong>Diego</strong> <strong>Mas</strong> <strong>Ivars</strong> TRITA LWR PHD 1058(Jaeger et al. 2007) Therefore, for convenience, the same relationcan be expressed in the following matrix form.⎛ε⎞xx⎜ ⎟ ⎛ S⎜⎜ε ⎟yy⎜ ⎟⎜ S⎜ε⎟⎜zz⎟ = ⎜S⎜⎜γ⎟⎜xyS⎜ ⎟⎜⎜γxz ⎟⎜ S⎜ ⎟ ⎝ S⎝γyz ⎠112131415161SSSSSS122232425262SSSSSS132333435363SSSSSS142434445464SSSSSS152535455565SSSSSS162636465666⎛σ⎞⎜⎟⎜⎟σ⎜⎟⎜σ⎟⎜⎟⎜σ⎟⎜⎟⎜σ⎠⎜⎝σxxyyzzxyxzyz⎞⎟⎟⎟⎟⎟⎟⎟⎟⎟⎠(36)When six sets of strain perturbations are imposed and the stressresponses are measured, the above expression can be generalizedin the following matrix form:1⎛εxx⎜1⎜εyy⎜ 1⎜εzz1⎜γxy⎜ 1⎜γxz⎜ 1⎝γyzεεεγγγ2xx2yy2zz2xy2xz2yzεεεγγγ3xx3yy3zz3xy3xz3yzεεεγγγ4xx4yy4zz4xy4xz4yzεεεγγγ5xx5yy5zz5xy5xz5yz6ε ⎞xx⎛ S⎟ ⎜6εyy ⎟ ⎜ S6ε⎟ ⎜zz ⎟ = ⎜S6γ ⎟xy⎜ S6 ⎟ ⎜γxz ⎟ ⎜ S6γ ⎟yz ⎠ ⎝ S112131415161SSSSSS122232425262SSSSSS132333435363SSSSSS142434445464SSSSSS152535455565SSSSSS1626364656661⎞⎛σxx⎟⎜1⎟⎜σyy⎟⎜1⎟⎜σzz1⎟⎜σxy⎟⎜1⎟⎜σxz⎜ 1⎠⎝σyzσσσσσσ2xx2yy2zz2xy2xz2yzσσσσσσ3xx3yy3zz3xy3xz3yzσσσσσσ4xx4yy4zz4xy4xz4yzσσσσσσ5xx5yy5zz5xy5xz5yz6σ ⎞xx⎟6σyy ⎟6σ⎟(37)zz ⎟6σ ⎟xy6 ⎟σxz ⎟6σ ⎟yz ⎠where each one of the six applied strain perturbations and theircorresponding measured stress responses are denoted with a differentsuperscript. Each strain component is the imposed incrementalstrain component applied and each stress component is theincremental stress component measured (the stress state before thestrain perturbation is applied has been previously measured in orderto obtain the incremental stress response to each strain perturbation)In other words,[ ε] [ S][ σ]= (38)Hence, the compliance matrix can be obtained as follows:[ ] = [ ε ][ σ ] −1S (39)The six small strain perturbations must be chosen so that they areorthogonal to one another – i.e. they must not be linear combinationsof one another. Therefore the six small strain perturbationsapplied encompass three compressive strain increments in eachaxial direction and three shear-strain increments. In each one ofthe six strain perturbations only one strain component is given anon-null magnitude, while the rest of the components are null.92
Bonded Particle Model for Jointed Rock <strong>Mas</strong>sStrain perturbation 1⎡10 0⎤= ∆ε ⎢ ⎥⎢0 0 0⎥(40)⎢⎣0 0 0⎥⎦Strain perturbation 2⎡00 0⎤= ∆ε ⎢ ⎥⎢0 1 0⎥(41)⎢⎣0 0 0⎥⎦Strain Perturbation 3⎡00 0⎤= ∆ε ⎢ ⎥⎢0 0 0⎥(42)⎢⎣0 0 1⎥⎦Strain perturbation 4:⎡ 0 1 0⎤⎢ 2 ⎥= ∆ε ⎢ 1 0 0⎥(43)⎢2⎥⎢0 0 0⎣ ⎥⎦Strain perturbation 5:⎡ 0 0 1 ⎤⎢ 2⎥= ∆ε ⎢ 0 0 0 ⎥ (44)⎢ 1 0 0 ⎥⎣ 2 ⎦Strain perturbation 6⎡00 0 ⎤⎢ ⎥= ∆ε ⎢00 1 ⎥ (45)⎢21⎥⎢00⎣ 2 ⎥⎦where ∆ ε defines the magnitude of the strain perturbations.If we are trying to obtain the initial compliance matrix (i.e. whenthe SRM sample has been just generated and brought to initialequilibrium), then the magnitude of the non-null components ofthe strain perturbation tensors, ∆ ε , is some small number in theorder of -1e-4 (negative sign denotes compression). In this case,the chosen value will depend on the stiffness and strength of theSRM sample. The magnitude of the non-null components of thesix strain excursions used to derive the compliance matrix at anystate n other than the initial will vary depending on the strengthand stiffness of the rock mass as well as the level of damage causedin the previous steps. The strain magnitude has to be large enoughto induce enough deformation.93
<strong>Diego</strong> <strong>Mas</strong> <strong>Ivars</strong> TRITA LWR PHD 1058As explained in Appendix I, the total measured average straintracks with the total applied strain but will, in general, not match itexactly. For this reason, to be more accurate in the derivation ofthe compliance tensor, the applied strain increments are used inequation (37) instead of the measured strain response of the assembly.94