Is your super working for you? - ComSec
Is your super working for you? - ComSec
Is your super working for you? - ComSec

Create successful ePaper yourself
Turn your PDF publications into a flip-book with our unique Google optimized e-Paper software.
Selector’s List®Of top rated managed funds Spring 2009<strong>Is</strong> <strong><strong>you</strong>r</strong> <strong>super</strong><strong>working</strong> <strong>for</strong> <strong>you</strong>?How the dollar affects <strong><strong>you</strong>r</strong> portfolioplus Economic Update with Craig James,CommSec Chief EconomistTop rated Unit Trusts, Superannuation,Pension and Multisector Funds
Matt ComynManaging Director, CommSecThe gains in the Australian stockmarket over the last three months continueto surprise and amaze me. These gains and the recently announcedchanges to <strong>super</strong>annuation contribution caps have led us to consider therelevance of <strong>super</strong> investment. We explore this issue with three leadingcommentators.Along with the stockmarket our currency has had a bumpy ride. As <strong>you</strong>’ll readin our article that tracks the <strong>for</strong>tunes of the Australian dollar in recent times,some further volatility is expected but the longer term outlook seems to bepositive, with some of the usual caveats.One reason <strong>for</strong> the Aussie dollar’s success is Australia’s greater exposure torising commodity prices and continuing growth in Asia, and particularly China.In fact, CommSec’s Chief Economist Craig James suggests investors couldspend less time focusing on growth rates in the US and Europe and moretime focusing on developing world economies, especially China. Developingnations have become the drivers of global economic growth, and that meansboth good and bad news <strong>for</strong> Australia, writes James. While rising demand <strong>for</strong>commodities will push prices higher, benefiting mining and mining services,the Australian dollar is likely to rise further, putting downward pressure onmanufacturing.Inside this month’s Selector’s List ® we also:›› Look at how clients could manage volatility better within portfolios withSMART Risk Management, a consolidated suite of tool <strong>for</strong> investors witha margin loan, making it easier to manage <strong><strong>you</strong>r</strong> margin loan.›› Funds in focus this month include:– Perpetual’s actively managed investment opportunities – Industrial ShareFund and Concentrated Equity Fund.– Man Investments with two investment opportunities – OM-IP 3AHL andOM-IP Alpha fund.– The CBA Capital Series Trio – allows <strong>you</strong> to invest in three strategies withcapital protection.– Cromwell Riverpark Trust – an investment with the potential <strong>for</strong> a greatincome return.Finally, a reminder of our move to an online version of Selector’s List ® .We’re excited about presenting our news, in<strong>for</strong>mation and per<strong>for</strong>mancetables to <strong>you</strong> in the dynamic online space of the CommSec website.See the back page <strong>for</strong> details of how to receive our free email reminderof when Selector’s List ® is next published online.In this issueFeatures03 Super. <strong>Is</strong> it <strong>working</strong> <strong>for</strong> <strong>you</strong>?05 Currency. How is the dollaraffecting <strong><strong>you</strong>r</strong> investments?06 SMART risk management07 Man Investments OM-IP09 Perpetual. Getting active10 Capital Series Trio11 Index Funds. A newand savvy approach12 What’s new at CommSecDirect Managed Funds?Regulars13 Economic update15 Unit Trusts16 Super and Pensions17 Multisector funds18 Broker nomination <strong>for</strong>m19 PDS order <strong>for</strong>m20 Free offer <strong>for</strong>Selector’s List onlineContact usPhone13 15 208am-5pm Sydney time Mon-FriVisit our websitefunds.commsec.com.auEmaildirectfunds@commsec.com.aupage 2
Super. <strong>Is</strong> it <strong>working</strong> <strong>for</strong> <strong>you</strong>?Superannuation has been attracting all the wrong sort of publicitylately but don’t jump ship, the experts warn.The global financial crisis and its devastating effect on <strong>super</strong>returns has been a shock <strong>for</strong> many who have becomeaccustomed to double digit growth <strong>for</strong> years. Then the rulechanges, which began on 1 July this year, gave those on highincomes another reason to review their investment strategies.But don’t panic. Superannuation is still an “incredibly powerful”investment, says financial commentator, Paul Clitheroe.When it comes to a poorly per<strong>for</strong>ming portfolio, it’s time to reassess<strong><strong>you</strong>r</strong> investment strategy <strong>for</strong> <strong><strong>you</strong>r</strong> whole portfolio, to make sure thatit’s right <strong>for</strong> <strong><strong>you</strong>r</strong> risk profile, <strong><strong>you</strong>r</strong> age and <strong><strong>you</strong>r</strong> retirement plans.Meanwhile the rule changes mean that the ability to put moneyinto <strong>super</strong>annuation has been greatly constrained.Smaller contributionsFor example, the reduction in the concessional contributionsfrom $50,000 to $25,000 <strong>for</strong> those aged under 50, and from$100,000 to $50,000 <strong>for</strong> those 50 and over, could mean adifference of more than $350,000 at age 57 <strong>for</strong> a 47 year oldwho’s earning $80,000, with $100,000 in <strong>super</strong>, on a marginalrate of 30 percent, according to calculations by Smartinvestormagazine (August 2009).If the 47 year old were still able to contribute $50,000 a year(in employer contributions and salary sacrifice), their balancewould be $894,548 at retirement instead of only $540,563,Smartinvestor reports.“The many people in my age group who were hoping to makequite significant contributions to <strong>super</strong>annuation over the nextdecade are not going to be able to,” says Clitheroe.“It doesn’t take <strong>super</strong>annuation out of play, but what it doesmean is that <strong>you</strong>’re going to max out on <strong><strong>you</strong>r</strong> <strong>super</strong> contributioneach year much earlier than <strong>you</strong> thought. The reality is that <strong>for</strong>many Australians the restrictions mean there won’t be enoughin <strong>super</strong>annuation at retirement <strong>for</strong> them to live the sort of lifethey were dreaming of,” he says.It’s worth noting that only those on higher incomes, earning morethan around $80,000, are seriously affected by the rule changes.The Commonwealth Private Bank’s Chief Investment OfficerProfessor Ron Bewley points out that many people werecontributing no more than about $25,000 to <strong>super</strong> anyway.Aiming <strong>for</strong> the “jam and cream”For those who are able to af<strong>for</strong>d to make the maximumconcessional contributions to their <strong>super</strong> and have some leftover, Bewley suggests the “bread, butter, jam and cream”investment approach.“The bread and butter might be the <strong>super</strong> fund with the aimof achieving a liveable but maybe not a great income when<strong>you</strong>’re retired. The jam is the little extra – an investmentproperty, equity portfolio or diversified portfolio outside of <strong>super</strong>.Then the cream at the top is maybe a small portion of one’swealth that might be geared in equities that, over a reasonablylong time like 10 or 20 years, might be expected to give a niceextra <strong>for</strong> the days in retirement.You have to account <strong>for</strong> uncertainty, says Bewley. “The breadand butter is solid; it’s never going to go up or down too much,it’s something <strong>you</strong> could live off. The jam’s a little more risky;it gives a slightly better return. And <strong>you</strong> find the cream canbounce all over the place and <strong>you</strong> don’t mind because evenif <strong>you</strong> lost it all <strong>you</strong> still survive.”Colonial First State Senior Technical Manager, Deborah Wixtedagrees that there’s value in using investments outside <strong>super</strong> –such as property, shares and managed funds – particularly totry to hedge legislative risk.Focus on the big pictureBeyond the concessional, or tax-free, contributions to <strong>super</strong>is the ability to contribute an after-tax $150,000 per year or$450,000 over three years and that’s where those with thechance to accumulate their cash should really be putting theirattention, says Bewley.Most people should already be <strong>working</strong> at having somethingoutside of <strong>super</strong>, maybe a geared fund that allows <strong>you</strong> to transfermoney into <strong>super</strong> at the appropriate time to meet the rules andto fit <strong><strong>you</strong>r</strong> retirement planning, he says.If <strong>you</strong> transfer the money into a <strong>super</strong> fund it will attract minimalcapital gains tax in the fund, says Bewley.“In fact, if <strong>you</strong> don’t sell there’s none. And if <strong>you</strong> go into pensionmode, then there’s no capital gains tax. So <strong>you</strong>’re effectivelytransferring wealth creation into a <strong>super</strong> fund that will possiblynever be taxed <strong>for</strong> capital gains.”Then the tax on any capital gains made outside <strong>super</strong> is nowbased on a much smaller income. “It’s a nice little bit of icingon the cake to have some money outside <strong>working</strong> <strong>for</strong> <strong>you</strong> while<strong>you</strong>’re in retirement.”It should be noted that capital gains tax may have to be paidwhen <strong>you</strong> sell any shares, property or managed funds investmentsto move them into <strong>super</strong>. Depending on the investment and howlong <strong>you</strong>’ve held it, this can be significant and must beconsidered if contemplating such a strategy.“Obviously every dollar is important, but the important part isgetting the big strategy right, the big picture, and not fiddlinground at the edges,” Bewley says.Another example of the benefits of <strong>super</strong> is the transition-toretirementstrategy, <strong>for</strong> those who convert their <strong>super</strong> to apension and then withdraw some pension payments whilesalary sacrificing back into <strong>super</strong>, says Wixted.“The tax benefits alone on that strategy mean that even if <strong>you</strong>had negative returns <strong>for</strong> 10 years, <strong>you</strong>’ll still have more than if<strong>you</strong> hadn’t done anything.page 3
Super contd...“You can’t overstate those benefits,” says Wixted. “For mostpeople, it’s the best thing they’ll ever get their hands on.”Start earlyIt pays to start thinking about <strong><strong>you</strong>r</strong> <strong>super</strong> strategy earlier ratherthan later in life, says Wixted.“Generally people completely ignore their <strong>super</strong>annuation andthoughts of making additional contributions until they suddenlyrealise that retirement isn’t that far away. Then they want tothrow in as much money as possible,” she says.Making top-ups to <strong><strong>you</strong>r</strong> <strong>super</strong> at a <strong>you</strong>nger age, no matter howsmall, says Wixted, will all help later on.“The fact that it will be invested and earning, along with thepower of compound interest, means it has a chance to growso <strong>you</strong> don’t need to look <strong>for</strong> big amounts of money to put into<strong>super</strong> later on down the track,” she says.For those who haven’t heeded the early saving call, the abilityto contribute after-tax amounts ($150,000 per year or $450,000over three years) to <strong>super</strong> allows large amounts to be investedin later years. “It’s a good strategy because even though <strong>you</strong>’vealready paid tax on the contribution, there’s a benefit by investingit in the <strong>super</strong> system rather than further attracting marginal ratesof tax on the earnings outside of <strong>super</strong>,” says Wixted.It’s about seeing <strong>super</strong> as a tax-effective structure to holdinvestments in, rather than an investment in itself, Wixted says.Powerful incentive“Realistically, the average Australian worker is still paying 30 to 33percent tax so the ability to put money into <strong>super</strong>annuation at a15 percent tax rate is still incredibly powerful,” says Clitheroe.“Pick on me <strong>for</strong> a second: it’s my choice to earn a dollar. I caneither take home (after the Medicare levy) about 54 cents in mypocket or I can salary sacrifice into <strong>super</strong>annuation and have85 cents in <strong>super</strong>.“And how am I going to get richer – investing 85 cents orinvesting 54 cents?“I’d be crazy not to use <strong>super</strong>annuation when I can invest in atax-effective environment and take all of that money out tax-freeat age 60 if I wish.“If <strong>super</strong> alone isn’t going to be enough <strong>for</strong> my particularsituation, then I need to think about investments outside<strong>super</strong>annuation,” Clitheroe says.But don’t make the mistake of seeing <strong>super</strong> as completelyseparate from the rest of <strong><strong>you</strong>r</strong> portfolio, he says.“Let’s say <strong>you</strong> had $100,000 in <strong><strong>you</strong>r</strong> name and $100,000 in<strong>super</strong>, and <strong>you</strong> owned a house and with <strong><strong>you</strong>r</strong> investment money,on <strong><strong>you</strong>r</strong> $200,000 ($100,000 in <strong>super</strong> and $100,000 out of<strong>super</strong>) <strong>you</strong> wanted $100,000 in shares and $100,000 in interestbearing investments. You’re actually better off putting $100,000in interest bearing investments in <strong>super</strong>annuation and holding$100,000 worth of shares in <strong><strong>you</strong>r</strong> own name.“Unless <strong>you</strong>’re paying below the 15 percent rate of tax,the reality is that <strong>super</strong>annuation remains a no-brainer.“Super is still terrific,” Clitheroe says.Plan <strong>for</strong> the market cyclesWith 10 years to go to retirement, people should be startingto think about changing their asset allocation to accommodatepotential downturns in the market, says Bewley.“Ten years out <strong>you</strong> start to think about tilting <strong><strong>you</strong>r</strong> allocation;five years out <strong>you</strong>’re certainly doing something about it,” he says.“It’s all about understanding the risks associated with having todraw down at a possibly bad time, because nobody can predictthe bad times. The rule of diversification needs to be tailored tosuit <strong><strong>you</strong>r</strong> circumstances. It depends on <strong><strong>you</strong>r</strong> time horizon and<strong><strong>you</strong>r</strong> possible need <strong>for</strong> funds in the interim,” says Bewley.“Say <strong>you</strong> have a 20 year time horizon. Given past data andtheory behind risk premium, <strong>you</strong>’d expect Australian equitiesto beat everything. So <strong>you</strong> could be 100 percent in Australianequities and that would be a good thing over the long run.But had <strong>you</strong> been doing that recently and the market felland <strong>you</strong> suddenly had to sell, <strong>you</strong>’d be selling at a low andbe crucified. Whereas if <strong>you</strong> could wait another five years itmight be up again – who knows where the market will go?”The whole point of that diversification, says Bewley, is to keepthe return not too high and not too low. There’s alwayssomething <strong>you</strong> can sell down if needs be.He acknowledges that not everyone can af<strong>for</strong>d to create aportfolio with the ideal exposure to local and internationalequities, bonds and property.“It’s not an easy balancing act at all. So <strong>you</strong> need the incomeprotection insurance, and all those things that go with it.Next steps››Review available investment fund options online atwww.funds.commsec.com.au›› Keep up to date with the rule changes at the AustralianTax Office website, www.ato.gov.auTo find out moreFor more in<strong>for</strong>mation, or to obtain a Product DisclosureStatement, visit www.funds.commsec.com.au, or emaildirectfunds@commsec.com.au or call a Funds specialiston 13 15 20, 8am – 5pm Monday to Friday (Sydney time).Important In<strong>for</strong>mation: Commonwealth Securities Limited ABN 60 067 254 399,AFSL 238814 is a wholly owned but non-guaranteed subsidiary of CommonwealthBank of Australia ABN 48 123 123 124 AFSL 234945 and a participant of the ASXGroup and the Sydney Futures Exchange. The in<strong>for</strong>mation contained in this newsletterhas been prepared without taking account of the objectives, needs, financial andtaxation situation of any particular individual. For this reason any individual should,be<strong>for</strong>e acting on the in<strong>for</strong>mation, consider the appropriateness of it having regard to<strong><strong>you</strong>r</strong> objectives, needs, financial and taxation situation and if necessary, seekappropriate independent financial and taxation advice. If the advice relates to aparticular financial product, <strong>you</strong> should obtain a Product Disclosure Statement (PDS) orprospectus relating to the product and consider it be<strong>for</strong>e making any decision aboutwhether to acquire the product. PDS’s are available from Commonwealth Securities atfunds.commsec.com.au or by contacting 13 15 20. Commonwealth Securities doesnot guarantee the per<strong>for</strong>mance of any fund or trust and makes no specificrecommendation on funds or trusts included in any prospectus or offer document onits web site. Past per<strong>for</strong>mance is not indicative of future per<strong>for</strong>mance.page 4
Currency. How is the dollaraffecting <strong><strong>you</strong>r</strong> investment?If <strong>you</strong> are looking <strong>for</strong> a sign that the Australian and globaleconomies are on the mend <strong>you</strong> need look no further thanthe Australian dollar.At the time of printing, the Aussie dollar is trading at aroundUS84c, a remarkable comeback compared with its low ofUS60c last October when the global economy was plunging intorecession and Australia was caught up in the negative sentiment.In fact, the Aussie dollar has been one of the star per<strong>for</strong>mersof 2009, rising 18 percent against the US dollar, 16 percentagainst the euro and 26 percent against the Japanese yen.“The Australian dollar tends to do well when the global economyis picking up,” says Commonwealth Bank’s Chief CurrencyStrategist, Richard Grace. What’s more, he points out thatAustralia is in better economic health than most of its peers.We have greater exposure to rising commodity prices and tocontinuing growth in China and the Asian region.US dollar is under pressureBut beneath the story of the Aussie dollar’s gain is the evengreater story of the US dollar’s loss.The US dollar and the yen are seen as safe-haven currencieswhen investors are at their most fearful. As the global economypicks up, <strong>for</strong>eign investors are scaling back the flow of moneyinto the US to diversify their portfolio risk.This alone would be enough to boost the value of the Aussiedollar, but it is also gaining support from other quarters.As the global economy begins to show encouraging signsof stabilising, investors are on the prowl <strong>for</strong> opportunities andAustralia is proving more resilient than most. The Australianeconomy is attracting admiring glances – and increasingamounts of cash – from overseas investors.Although the local share market is guided by Wall Street, risingcommodity prices should boost Australia’s economic activityand provide attractive opportunities <strong>for</strong> share investors.Resources stocks will benefit but the rise in the dollar is alsopositive <strong>for</strong> importers of goods and raw materials.On the flip side, companies that rely on the export of goodsand services will be less competitive and investors in overseasmarkets may need to hedge their currency exposure.Good signs ahead <strong>for</strong> Aussie dollarGrace says it’s possible the Aussie dollar may have shot up toofar, too fast, and a pullback to below US80c is possible in theshort term. But, he says, the combination of positive economicfactors will support the currency through to the end of the yearand beyond.In its latest quarterly statement on monetary policy, the ReserveBank of Australia <strong>for</strong>ecasts the Australian economy will grow by0.5 percent this year, 2.25 percent next year and 3.75 percent in2011.The rapid improvement in the growth outlook is already evidentin the return of investor confidence, but investors need to beaware of the consequences of growth. Inflation is expected torise and so too are interest rates.“The RBA is indicating it might raise interest rates and no othercountry is doing this”, says Grace. The cash rate is currentlyat a 49-year low of 3 percent, but this is already a substantialpremium on the US cash rate of 0.25 percent and the UK rate of0.5 percent.While the yield differential is drawing in <strong>for</strong>eign investment,any further widening in interest rate spreads is very supportive<strong>for</strong> the Australian dollar, but it also increases the risk of capitallosses <strong>for</strong> bond investors unless they are prepared to holdto maturity.The RBA is preparing the market <strong>for</strong> a return to “a more normalsetting”, generally reckoned to be around 5 percent, in gradualinstalments over the next two years.Financial markets are already anticipating a small 0.25 percentrise in the official cash rate later this year.The CommSec Equities Research team studies marketand economic movements closely and brings <strong>you</strong> a weeklysummary in CommSec Research Insight delivered to <strong><strong>you</strong>r</strong>desktop. If <strong>you</strong> are a registered CommSec client, <strong>you</strong>’ll haveaccess to a number of key subscriptions. To sign up <strong>for</strong>subscriptions on CommSec logon then select My Portfoliothen select Profile then select My Preferences thenselect Subscriptions.To find out moreFor more in<strong>for</strong>mation, or to obtain a Product DisclosureStatement, visit www.funds.commsec.com.au, or emaildirectfunds@commsec.com.au or call a Funds specialiston 13 15 20, 8am – 5pm Monday to Friday (Sydney time).Important In<strong>for</strong>mation: Commonwealth Securities Limited ABN 60 067 254 399, AFSL 238814 is a wholly owned but non-guaranteed subsidiary of Commonwealth Bank ofAustralia ABN 48 123 123 124 AFSL 234945 and a participant of the ASX Group and the Sydney Futures Exchange. The in<strong>for</strong>mation contained in this newsletter has been preparedwithout taking account of the objectives, needs, financial and taxation situation of any particular individual. For this reason any individual should, be<strong>for</strong>e acting on the in<strong>for</strong>mation,consider the appropriateness of it having regard to <strong><strong>you</strong>r</strong> objectives, needs, financial and taxation situation and if necessary, seek appropriate independent financial and taxationadvice. If the advice relates to a particular financial product, <strong>you</strong> should obtain a Product Disclosure Statement (PDS) or prospectus relating to the product and consider it be<strong>for</strong>emaking any decision about whether to acquire the product. PDS’s are available from Commonwealth Securities at funds.commsec.com.au or by contacting 13 15 20.Commonwealth Securities does not guarantee the per<strong>for</strong>mance of any fund or trust and makes no specific recommendation on funds or trusts included in any prospectus or offerdocument on its web site. Past per<strong>for</strong>mance is not indicative of future per<strong>for</strong>mance.page 5
SMART risk managementSMART investing = creating wealthwhile managing riskAfter the marked volatility of the first half of this year, marketshave been picking up, boosted by signs of recovery in Australiaand overseas economies. At this time in the cycle, investors maywell be looking <strong>for</strong> potential opportunities, and ways to build alarger, stronger portfolio <strong>for</strong> the future.One tool that investors may be considering to boost theirpurchasing and investment power is a margin loan. As manyinvestors know, margin loans can be powerful wealth creationtools — and gearing offers the potential to maximise returns.But what about possible risks? It’s true that there are potentialrisks — as <strong>for</strong> any geared investment — and margin loans aredefinitely better suited to experienced investors who understandrisk and how to manage it.For those investors who understand their own goals and havea clear view of the market, a margin loan can be a valuableinvestment product — especially when <strong>you</strong> have access to acomprehensive suite of risk management tools, like CommSecSMART risk management.CommSec SMART risk managementAt CommSec, we understand that making the most of <strong><strong>you</strong>r</strong>investments also means managing risk. CommSec SMART riskmanagement is a consolidated suite of tools <strong>for</strong> investors with amargin loan, making it easier <strong>for</strong> <strong>you</strong> to manage <strong><strong>you</strong>r</strong> margin loan.Some of its great features include:››Risk calculator to help assess <strong><strong>you</strong>r</strong> risk be<strong>for</strong>e <strong>you</strong> make aninvestment. You can place a simulated trade to see howvarious transactions might affect <strong><strong>you</strong>r</strong> loan portfolio – thendecide whether <strong>you</strong> want to place a trade.››Expert market commentary, including insights intohow one investor maintained a geared strategy in recentvolatile markets.››Research papers with analysis of market movements,historical perspectives and the strategic impact <strong>for</strong> investors.››Case studies showing how margin lending can work <strong>for</strong>different investors with different goals.››Alerts be<strong>for</strong>e <strong>you</strong> go into margin call.››Portfolio LVR, offering increased Loan to Value Ratios (LVRs)<strong>for</strong> diversified portfolios.“One tool that investorsmay be considering toboost their purchasingand investment poweris a margin loan. As manyinvestors know, marginloans can be powerful”wealth creation tools.More about Portfolio LVRA key to managing risk and maximising returns is diversification.With Portfolio LVR, LVRs are adjusted according to the level ofdiversification of each portfolio. Investors who hold a diversifiedportfolio of 5 or more stocks are rewarded with increased LVRs <strong>for</strong>approved equities within those portfolios. Portfolio LVR also offersthose portfolios access to LVRs on stocks that don’t normallyqualify – we call these bonus stocks.More about CommSec Margin LendingWhen <strong>you</strong> take out a margin loan with CommSec, <strong>you</strong>’re notjust with one of Australia’s largest and most experienced marginlenders – <strong>you</strong>’ll also enjoy excellent value, confirmed by ourCANSTAR CANNEX 5-Star rating <strong>for</strong> Margin Lending.To find out more about CommSec Margin Lending, visit ourdedicated website at commsec.info/marginloan and check outthe great range of features.How to applyTo apply, go to commsec.info/marginloan to download theCommSec Margin Loan brochure and the application <strong>for</strong>m, or if<strong>you</strong> prefer, <strong>you</strong> can call us on 13 17 09 (8am to 8pm, Sydneytime, Monday to Friday).Important In<strong>for</strong>mation: CommSec Margin Lending facilities are provided by the Commonwealth Bank of Australia ABN 48 123 123 124 AFSL 234945 and administered byits wholly owned but non-guaranteed subsidiary Commonwealth Securities Limited ABN 60 067 254 399 AFSL 238814 (CommSec), a Participant of the ASX Group. Thisin<strong>for</strong>mation has been prepared without taking account of the objectives, needs, financial and taxation situation of any particular individual. For this reason any individual should,be<strong>for</strong>e acting on the in<strong>for</strong>mation, consider the appropriateness of it having regard to their own objectives, needs, financial and taxation situation and, if necessary, seekappropriate independent financial and taxation advice. Please be aware that a CommSec Margin Loan exposes <strong>you</strong> to unfavourable movements in the value of shares and unitsin managed funds, and possibly to margin calls. Please be aware that <strong>you</strong> are personally liable <strong>for</strong> any shortfall that occurs should <strong><strong>you</strong>r</strong> entire portfolio have to be sold to answera margin call where there have been falls in the market value of <strong><strong>you</strong>r</strong> investments. Only investors who fully understand the risks associated with gearing into investments shouldapply. All applications <strong>for</strong> a Margin Loan are subject to the Commonwealth Bank’s credit approval process. Fees and charges apply.page 6
Goodper<strong>for</strong>mancedrives strong demandHistory attests to economic downturns inspiring innovativeand creative business ideas. And it’s no different to theimpact that the Global Financial Crisishas had on the investment management profession.“In fact,” says Hersh Gandhi, Head of Product Development<strong>for</strong> Man Investments Australia, “the economic downturn lastyear demonstrated the ability of managed futures to providediversification to a traditional investment portfolio.”Man Group is one of the largest providers of alternativeinvestments with $US43 billion † funds under management.In Australia, its first fund was launched in 1997; the companyis launching its third structured product this year, seeminglyin defiance of economic conditions.“We’ve seen demand as strong as ever <strong>for</strong> our productsand we attribute that to the capital guarantee as well as ourproducts’ per<strong>for</strong>mance over the medium to long term,” saysGandhi.This per<strong>for</strong>mance is due mainly to the company’sinvestment strategy. “Most of our funds have a heavyallocation to managed futures. Managed futures hashistorically tended to be a strategy that per<strong>for</strong>ms well whentraditional assets – such as stocks and bonds – haven’t.And we saw history repeat itself yet again in 2008.”Managed futures survive well in tough economic climatesbecause of their capacity to take long or short positionsin a range of markets. “Managed futures are not solelyreliant on stock markets or bond markets increasing invalue,” says Gandhi.“Last year, <strong>for</strong> example, managed futures managers mayhave sold futures contracts on stock indices or taken longpositions in commodity-based futures contracts, and they’rethe sort of investments that typically per<strong>for</strong>m well whentraditional assets are struggling.”A flexible investment strategy responds fasterAs managed futures managers trade largely on regulatedexchanges, there is a high degree of inherent liquidity in thestrategy. “This allows futures managers to quickly adjusttheir positions if they have taken an unprofitable position,”says Gandhi. “So there’s more flexibility in investment styleas well.”Man Group owns the world’s largest managed futuresmanager, AHL, which has over US$20 billion undermanagement (as at 31 March 2009).“The GFC has rein<strong>for</strong>ced the appeal of our capitalguaranteed investments to our clients,” says Gandhi.“In addition, these products may diversify traditional assetslike stocks, bonds and property to include over 170 marketssuch as agriculturals, bonds, metals, and currencies.”Some of the more obscure markets on the list include theTurkish Lira, copper, silver, live cattle and orange juice.“We’ve found that investors today want something thatgives them managed futures exposure in this environmentplus a capital guarantee,” says Gandhi.Next stepsFind out more about the latest offeringsfrom Man Investments Australia:›› Man OM-IP 3AHL – a managedfutures investment that comes witha capital guarantee.›› Man AHL Alpha (AUD) – an open endedmanaged futures investment withweekly liquidity.page 7
Man OM-IP 3AHL –Global diversification with a capital guarantee +Investment HighlightsMan AHL Alpha (AUD) –Open ended Global diversificationInvestment HighlightsDiversification›› Access over 170 international markets,with access to the AHL Diversified Program,an investment strategy with over 18 yearsof history and a compound annual returnof 16.0% since inception^.›› Low correlation with the per<strong>for</strong>mance ofstocks, property and bondsDiversificationDistributions››››››Access over 170 international markets,with access to the AHL Alpha ProgramLow correlation with the per<strong>for</strong>manceof stocks, property and bonds.Annually as at 30 June (if a distributionis declared)SecurityPer<strong>for</strong>manceProvenmanagement›› Provides the security of a Capital Guaranteeand a Rising Guarantee+›› Aims to generate medium to long termcapital growth* in both rising and fallingmarkets with the security of a capitalguarantee›› Your investment will be managed byMan Investments Limited, drawingon the experience and global reachof the Man Group.Other features ›› Minimum investment: $5,000.›› Offer opened: 21 September 2009.›› Offer closes: 20 November 2009.›› Investment term: 10 years.›› Maturity date: 31 December 2019.Per<strong>for</strong>manceProvenmanagement›› The investment objective of the fund isto generate medium to long term capitalgrowth** in both rising and falling markets.›› Your investment will be managed byMan Investments, drawing onthe experience and global reach ofthe Man Group.Other features ›› Minimum investment: $25,000.›› Offer – open ended.›› Commencement date – 1 September 2009.›› Investment term: open ended.To find out moreFor more in<strong>for</strong>mation, or to obtain a Prospectus or ProductDisclosure Statement, visit www.commsec.info/OMIP, or emaildirectfunds@commsec.com.au or call a Funds specialiston 13 15 20, 8am – 5pm Monday to Friday (Sydney time).† Funds under management as at 30 June 2009.* The aim to generate medium to long term capital growth is based on the past per<strong>for</strong>mance of the AHL Diversified Program (see Section 2 of the Prospectus).^ Past per<strong>for</strong>mance is not a reliable indicator of future per<strong>for</strong>mance.+ Subject to the terms of the Westpac Guarantee as described in Section 5 and set out in Appendix A of the Prospectus.** The investment objective is based on the past per<strong>for</strong>mance of AHL Alpha plc, Man Investments’ longest running fund using the AHL Alpha Program, since its inception inOctober 1995 (see Sections 4, 5 and 6 of the PDS).Important In<strong>for</strong>mation: Commonwealth Securities Limited ABN 60 067 254 399 AFSL 238814 (CommSec) is a wholly owned but non-guaranteed subsidiary of CommonwealthBank of Australia ABN 48123123124 AFSL 234945 and a Participant of the ASX Group and the Sydney Futures Exchange. For Man OM-IP 3AHL CommSec will earn a sales feeof up to 4% on successful applications lodged by us of which 80% will be rebated to <strong>you</strong> and a trailing commission of 0.50% commencing in the second year of the investment.Terms capitalised and used in this article have the same meaning as in the Prospectus. This in<strong>for</strong>mation has been prepared without taking into account <strong><strong>you</strong>r</strong> objectives, financialsituation and needs. Because of that <strong>you</strong> should consider the appropriateness of the product having regard to <strong><strong>you</strong>r</strong> objectives, financial situation and needs, and seek appropriateadvice. The offer to invest is made in the prospectus issued by Man OM-IP 3AHL Limited dated 19 August 2009 (the Prospectus) and <strong>for</strong> Man AHL Alpha (AUD) the ProductDisclosure statement dated 20 August 2009. Applications to invest can only be made on the application <strong>for</strong>m attached to the prospectus and PDS. CommSec, a distributor of theprospectus and PDS, does not guarantee the per<strong>for</strong>mance of, or capital invested in Man OM-IP 3AHL or Man AHL Alpha (AUD. Commonwealth Securities Limited ABN 60 067254 399 AFSL 238814 (CommSec) is a wholly owned but non-guaranteed subsidiary of Commonwealth Bank of Australia ABN 48123123124 AFSL 234945 and a Participant ofthe ASX Group and the Sydney Futures Exchange. For Man OM-IP 3AHL CommSec will earn a sales fee of up to 4% on successful applications lodged by us of which 80% willbe rebated to <strong>you</strong> and a trailing commission of 0.50% commencing in the second year of the investment. Terms capitalised and used in this article have the same meaning as inthe Prospectus. For Man AHL Alpha (AUD) CommSec will receive an annual listing fee from Man Investments Australia <strong>for</strong> distribution of the Product Disclosure statement dated20 August 2009. This in<strong>for</strong>mation has been prepared without taking into account <strong><strong>you</strong>r</strong> objectives, financial situation and needs. Because of that <strong>you</strong> should consider theappropriateness of the product having regard to <strong><strong>you</strong>r</strong> objectives, financial situation and needs, and seek appropriate advice.Man OM-IP 3AHLThe Prospectus has been lodged with the Australian Securities & Investments Commission. Offers of Shares will be made in the Prospectus issued by Man OM-IP 3AHL Limiteddated 19 August 2009. Investors wishing to acquire Shares will need to complete the Application Form attached to the Prospectus. Please also refer to the Identification Requirementsdocument. Man OM-IP 3AHL Limited is a new company with no actual trading history. US Persons are not eligible to subscribe <strong>for</strong> shares pursuant to the Prospectus. Termscapitalised and used in this article have the same meaning as in the Prospectus. The Shares are not deposits or other liabilities of Westpac or its subsidiaries and neither Westpac,its subsidiaries, the Man Group nor the Directors guarantee the per<strong>for</strong>mance of the Company. Neither the Company nor the Man Group is a member of the Westpac group. Investmentin the Shares is subject to investment risk, including possible delays in payment and, except as provided in the Westpac Guarantee, loss of income and principal invested. Westpacdoes not in any way stand behind the capital value or per<strong>for</strong>mance of the Shares or the investments made by the Company, except as provided in the Westpac Guarantee.Man AHL Alpha (AUD)Investment in Man AHL Alpha (AUD) (the ‘Fund’) is offered by Man Investments Australia ABN 47 002 747 480 AFSL 240581 (‘MIA’). MIA is the Responsible Entity and issuer ofUnits in the Fund. Offers of Units will be made in the PDS issued by MIA dated 20 August 2009. Investors wishing to acquire Units will need to complete the Application Formattached to the PDS. Please also refer to the Identification Requirements document. US Persons are not eligible to subscribe <strong>for</strong> Units pursuant to the PDS. Terms capitalised andused in this article have the same meaning as in the PDS.page 8
Getting activeAs the effects of the global financial crisis continue to be felt, the debate about active versuspassive management has once more come to the <strong>for</strong>e, with investors questioning whetheractive fund managers can add value in the current conditions.Active versus passive investingPassive investing is based on the principle that markets are efficientand cannot be exploited. There<strong>for</strong>e, passive fund managers aim tomatch the per<strong>for</strong>mance of an index and do not make any active stockselection but simply invest in stocks that comprise an index itself.On the other hand, the main premise of active management is thatpricing anomalies exist in the market and that investors can exploit,or take advantage of this. An active fund manager makes activeinvestment decisions based on the belief they have the potential tooutper<strong>for</strong>m a benchmark or index over the long term. They aim todeliver returns that are in excess of their benchmark (after fees).For example, an Australian share index fund might aim to match theper<strong>for</strong>mance of the S&P/ASX 200 Index, whereas an activelymanaged Australian share fund would aim to outper<strong>for</strong>m that index.Do active fund managers outper<strong>for</strong>mover the long term?To examine whether this is true in Australia, Perpetual analysed howthe average active Australian share fund (AAASF) per<strong>for</strong>med afterfees against the index.Using data from the Mercer Consulting Survey of Retail Investmentfunds (after fees) <strong>for</strong> Australian funds, they found that the averageactive Australian retail share fund 1 returned 9.0% pa (after fees)between January 1994 and April 2009 relative to 7.3% pa <strong>for</strong> theindex after fees. Since this initial date, an investment of $100,000with the AAASF would be worth just under $373,000 (after fees),which is above the index return of just over $292,000 (after fees).Although this result suggests that active managers outper<strong>for</strong>m theindex over the long term, this data only represents the ‘average’active manager. So, how can an investor tell a weak, underper<strong>for</strong>mingactive manager apart from a strong and successful active manager?Evaluating risk and opportunityLong-term, consistent outper<strong>for</strong>mance is probably the best indicatorof a strong active manager, however research and skill also playimportant roles. In other words, having a disciplined investmentprocess and a talented and stable investment team means an activefund manager has the best possible chance to accurately evaluaterisk and investment opportunity – and add value to a fund overthe long term.Perpetual’s investmentphilosophyPerpetual’s active and disciplined investment approach focuseson quality companies at attractive prices. This aims to provideinvestors with consistent returns and dividends over the longterm, and peace of mind that these companies will surviveeven in the most difficult of times.Perpetual’s investment philosophy is based on the premise that:›› opportunities <strong>for</strong> adding value exist through stock selection›› investing in quality companies minimises downside risk›› outper<strong>for</strong>mance can be achieved through the selectionof stocks trading at a discount to their inherent value›› these can be identified through thorough in-housefundamental research.Perpetual’s actively managedAustralian share opportunitiesPerpetual’s range of Australian share funds are actively managedby one of Australia’s largest, most stable, talented and experiencedinvestment teams. In fact, Perpetual was recently namedAFR Smart Investor Blue Ribbon Awards 2009 Fund Managerof the Year. Their funds include:Perpetual Industrial Share FundOne of Australia’s longest running funds offering consistent returnswith a history of reliable, regular income <strong>for</strong> investors.Perpetual Concentrated Equity FundA concentrated portfolio of hand-picked stocks with the opportunity<strong>for</strong> higher returns, <strong>for</strong> investors with a more aggressive risk profile.To find out moreFor more in<strong>for</strong>mation about Perpetual’s actively managed investmentopportunities visit www.funds.info/perpetual, call13 15 20 (8am to 5pm, Sydney time, Monday to Friday),or refer to the enclosed insert.Important In<strong>for</strong>mation: 1 This article uses data contained in the Mercer Investment Consulting Survey of Retail Investment Funds (after fees) <strong>for</strong> Australian shares after fees.From this list, index managers and multi-manager funds are removed (to address the impact of endogeneity in the latter case) and all remaining funds (whether they exist todayor they have failed or closed) are included in the monthly analysis to remove the impact of ‘survivorship’ bias. The number of funds contained in the sample group has grownfrom two in December 1986 to 119 in April 2009. The monthly average growth rate <strong>for</strong> all available active managers is used to compile an index of active Australian share fundsrebased to 100 in January 1994. For this article’s purpose analysis begins in January 1994 (when there were 12 fund managers with per<strong>for</strong>mance statistics in the survey). Theresults detailed were not materially impacted by the starting date as analysis three years earlier or three years later produced similar results. Accordingly, the results don’t seemto be biased by time dependency. No company in the Perpetual Group (Perpetual Limited ABN 86 000 431 827 and its subsidiaries) guarantees the per<strong>for</strong>mance of any fundor the return of an investor’s capital. No allowance has been made to taxation. Past per<strong>for</strong>mance is not indicative of future per<strong>for</strong>mance. Units in the Perpetual ConcentratedEquity Fund and Perpetual Industrial Share Fund are issued by Perpetual Investment Management Limited (PIML) ABN 18 000 866 535, AFSL 234426 and PerpetualSuperannuation Limited ABN 84 008 416 831, AFSL 225246, RSE L0003315. Application <strong>for</strong> units can only be made on the application <strong>for</strong>m in the relevant product disclosurestatement (PDS). This in<strong>for</strong>mation has been prepared without taking into account <strong><strong>you</strong>r</strong> objectives, financial situation or needs. There<strong>for</strong>e, in deciding whether to acquire orcontinue to hold an investment in the funds, <strong>you</strong> should consider the PDS and assess, with or without <strong><strong>you</strong>r</strong> financial or taxation adviser, whether the product fits <strong><strong>you</strong>r</strong> objectives,financial situation or needs. A PDS may be obtained by contacting Commonwealth Securities Limited ABN 60 067 254 399 AFSL 238814 (‘CommSec‘) on 13 15 20 or byemail at directfunds@commsec.com.au. CommSec, a distributor of the PDS, does not guarantee the per<strong>for</strong>mance of, or capital invested in the funds. CommSec is a whollyowned but non-guaranteed subsidiary of Commonwealth Bank of Australia ABN 48 123 123 124 AFSL 234945 and a participant of the ASX Group and the Sydney FuturesExchange. CommSec will earn a trailing commission of 0.60% inclusive of GST while the investment remains in existence.page 9
Index fundsa new and savvy approachDoes a company’s share pricerepresent fair value?If <strong>you</strong>’re in the ‘no’ camp, then <strong>you</strong> agree that markets areinefficient. Those on the other side of the equation will argue thatshare prices are based on all known in<strong>for</strong>mation about acompany and there<strong>for</strong>e the market is rational, or efficient.Your point of view matters when it comes to index funds, whichtypically aim to match the per<strong>for</strong>mance of a particular index.These funds hold the same assets in the same proportion as agiven index. For example, if BHP Billiton accounts <strong>for</strong> around14% of the S&P/ASX 200 Index, then the index fund will hold thesame percentage.Overweight and undervaluedThis is known as a market capitalisation weight approach (or‘cap weighted’) in which the higher a company’s share price, thegreater its weight in the fund. The downside is that if the pricedoesn’t represent fair value <strong>you</strong>’ll potentially be exposed tooverweight, over-valued companies, and underweight,undervalued companies.That causes a drag on <strong><strong>you</strong>r</strong> portfolio, says Realindex InvestmentsCEO Andrew Francis. And it’s possibly the reason that traditionalindex funds haven’t been more popular, he says, despite thelower costs associated with them.“The idea that markets are inefficient is an intuitive concept <strong>for</strong>many people,” says Francis.A new type of index, developed by US firm Research Affiliates,calculates the “economic footprint” of a company. RealindexInvestments, an alliance between Colonial First State Investmentsand Research Affiliates was <strong>for</strong>med to bring the ResearchAffiliates enhanced Fundamental Index TM (RAFI®) to theAustralian market.Cutting per<strong>for</strong>mance drag“RealindexInvestmentsavailable throughCFS FirstChoice.”“We also look at the quality of earnings and debt ratio. By doingthat, what <strong>you</strong>’re doing is removing the per<strong>for</strong>mance drag <strong>you</strong>get from weighting the portfolio according to price,” Francis says.There are four fund options managed by Realindex throughColonial First State FirstChoice: an Australian shares fund, anAustralian small companies fund, a Global Shares Fund and aGlobal Shares Fund that’s hedged.Next stepsRealindex is available through Colonial First State FirstChoice›› Investment›› Superannuation›› PensionTo find out moreFor more in<strong>for</strong>mation, or to obtain a Product DisclosureStatement, visit www.funds.commsec.com.au, or emaildirectfunds@commsec.com.au or call a Funds specialiston 13 15 20, 8am – 5pm Monday to Friday (Sydney time).“We build a portfolio by weighting companies according to theireconomic footprint, cash flow, sales, dividends and book value,using the past five years of data,” says Francis.Important In<strong>for</strong>mation: Commonwealth Securities Limited ABN 60 067 254 399, AFSL 238814 is a wholly owned but non-guaranteed subsidiary of Commonwealth Bank ofAustralia ABN 48 123 123 124 AFSL 234945 and a participant of the ASX Group and the Sydney Futures Exchange. The in<strong>for</strong>mation contained in this newsletter has beenprepared without taking account of the objectives, needs, financial and taxation situation of any particular individual. For this reason any individual should, be<strong>for</strong>e acting on thein<strong>for</strong>mation, consider the appropriateness of it having regard to <strong><strong>you</strong>r</strong> objectives, needs, financial and taxation situation and if necessary, seek appropriate independent financialand taxation advice. If the advice relates to a particular financial product, <strong>you</strong> should obtain a Product Disclosure Statement (PDS) or prospectus relating to the product andconsider it be<strong>for</strong>e making any decision about whether to acquire the product. PDS’s are available from Commonwealth Securities at funds.commsec.com.au or by contacting13 15 20. Commonwealth Securities does not guarantee the per<strong>for</strong>mance of any fund or trust and makes no specific recommendation on funds or trusts included in anyprospectus or offer document on its web site. Past per<strong>for</strong>mance is not indicative of future per<strong>for</strong>mance.page 11
What’s new at CommSecDirect Managed Funds?Opus CapitalLimited Investment OpportunityOpus Income & Capital Fund No. 21 is currently equityraising. Opus 21 is a ‘core’ property Fund, designed to delivermonthly income and capital growth over medium to long termto Unitholders.Investors participating in this limited offer will be able to takeadvantage of:››entry at 57% discount to Net Tangible Assets (NTA) of theFund based on the Rights <strong>Is</strong>sue Offer Price of $0.35 per unit;››9% p.a.^ income yield distributed monthly;››100% tax advantaged income; and››an investment in a diversified commercial property portfolio.Purpose of the OfferThe Manager, on behalf of the Fund, is seeking to raise$42 million equating to an additional 120 million new unitsin the Fund. The offer is subject to a minimum raising of$15 million. The equity raised will assist the Fund to pay downdebt reducing the overall Fund Loan to valuation Ratio (LVR).It will also strengthen the Fund’s balance sheet and cash flowposition, provide a solid plat<strong>for</strong>m <strong>for</strong> the future growth of theFund, provide capital <strong>for</strong> leasing initiatives within the portfolioand meet required building maintenance. This Offer <strong>for</strong>ms partof the Manager’s capital management strategy <strong>for</strong> the Fund.Offer OverviewOffer Opus Income & Capital Fund No. 21<strong>Is</strong>sue PriceMinimum InvestmentAmount Sought$0.35 per unit.no minimumOffer Open Date 26th August 2009Offer Close Date 30th October 2009YieldValue of assets inthe Fund at 31/12/08Value of assets inthe Fund at 31/12/08$42 million - Minimum subscription $15 million9.0% p.a.^ based on Rights <strong>Is</strong>sue Offer Price$294,100,000100% tax advantaged - paid monthlyMPGMPG Enterprise Property TrustTrust ObjectiveThe objective of the Trust is to provide Investorswith a combination of attractive tax advantagedincome and capital returns, predominatelythrough co-investment with the McMullin Group.This Trust could be suitable <strong>for</strong> investors seekingregular and stable income with tax benefits.Features & Benefits of the Trust››A diversified open ended commercial propertyinvestment›› Attractive regular returns – Forecast initial yieldof 8.05% pa to be paid quarterly›› Allowances allow a high proportion of thisincome to be tax advantaged›› Experienced manager with a proven trackrecord – Our experienced team handle alltenancy issues as well as manage the Trust›› Distribution Reinvestment Plan›› Access to commercial property – that maybe out of reach of the ordinary investor›› Investors seeking access to a well diversifiedand managed Direct Property PortfolioTo find out moreFor more in<strong>for</strong>mation, or to obtain a ProductDisclosure Statement, visit www.funds.commsec.com.au, or email directfunds@commsec.com.auor call a Funds specialist on 13 15 20, 8am – 5pmMonday to Friday (Sydney time).page 12
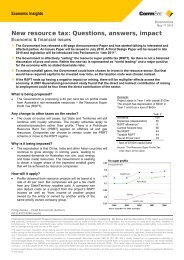
654The rise and rise of ChinaMind the gapDifference in economic growth rates betweenDeveloping/Emerging and Advanced economiesPercentage points(e)Changing of the guard28Share of gobal GDP on PPP basis, percent26Economic Insights with Craig James, CommSec’s Chief Economist24United States1.03220.0220-1.0G7 nations118BRIC nations-2.00 There is still a remarkable perception 16 that China’s solid expansion is a short-term phenomenon.-3.0*Brazil, Russia, India, China-114-4.0The International Monetary Fund (IMF) predicts that China will overtake1980 1985 1990 1995 2000 20051992 1995 1998 2001 2004 2007 2010 20131995 the 1998 United 2001 2004States 2007 2010 as the 2013Source: IMF, CommSecSource: IMF, CommSecSource: IMF, CommSecworld’s largest economy within eight years.10-11980 1985 1990 1995 2000 2005Source: IMF, CommSecGrowth drivers4.0Contribution to world growth, percentage points3.0BRICs*2.0)oreaGrowth Changing drivers of the guard4.0 28Contribution Share of to gobal world GDP growth, on PPP percentage basis, percent points3.0 26BRICs*United States2.0241.0220.020-1.018G7 nations-2.0BRIC nations16-3.0*Brazil, Russia, India, China-4.0 141995 199219981995 2001 1998 2004 2001 2004 2007 2007 2010 201020132013Source: Source: IMF, CommSec IMF, CommSecTortoise China and prepares hare to overtake16 30Share of Share global of GDP global on GDP PPP on basis, PPP percent basis, percent14 25United States122010China15642The Reserve Bank and Federal Treasury recently emphasised thechallenges and opportunities the ascent of China presents.Reserve Bank Governor Glenn Stevens said in late July: “Overthe medium term, the emergence of China (and other countriessuch as India) will continue and will offer opportunities <strong>for</strong>Australia. Plenty of observers, the RBA among them, have beensaying this <strong>for</strong> years.”Australian investors could spend less time focusing on growthrates in the US and Europe and more time focusing ondeveloping world economies, especially China. Developingnations have replaced the major G7 nations as drivers of global5ChinaIndia0 01980 1992 198519951990 1998 1995 2001 2000 2004 2007 2005 2010 20102013 2016Source: Source: IMF, CommSec IMF, CommSecChina’s growth pathSimilar paths18$7,000China, smoothed annual economic growth expansion has been about 1.5 GDP percent capita, US$, <strong>for</strong> 1990 advanced prices economies16$6,000and 5.9 percent <strong>for</strong> developing/emerging economies.Japan141983-95, 10.8%1951–12average annual$5,000The IMF says the BRIC nations’ share of the world Taiwan economy1965–10$4,000overtook the US’s share in 2007. The IMF projects that the BRICSouth Korea81969–nations 1996-08, will remain 9.6% the principal $3,000 driver of global growth <strong>for</strong> at6average annualleast the next five years.$2,0004China Singapore1995– 1959–2The world economy is tipped $1,000 to contract by about 1.3 percent in1980 1987 1994 2001 20081 4 7 10 13Source: IMF, CommSec 2009, comprised of the BRIC Source: nations’ Groningen GDC, expansion CommSec Years of 2.5Similar China’s paths growth pathChina prepares to overtakeTortoise and hare$7,000183016economic GDP China, per smoothed capita, growth, US$, annual 1990 economic prices and growth industrialisation in China is still Share in of its global GDP on PPP basis, percentShare of global GDP on PPP basis, percentChina dominates BRIC1614$6,000relative infancy.2514JapanChina United stands States out amid the four BRIC nations. The IMF has1983-95, 1951– 10.8%12$5,00012average annual20Canada, Australia and Russia (the CAR nations) will be thecalculated that China accounts <strong>for</strong> 11.4 percent of world GDPTaiwan10China$4,000101965–principal beneficiaries as China and India continue 15 to motoron a PPP basis, followed by India with 4.8 percent, Russia’sSouth Korea68along the road of industrialisation.1969–$3,0001996-08, While 9.6% rising demand <strong>for</strong>3.3 percent and Brazil’s 2.8 percent.106average annual4Chinacommodities will push prices higher, benefiting mining andIndia$2,000 45In 1999, the US economy 2 peaked at 23.8 percent of world GDPmining services, China Singapore the Australian dollar is likely to rise, putting21995– 1959–on a PPP basis. It has since eased to 20.5 percent, and the IMF$1,00000downward 1980 1 4 pressure 1987 7 on 1994manufacturing.10 2001 13 20081992 1995 1998 2001 2004 2007 2010 2013 20161980 1985 1990 1995 2000 2005 2010Source: Source: Groningen IMF, CommSec GDC, CommSec Yearsprojects that it will ease further,Source: IMF, CommSecSource: IMF, to CommSec about 18 percent, by 2017.Developing world takes chargeDeveloping economies have made a remarkable ascent in thepast 10 to 15 years. In 1992 Brazil, Russia, India and China (theBRIC nations) accounted <strong>for</strong> 14.4 percent of world GDP on apurchasing power parity (PPP) basis, compared with 22.7percent <strong>for</strong> the US. The US increased its share of global GDPthrough to 1999, but its economic dominance has gone downhill10over the past decade.Advanced and developing/emerging economies both grew byabout 3.5 percent in 1999. But since 2001, the average annualpercentage points offset by a 3.1 percentage point drag from themajor G7 nations.The decline in US importance over the past decade hascoincided with the ascent of China. In 1999, China accountedChina and Japan dominateJapan’s growth path8015Trade with Australia (exports and imports<strong>for</strong>of goodsabout 7 percent of world Japan, GDP. smoothed By annual 2017 economic it is growth expected toand services), rolling annual total, $ billion1270account <strong>for</strong> almost 18 percent, slightly ahead of the US.1952-73, 9.2% average annual960In the US, GDP per capita is almost US$47,000, comparedJapan650with about US$3,300 in China. 1974-91, But the 3.7% figure is growing at aboutaverage annual3Mainland 8 percent China a year in China, and China’s population of over 1.33401992-08, 1.1%0billion dwarfs the US with just over 304 million. average annual However, China’s30-3United States slower-growing and ageing population will restrain the trend of20rising income levels over -6Jan-04 Jan-05 Jan-06 Jan-07 Jan-08 Jan-091954 time. 1961 1968 1975 1982 1989 1996 2003Source: ABS, CommSecSource: Groningen GDC, IMF, CommSecJapan’s China growth and path Japan dominate15 80Japan, Trade smoothed with Australia annual economic (exports and growth imports of goodsand services), rolling annual total, $ billion12 70China’s growth mix8070China’s slowing population1.8Annual population growth percent1.69630-3605040301974-91, 3.7%average annual1952-73, 9.2% average annualJapanMainland China1992-08, 1.1%average annualUnited States60504030ConsumptionGross Capital Formation1.41.21.00.80.6-6201954Jan-041961 Jan-05 1968 1975 Jan-06 1982 Jan-07 1989 1996 Jan-08 2003 Jan-09Source: Source: Groningen ABS, GDC, CommSec IMF, CommSec201970 1977 1984Source: FactSet, CommSec1991199820050.41980 1985 1990 1995Source: Groningen GDC, IMF, CommSec20002005China’s China’s slowing growth population mix1.8 80Annual population growth percent1.6 701.460The importance of China20Share of total trade with Australia, percent181416United StatesNew era <strong>for</strong> Aussie?1.00US dollars per Australian dollar0.900.80page 13
n-09an-091.81.5 1.81.2 1.50.9 1.20.6 0.90.3 0.60 0.3-0.3 0-0.310and services), rolling annual total, $ billion1983-95, 10.8%China126070Japan701.0 5012average annual1952-73, 9.2% average annual695060JapanMainland China600.01040Consumption46Japan Mainland China-1.0840501974-91, 3.7%501996-08, 9.6%India30 average annualG7 nations23-2.06average annualMainland ChinaUnited States3040400-3.0201992-08, 1.1%How far behind is India?041980 1985 1990 United States 1995 2000 2005 2010Jan-04 Jan-05 Jan-06 average annual Jan-07 Jan-08 Jan-09*Brazil, Russia, India, China203030Source: IMF, CommSec-4.0 Source: ABS, CommSec2In the early 1980s, China and India had a similar -3 share of world GDP. But the ChineseJan-04 Jan-05 Jan-06 United States Jan-07 Jan-08 Jan-091995 1998 2001 2004 2007 2010 20131980 Gross 1987Capital Formation 1994 2001 2008Source: ABS, CommSecSource: IMF, CommSecSource: IMF, CommSececonomy 20 pushed past India from the 1990s, driven -6 by <strong>for</strong>eign investment, increased trade20Jan-04 Jan-05 Jan-06 Jan-07 Jan-08 Jan-091954 1961 1968 1975 1982 1989 1996 20031970 1977 1984 1991 1998 2005Source: Groningen GDC, IMF, CommSecSource: FactSet, CommSecand Source: infrastructure ABS, CommSec expansion.Japan’s growth pathChina’s growth mix1580The Japan,China’s IMF smoothedgrowth expects annualmix that economic by growth 2014, India will account Mind <strong>for</strong> the about gap Similar paths 6 percent of world outputChanging China of prepares the guard to overtake80126 $7,000307028compared Difference GDP per capita, US$, 1990 pricesShare of global GDP on PPP basis, percentChina’s in slowing economic population growth rates betweenMind Share The the of importance gapgobal GDP of on China PPP basis, percentChina’s growthwithmixChina’s share of almost 16 percent.1952-73, 9.2% average annual7080 95 1.8 Developing/Emerging and Advanced economies6$6,0002620Annual2560 population growth percent(e)Difference Share ofin intotaleconomic trade withgrowth Australia,rates betweenpercentJapan18Percentage pointsUnited States61.6Consumption1951–5Developing/Emerging United and Advanced StatesIn GDP per capita, China is closely tracking the economies4earlier, 15-year development paths of6070241974-91, 3.7%$5,000 501420(e)other Asian average nations annual Consumption such as Japan, Singapore, Taiwan31.4South Korea and Taiwan.Percentage pointsUnited States34221650601965–$4,000 401514Consumption1992-08, 1.1%South Korea01.23A key reason many average investors annual underestimate the 2 importance of the Chinese economy 1969– to20405012$3,000 3010Australia -3 is the speed of its rise to prominence. 1 1.0 Just over four years ago, China was in21810Gross Capital FormationChinaBRIC nations3040$2,0005-60.8 208third position behind Japan and the US in the 0rankings of Australia’s trading partners.116China1954 1961 Gross 1968Capital 1975 Formation 1982 1989 1996 20031970 1977 China 1984 Singapore 1991 1998 200561995– 1959–20 Now 30 Source: mainland Groningen GDC, China IMF, CommSec is solidly in top spot, even -1 0.6 when $1,000 Hong Source: FactSet, Kong CommSec is excluded.01401970 1977 Gross 1984 Capital Formation 1991 1998 20051 4 7 1041980 1985 1990 1995 2000 2005 131992199219951995199819982001200120042004200720072010201020132013 2016Source: FactSet, CommSec0.4 Source: Groningen GDC, CommSec Years2 Source: IMF, CommSec20Source: IMF, CommSec-1Source: IMF, CommSecChina 1970 accounts 1977 1984 <strong>for</strong> 17 1991 percent 1998 of Australia’s 2005 exports 1980 and 1985 imports, 1990 compared 1995 2000with20051980 Jan-89 1985 Jan-92Jan-95 1990 Jan-98 1995Jan-01 2000 Jan-04 2005Jan-07Source: FactSet, CommSecSource: Groningen GDC, IMF, CommSecSource: Source: ABS, CommSecMind the IMF, gap CommSec15.6China’spercentslowing population<strong>for</strong> Japan and 8.2 percent <strong>for</strong> the US. The importance of ChinaMind 6 the gap1.8206 Difference in economic growth rates betweenAnnual population growth percentShare of total trade with Australia, percentDifferenceThe importance of ChinaTortoise and hareChina economicand Japangrowthdominaterates between185Developing/Emerging and Advanced economiesGrowth drivers201.6165Developing/EmergingChina’s growth path80and Advanced economies(e)4.018Share of total trade with Australia, percentShare 14 of global GDP on PPP basis, percentTrade with Australia (exports and imports of goods (e)Contribution18New era <strong>for</strong> to world Aussie? growth, percentage pointsPercentage4 Growth China, Aussie smoothed dollarpointsdriversannual breaks economic away growthThe importance of Chinaand services), rolling annual total, $ billion14United StatesPercentage1.41.00 16500points203.04 4.0 161.007014 Share of total trade with Australia, percentUS dollars per Australian dollarBRICs*Contribution to world growth, percentage points18United States1432.0161.2123.0 14AUD/USD (right scale)0.9031983-95, 10.8%146012BRICs*141.02.0 12 2average annual4200.901.0United States161010China2Japan0.80120.0501.0 10 1140.868110ChinaMainland China12-1.00.7060.08 3400 400.8080.64CRB futures commodity1996-08, 9.6%G7 nations010China-2.0 460.60Average last 20 years US71c-1.06 index (left scale)average annualIndia-1300.4 82 2-1 19804United States1980 1985 1990 1995 2000 2005Jan-89 Jan-92 Jan-95 Jan-98 Jan-01 Jan-04 Jan-072601985 1990 1995 2000G7 2005nationsChina-3.0-2.040.701980 1985 1990 1995 2000 20056Source: IMF, CommSec2 Source: Groningen GDC, IMF, CommSec0.50 *Brazil, Russia, Source: India, ABS, China CommSecSource:020 IMF, CommSec-4.0-3.02Jan-89 4 Jan-92 Jan-95 Jan-98 Jan-01 Jan-04 Jan-0719951980 1998 1985 2001 1990 2004 1995 2007 2000 2010 2005 2010 20131980Jan-04Jan-05 1987 Jan-061994 Jan-07 Jan-08 2001 Jan-09 2008Source: ABS, CommSec0.40 Source: IMF, CommSec180*Brazil, Russia, India, ChinaSource: ABS, CommSec2Source: IMF, CommSec0.60-4.0Source: IMF, CommSecJan-89 Jan-92 Jan-95 Jan-98 Jan-01 Jan-04 Jan-07Jan-84 Jan-89 Jan-94 Jan-99 Jan-04 Jan-091995 01 Jan-081998 22 Apr-08 2001 11 Aug-08 2004 28 Nov-08 2007 202010Mar-09 09 2013Jul-09Source: ABS, CommSecSource: Reserve Bank, CommSecSource: Growth Source: IMF, drivers CommSecReuters, CommSecNew era <strong>for</strong> Aussie?Aussie dollar breaks awayGrowth 4.0 drivers1.00500 1.00 4.0 Contribution to world growth, percentage pointsUS dollars per Australian dollarAussie dollar breaks awayJapan’s growth path3.0 Contribution China’s to world growth growth, mix percentage pointsSimilar pathsChina prepares to overtake500 1.00 15AUD/USD (right scale)3.0 800.90$7,00030BRICs*Japan, smoothed annual economic growthPopulation GDP per capita,AUD/USD (right scale)420& growth US$, 1990 prices2.0 Share0.90Similar of globalpathsGDP on PPP basis, percent BRICs*Aussie dollar breaks away2.0500 1.00 15121.8$7,000700.80$6,00025 1.0 GDP per capita, US$, 1990 prices4200.901952-73, 9.2% average Japan annual1.0AUD/USD (right scale)United States12 91951–1.5$6,0000.0 600.70$5,000 3400.80 0.0 20Japan4200.909Consumption6CRB futures commodity Taiwan1.2-1.01951–3401974-91, index (left 3.7% scale) 1965– Japan, smoothed annual economic500.60Average last 20 years US71c-1.0$5,0000.80 $4,000average annual growth, percent (left scale)15G7 nationsCRB futures commodity6 3South Korea0.9-2.0TaiwanG7 nations0.70index (left scale)260-2.01965–3401969–0.80$4,000400.50$3,000 31992-08, 1.1%10 -3.0CRB futures commodity0South Korea2600.70average annual0.6 -3.0 *Brazil, Russia, India, China Chinaindex (left scale)1969–$3,000 -4.0*Brazil, 30 Russia, India, China0.40$2,000 0-31800.30.60-4.0 5 1995 1998 2001 2004 2007 2010 2013260Gross Capital FormationJan-84 Jan-89 Jan-94 Jan-99 Jan-04 Jan-09 0.7001 Jan-08 China 22 Japan, Apr-08Singaporepopulation 11 Aug-08 growth, 28 Nov-08 20 Mar-09 09 Jul-09 1995Source: 1998 IMF, CommSec 2001 2004 2007 2010 2013percent (left scale)180 Source: Reserve Bank, CommSec0.60 -3-6Source: 1995– Reuters, CommSec 1959–0$2,000 Source: 20IMF, CommSec$1,000001 Jan-08 22 Apr-08 11 Aug-08 28 Nov-08 20 Mar-09 09 Jul-091954 1 1961 41968 1975 7 1982 1989 10 1996 20031970 197719841991 1998 2005131992 1995 1998 China 2001 Singapore 2004 2007 2010 2013 2016Source: Reuters, CommSec-6GDC, IMF, CommSec-0.3Source: FactSet, CommSec 1995–1959–1800.60 Source: Groningen GDC, CommSec Years$1,000Source: IMF, CommSec01 Jan-08 22 Apr-08 11 Aug-08 28 Nov-08 20 Mar-09 09 Jul-091954 1961 1968 1975 1982 1989 1996 20031 4 7 10 13Source: Reuters, CommSecSource: Groningen GDC, IMF, CommSecSource: Similar Groningen paths GDC, CommSecYearsMind the Population gap & growthChanging of the guard$7,000 Similar paths6 15 1.8 28$7,000 GDP per capita, US$, 1990 pricesDifference in economic growth rates betweenShare of gobal GDP on PPP basis, percentGDPChina’s slowing populationThe per importance capita, US$, of 1990 China prices5Developing/Emerging and Advanced economiesTortoise and hare$6,000China and Japan dominate121.5 16 1.8 2620(e)Annual population growth percent$6,00080Share of total trade with Australia, percent JapanShare of global GDP on PPPPercentage pointsUnited basis, States percentTortoise 18Trade withand Australiahare(exports and imports of goodsJapan 1951–4 91.61.22416 $5,000and services), rolling annual total, $ billion14Japan, smoothed annual economic$5,000701951–Share 14of global GDP on PPP basis, Taiwan percentgrowth, percent (left scale)United States3 60.9 1.4 221416Taiwan 1965–12$4,000$4,000601965–South Korea142 31.20.62012South Korea101969–China$3,000Japan121969–50$3,0001 00.3 61.0 181010ChinaJapan, population growth,BRIC nationsMainland China0percent (left scale)40 $2,0000.88-3016$2,00046China Singapore China6China 1995– Singapore 1959–-1 -6-0.3 0.6 14India30 $1,0001995– 1959–2$1,000 41 4 7 10 1341980 1954 19851961 1990 1968 1975 1995 19822000 1989 2005 1996 20031992 1995 1998 2001 2004 2007 2010 20131 4 United 7StatesSource: Groningen GDC, CommSec Years 10 13Source: IMF, Source: CommSec Groningen GDC, IMF, CommSec0.4 Source: IMF, CommSec2India2Source: Groningen GDC, CommSec Years0201980 19801985 1985 1990 1990 1995 2000 1995 2005 2000 2010 2005Jan-04 Jan-89Jan-05Jan-92 Jan-06 Jan-95 Jan-98 Jan-07 Jan-01 Jan-08 Jan-04 Jan-09 Jan-07Source: Groningen GDC, IMF, CommSecSource: ABS, CommSecSource: IMF, CommSec0Source: ABS, CommSec1980 1985 1990 1995 20002005 2010Produced by Commonwealth Research based on in<strong>for</strong>mation available at the time of publishing. We believe that theSource: Tortoise IMF, and CommSechareGrowth driversChina’s growth pathTortoise 16 and hare4.0 in<strong>for</strong>mation in this report is correct and any opinions, conclusions 18or recommendations are reasonably held or made as 16 Share of global GDP on PPP basis, percentContributionat the timeto worldof itsgrowth,compilation,percentage pointsbut no warranty is made as to accuracy,China, smoothedNew era <strong>for</strong> reliabilityannualAussie? oreconomiccompleteness.growthTo the extentShare of global Aussie GDP dollar on breaks PPP basis, away percentJapan’s 143.01.00 16growth pathChina’s growth mix500 1.00permitted by law, neither Commonwealth Bank of Australia 15ABN 48 US 123 dollars 123 per Australian 124 nor dollar any of its subsidiaries accept14 80BRICs*Japan, smoothed annual economic growth2.0 liability to any person <strong>for</strong> loss or damage arising from the use of this 1412 Japan’s growth pathreport. The report has been prepared without takingAUD/USD (right scale)12 0.901983-95, 10.8%12 1570account of the objectives, financial situation or needs of any particular individual. For this reason, any individual should,1.012average annualJapan, smoothed annual economic growth101952-73, 9.2% average annual420China0.90be<strong>for</strong>e acting on the in<strong>for</strong>mation in this report, consider the 9appropriateness of the in<strong>for</strong>mation, having regard to the 10 12China0.800.01060individual’s objectives, financial situation and needs and, if necessary, seek appropriate professional advice. In the case61952-73, 9.2% average annual66 9Consumption-1.0 of certain securities Commonwealth Bank of Australia is or may 0.70 be 8 the 1974-91, only market 3.7% maker. This report is approved and3400.801996-08, 9.6%504distributed in Australia by Commonwealth G7 nations Securities Limited ABN 60 average 067 254 annual 399 a wholly owned but not guaranteedCRB futures commodity-2.03 6average annual4 6index (left scale)subsidiary of Commonwealth Bank of Australia. This report is approved 0.60 and Average distributed last 20 years in US71c1974-91, 3.7%Indiathe UK by Commonwealth402average annualIndia-3.041992-08, 1.1%3Bank of Australia incorporated in Australia with limited liability. 0 Registered in England No. BR250 and regulated in the2average annual2600.70*Brazil, Russia, India, ChinaUK by the Financial Services Authority (FSA). This report does 0.500-4.0not 2 purport to be a complete statement or summary.301992-08, 1.1%-30 01980 1985 1990 1995 2000 2005 20101995For the1998purpose2001of the2004FSA rules,2007this2010report2013and related services1980are not intended1987<strong>for</strong> private1994customers 2001and are not2008 1980 1985 1990 Gross Capital 1995Formationaverage 2000annualSource: IMF, CommSec2005 2010Source: IMF, CommSec0.40Source: IMF, CommSecSource: 1800.60available to them. Commonwealth Bank of Australia and its subsidiaries have effected or may effect transactions <strong>for</strong>-3IMF, CommSec-6201954Jan-841961 1968 Jan-891975 Jan-94 1982 1989 Jan-99 1996 2003 Jan-04 Jan-091970 01 Jan-08 1977 22 Apr-08198411 Aug-08 1991 28 Nov-08 199820 Mar-09 200509 Jul-09their own account in any investments or related investments referred Source: to in Reserve this report.Source: Groningen GDC, IMF, Bank, CommSec CommSecSource: Reuters, CommSec-6Source: FactSet, CommSec1954 1961 1968 1975 1982 19891996 2003Source: Japan’s Groningen growth GDC, pathIMF, CommSecSimilar pathsChina prepares to overtakeJapan’s 15 growth path$7,0003015growthJapan, smoothed annual economicGDP per capita, US$, 1990 pricesShare of global GDP on PPP basis, percentChina’s Population slowing & population growthJapan, smoothed annual economic growth12 The importance of China$6,0001.8 15251.8 12 20page 14
Top Rated Unit Trustsas rated by morningstarFund NAME Rating Size($M)defensive fundsAustralian BondsMER(%pa)ICR(%pa)Total Return (%pa)1 year 3 year 5 yearAUI-Vianova Strategic Fixed Int Trust-Retail ★★★★★ 17.82 NAv 1.20 7.86 6.51 NAvMortgagesFiducian Structured Income Fund ★★★★ 57.52 NAv 1.08 7.27 8.82 NAvBT Challenger Howard Mortgage ★★★ 18.74 NAv 1.58 5.33 6.10 NAvGlobal BondBT Investment - UBS Diversified Fixed Income ★★★ 28.12 NAv 1.69 9.96 4.37 4.39CFS FC Inv - FirstChoice Fixed Interest ★★★ 44.95 NAv 1.51 4.92 4.23 4.37GROWTH fundsAustralian EquityBT Investment - UBS Australian Share ★★★★ 24.15 NAv 1.95 2.38 2.37 9.86Perpetual WFI Perpetual's Industrial Share ★★★ 1604.93 NAv 1.95 - 1.46 - 1.53 5.01CFS FC Inv-452 Australian Share ★★★ 133.89 NAv 1.85 - 1.61 - 0.45 6.35IOOF OIS Perpetual Industrial Share ★★★ 16.91 NAv 2.16 - 1.88 - 1.90 NAvAustralian Mid/Small CapsAustralian Ethical Equities Trust ★★★★ 161.65 NAv 2.02 2.11 7.93 10.25Sandhurst BMF - Sandhurst Future Leaders Fund ★★★ 32.54 NAv 2.10 - 7.53 - 3.27 4.12CFS FC Inv - CFS Future Leaders ★★★ 11.43 NAv 2.03 - 7.97 - 1.21 8.56ING OA IP ING Emerg Comp ★★★★ 43.65 NAv 1.80 - 8.46 2.93 13.27International EquityZurich Investments Global Thematic Retail Share Fund ★★★★★ 16.97 NAv 2.05 - 1.52 - 2.49 4.43BT Partner International Shares Core 1 (Retail) ★★★★ 28.56 NAv 2.10 - 4.88 - 6.30 NAvFiducian Global Smaller Cos and Emerging Markets ★★★★ 23.36 NAv 1.27 - 5.50 - 2.39 6.06Goldman Sachs JBWere International Fund ★★★★ 19.85 NAv 1.95 - 7.44 - 6.32 - 0.44Australian PropertyANZ - Property Securities Trust ★★★★ 18.72 NAv 1.57 - 29.96 - 18.89 - 6.47BT Property Securities Fund (Retail) ★★★★ 72.86 NAv 1.65 - 31.24 - 19.00 - 6.63Challenger Property Securities Fund ★★★★ 23.57 NAv 1.70 - 31.84 - 21.37 - 7.88the top 10 FUNDS – based on one year per<strong>for</strong>mance (Morningstar rating not required)Magellan Global Fund NR 70.53 NAv 1.36 8.14 NAv NAvCFS FC Inv - FirstChoice Asian Share NR 14.25 NAv 2.30 6.47 NAv NAvAMP FLI-Future Directions Australian Bond ★★ 12.36 NAv 1.80 6.47 4.29 4.13CFS FC Inv - Deutsche Australian Bond NR 11.32 NAv 1.50 6.44 NAv NAvBT Fixed Interest Fund (Retail) ★ 28.38 NAv 1.64 6.43 4.25 3.95Challenger China Share Fund ★★ 35.44 NAv 2.30 6.38 12.02 NAvAust Unity Healthcare Property Trust ★★★★ 183.60 NAv 2.12 6.34 13.13 15.77BT Challenger Howard Mortgage ★★★ 18.74 NAv 1.58 5.33 6.10 NAvCFS FC Inv - FirstChoice Fixed Interest ★★★ 44.95 NAv 1.51 4.92 4.23 4.37BT UBS Diversified Fixed Income ★★★ 28.12 NAv 1.69 9.96 4.37 4.39How to read the tables®• The Selector’s List presents funds distributed via CommSec in three broadcategories grouped according to their legal structure being managed investments,<strong>super</strong>annuation funds and allocated pensions. Defensive sub-categories includeAustralian cash, Australian diversified bonds, Global diversified bonds andAustralian mortgages. Growth subcategories include Australian equity general,Australian mid/small caps, International equity general, Australian property. Multisectorsub-categories include, Conservative, Moderate, Balanced, Growth, andAggressive where, <strong>for</strong> example, Multi-sector Moderate category consists of fundsthat invest in a number of sectors and have between 21% and 40% of theirinvestments exposed to the growth sectors (typically defined as equity andproperty asset classes).• Fund Size ($M) is defined as the net assets within the fund. Internally sourcedmoney from the manager’s other funds is excluded to avoid double counting.^• MER (% pa) (Management Expense Ratio) is a ratio, expressed as apercentage per annum, used to capture most expenses incurred by a fund.^• ICR (% pa) (Indirect Cost Ratio) is a measure of the ‘indirect’ managementcosts of investing in the fund designed to show how much of an investmentin a Fund is supposed to be paid to the fund manager each year.• Total Return (%) are the returns of the funds over 1, 3 and 5 years after fees,charges and taxes and assuming all distributions have been included. Entryand exit fees are ignored.The Selector’s List ® is compiled from in<strong>for</strong>mation supplied by Morningstar. Datais latest available as at 31 July 2009. For up-to-date and full details of howMorningstar compile their ratings visit funds.commsec.com.au or call 13 15 20.^Note: The ICR is similar to the MER in that both are a measure of fees. The ICR isthe industry standard <strong>for</strong> measuring fund expenses. However, some funds do not yetprovide an ICR in which case the MER has been used instead.page 15
Top Rated Superannuation & Pension Fundsas rated by morningstarFund NAME Rating Size($M)<strong>super</strong>annuation defensive fundsAustralian CashMER(%pa)ICR(%pa)Total Return (%pa)1 year 3 year 5 yearIOOF OSS UBS Cash ★★★ 49.92 NAv 1.70 2.66 3.87 3.78Zurich Super - Cash Fund ★★★ 22.35 NAv 1.51 3.08 4.00 3.79Australian Fixed InterestING Integra - ING Cash ★★★ 82.10 NAv 1.40 2.81 3.83 3.70ING OA PS - ING Cash ★★★ 113.01 NAv 1.12 3.35 3.85 NAvInternational Fixed InterestCFS FC PersSuper - CFS Income ★★★ 185.72 NAv 1.50 1.12 3.25 3.67Australian Fixed Interest - MortgagesPerpetual WFS Perpetual’s Mortgage ★★★★ 30.41 NAv 1.30 3.62 4.56 4.64<strong>super</strong>annuation growth fundsAustralian EquityIOOF OSS UBS Australian Share ★★★★★ 27.47 NAv 2.15 2.64 2.50 9.50IOOF OSS Perpetual Industrial Share ★★★ 27.20 NAv 2.16 1.92 - 0.21 NAvZurich Super Australian Value Share ★★★★★ 21.73 NAv 1.86 0.14 2.26 8.93AMP FLS & CS-Schroder Australian Equities ★★★★★ 202.58 NAv 2.25 - 0.62 0.56 8.52CFS FC PersSuper-452 Australian Share ★★★ 168.15 NAv 1.88 - 1.13 0.66 6.70Perpetual WFS Perpetual's Industrial Share ★★★ 239.11 NAv 1.95 - 1.18 - 0.55 5.63Australian Equity - Mid/Small CapsCFS FC PersSuper- Souls Australian Small Companies ★★★★ 10.78 NAv 1.96 - 0.61 0.65 NAvCFS FC PersSuper - CFS Future Leaders ★★★ 16.17 NAv 2.05 - 7.68 - 0.60 8.12International EquityIOOF GSS Platinum International ★★★★★ 14.15 NAv 2.61 24.35 4.16 7.27IOOF OSS Platinum International ★★★★★ 48.12 NAv 2.96 23.17 3.25 6.08Macquarie Super/RO Plan - Platinum International ★★★★★ 13.44 2.70 NAv 20.68 2.43 5.67ING OA PS Platinum International ★★★★★ 21.33 NAv 2.79 20.04 2.41 NAvPerpetual WFS Platinum International ★★★★★ 29.61 NAv 2.75 19.73 2.45 5.93CFS FC PersSuper - Platinum International ★★★★★ 293.07 NAv 2.46 18.35 2.15 5.72Australian PropertyING OA PS ING Property Securities ★★★★★ 14.98 NAv 1.95 - 29.21 - 17.32 - 5.90ING Integra-ING Property Securities ★★★★ 19.86 NAv 1.65 - 29.26 - 17.33 - 5.88BT Lifetime Pers Super - Property Securities ★★★★★ 29.87 NAv 1.67 - 30.05 - 18.52 - 6.70IOOF OSS APN Property <strong>for</strong> Income ★★★★★ 11.46 NAv 2.29 - 30.38 - 14.90 - 3.45PENSION DEFENSIVE FUNDSAustralian – CashCFS FC Pens - CFS Cash ★★★ 589.47 NAv 1.12 4.75 5.49 5.17CFS Personal Pension Plan - Capital Secure Option ★★★★ 43.02 NAv 1.06 4.73 5.53 5.21Australian BondsING OA AP OPT Aust Fixed Int ★★★ 11.56 NAv 1.76 8.29 4.76 4.29Global BondsING OA AP UBS Div Fixed Inc ★★★ 11.53 NAv 1.52 9.85 4.33 4.33MortgagesIOOF OPS Aust Unity Mortgage Income ★★★ 25.30 NAv 1.96 4.59 5.33 5.13PENSION GROWTH FUNDSAustralian EquityIOOF OPS Perpetual Industrial Share ★★★★ 14.10 NAv 2.16 2.70 0.13 NAvCFS FC Pens-452 Australian Share ★★★ 74.05 NAv 1.86 0.09 1.18 7.86Perpetual WFA Perpetual's Industrial Share ★★★★ 56.87 NAv 1.95 0.75 0.32 6.77International EquityIOOF OPS - Platinum International ★★★★ 16.97 NAv 2.96 25.16 3.17 6.45ING OA AP - Platinum International ★★★★★ 37.87 NAv 2.70 24.92 3.11 6.59MLC MKey AP GS - Platinum International ★★★★★ 61.42 NAv 2.86 24.85 2.95 NAvAustralian PropertyING OA AP ING Property Securities ★★★★ 10.90 NAv 1.80 - 30.61 - 18.89 - 6.42CFS FC Pens - BT Property Investment ★★★★ 10.79 NAv 1.66 - 31.58 - 19.19 - 6.71CFS FC Pens - RREEF Property Securities ★★★ 18.61 NAv 1.66 - 35.34 - 24.03 - 9.49page 16
Top Multisector Fundsas rated by morningstarFund NAME Rating Size($M)UNIT TRUSTSMultisector ConservativeMER(%pa)ICR(%pa)Total Return (%pa)1 year 3 year 5 yearCFS FC Inv - PM Capital Enhanced Yield ★★★★★ 11.61 NAv 1.30 5.00 4.64 NAvMultisector ModerateCFS MIF - Conservative Fund ★★★★ 117.26 NAv 1.40 1.00 2.23 4.87Advance Defensive Multi-Blend Fund ★★★★ 14.31 NAv 1.72 0.86 2.34 4.67CFS FC Inv - CFS Conservative ★★★ 18.99 NAv 1.65 0.72 1.94 4.58Multisector BalancedCFS MIF - Balanced Fund ★★★ 153.68 NAv 1.51 - 2.46 - 0.70 3.74CFS FC Inv - Perpetual Diversified Growth ★★★ 13.65 NAv 1.80 - 2.59 - 0.26 4.12AMP FLI-AMP Monthly Income Fund No 1 ★★★★★ 60.84 NAv 1.80 - 3.16 2.51 6.80Multisector GrowthGoldman Sachs JBWere Diversified Growth Fund ★★★ 15.66 NAv 1.90 - 4.72 - 2.44 4.07CFS MIF - Diversified Fund ★★★ 318.75 NAv 1.63 - 5.00 - 2.91 3.22Zurich Investments Managed Growth Retail Fund ★★★★ 20.80 NAv 1.80 - 5.87 - 0.66 5.38Multisector AggressiveBT Future Goals Fund (Retail) ★★★ 176.26 NAv 2.00 - 11.07 - 4.82 3.33MLC MKey InvSer/UT Horizon 5 - Growth ★★★ 231.93 NAv 1.92 - 14.00 - 4.88 2.79AMP FLI-AMP High Growth ★★★ 61.76 NAv 2.10 - 14.32 - 5.49 2.93SUPERANNUATIONMultisector DefensiveCFS FC PSuper- PM Cap Enhanced Yield ★★★★★ 27.51 NAv 1.31 4.55 4.24 NAvCFS FC PersSuper - FirstChoice Defensive ★★★ 71.74 NAv 1.56 2.40 2.81 3.71Multisector ModerateZurich Super - Capital Stable Fund ★★★★ 24.18 NAv 1.86 2.49 2.42 4.33Macquarie Super/RO Plan - Capital Stable ★★★ 12.88 1.91 NAv 1.30 1.38 3.41Multisector BalancedPerpetual WFS Perpetual's Diversified Growth ★★★★ 20.09 NAv 1.85 - 1.68 0.26 4.26Zurich Super - Balanced Fund ★★★★★ 22.40 NAv 1.86 - 1.75 1.23 5.32Multisector GrowthPerpetual WFS Schroder Balanced ★★★ 10.49 NAv 1.95 - 1.14 1.40 5.75Macquarie Super/RO Plan - Balanced ★★★★ 58.87 1.91 NAv - 3.34 - 0.41 4.34IOOF OSS JBWere Diversified Growth ★★★ 11.56 NAv 2.20 - 4.54 - 2.19 3.68Multisector AggressiveZurich Super - Priority Growth Fund ★★★★★ 25.73 NAv 1.86 - 4.36 - 0.45 6.36Macquarie Super/RO Plan - Growth ★★★★ 20.73 1.91 NAv - 5.31 - 1.38 4.79CFS FC PersSuper - CFS High Growth ★★★★ 16.36 NAv 2.04 - 5.85 - 2.92 3.78Morningstar ratings (continued from page 9)Morningstar’s ratings are a risk adjusted quantitative measure of comparable funds.★★★★★ an excellent risk adjusted record.★★★★ a very good quality risk adjusted record.★★★ a good quality risk adjusted record.★★ a poor quality risk adjusted record.★ a very poor quality risk adjusted record.How to read the tablesMorningstar introduced star ratings <strong>for</strong> managed funds in Australia in April 1998 usingan easily identifiable scale from one to five stars. Morningstar Ratings <strong>for</strong> Australianfunds are based on a risk-adjusted return quantitative measure. The way thatMorningstar calculates the Rating means that investors can easily compare like funds.Morningstar calculates each fund’s three- and five-year MRAR (Morningstar Risk-Adjusted Return) measures, compared with the risk-free rate as measured by theAustralian 90-day Bank Bill Accepted Rate, provided there are enough monthlyreturns <strong>for</strong> these periods (36 and 60 months-ends, respectively). A fund’s overallMorningstar Rating is a 40:60 combination of 5-year and 3-year Morningstarratings, drawn from the MRAR measures <strong>for</strong> these periods. This mix rewardsconsistent good per<strong>for</strong>mance over an extended time frame, and is less subject toshort-term variations in fund per<strong>for</strong>mance.The following criteria have been used to filter the list of funds:1. Fund must be open to new investors.2. Fund size must be more than $10 million.3. Funds listed must have a minimum 3 star rating by Morningstar.The only exception where a fund listed is not rated is the Top 10 list<strong>for</strong> Managed Investments.4. No nil entry fee funds have been included.5. Funds listed are ranked according to the highest star rating and total returnover 1 year in the relevant Morningstar’s sub-category.Disclaimer: © Morningstar, Inc. All rights reserved. To the extent that any of the content above constitutes advice, it is general advice that has been prepared by MorningstarResearch Pty Ltd ABN 83 062 096 342, AFSL 243161 (a subsidiary of Morningstar, Inc.), without reference to <strong><strong>you</strong>r</strong> objectives, financial situation or needs. Be<strong>for</strong>e acting on anyadvice, <strong>you</strong> should consider the appropriateness of the advice and Morningstar recommends <strong>you</strong> obtain financial, legal and taxation advice be<strong>for</strong>e making any financial investmentdecision. If applicable, investors should obtain the relevant product disclosure statement and consider it be<strong>for</strong>e making any decision to invest. Please refer to Morningstar’s FinancialServices Guide (FSG) <strong>for</strong> more in<strong>for</strong>mation at www.aspecthuntley.com.au/FSG or www.morningstar.com.au/fsg.asppage 17
Cromwell Riverpark Trust Investment opportunity extendedOffer closes no later than 31 December 2009The Cromwell Riverpark Trust (CRT) is a 7 year commercialproperty investment distributing 8.51% pa 1 * <strong>for</strong>ecast to growupon practical completion and offers capital growth potential 1and tax deferred income 2 from the energy efficient RiverparkBuilding in Brisbane.Settlement of Energex BuildingThe Cromwell Group, in its ASX-announcement dated 9 July2009, has advised that the Trust has settled on its acquisition ofthe land at 33 Breakfast Creek Road, Newstead Brisbane. Thesettlement on the land is the trigger <strong>for</strong> units in the Trust beingissued to investors and this was accomplished on 8 July 2009.The Trust is paying 100% tax deferred distributions at the PDS<strong>for</strong>ecast rate of 8.51%* p.a.Supplementary Product Disclosure Statement(‘SPDS’) (30 June 2009)CPS has further issued a Supplementary Product DisclosureStatement (‘SPDS’) <strong>for</strong> the CRT dated 30 June 2009. The SPDSis supplemental to the original Product Disclosure Statement(PDS) <strong>for</strong> the Trust (dated 25 February 2009).The Offer periodhas been extended from 30 June 2009 to 31 December 2009;›› The Cromwell Group has agreed to commit $30m to theTrust. This will be via a convertible loan, the balance of whichmust convert to equity by 31 December 2009. It is theCromwell intention to continue raising external equity in theFund up to a limit of $91m. As equity is raised, this loanbalance will reduce.To find out moreFor more in<strong>for</strong>mation, or to obtain a Product DisclosureStatement, visit www.funds.commsec.com.au, or emaildirectfunds@commsec.com.au or call a Funds specialiston 13 15 20, 8am – 5pm Monday to Friday (Sydney time).Important in<strong>for</strong>mation Units in the Cromwell Riverpark Trust (“CRT”) are issued by Cromwell Property Securities Limited (ABN 11 079 147 809, AFSL 238052). Application <strong>for</strong> units can onlybe made on an application <strong>for</strong>m from the Product Disclosure Statement dated 25 February 2009 (PDS) which bears a sticker or approved wording confirming that <strong>you</strong> have received and readthe Supplementary Product Disclosure Statement dated 30 June 2009 (SPDS). This in<strong>for</strong>mation has been prepared without taking into account <strong><strong>you</strong>r</strong> objectives, financial situation or needs.There<strong>for</strong>e, in deciding whether to acquire or continue to hold an investment in CRT, <strong>you</strong> should consider the PDS and assess, with or without <strong><strong>you</strong>r</strong> financial or taxation adviser, whether theproduct fits <strong><strong>you</strong>r</strong> objectives, financial situation or needs. A PDS and SPDS may be obtained by contacting CommSec on 13 15 20 or by email at directfunds@commsec.com.au and shouldbe considered be<strong>for</strong>e making any decision about the product. CommSec, a distributor of the PDS, does not guarantee the per<strong>for</strong>mance of, or capital invested in the CRT. *An establishmentfee of 4% + GST is payable to CommSec upon investment in the CRT, of which 80% will be rebated to <strong>you</strong> as additional units in accordance with the PDS. Commonwealth Securities LimitedABN 60 067 254 399 AFSL 238814 (CommSec) is a wholly owned but non-guaranteed subsidiary of Commonwealth Bank of Australia ABN 48 123 123 124 AFSL 234945 and a participantof the ASX Group and the Sydney Futures Exchange. All in<strong>for</strong>mation relates to A Class Units in the Cromwell Riverpark Trust. (1) Capital growth and distributions are not guaranteed. Subjectto assumptions and risks contained in the PDS and SPDS. (2) The proportion of distributions that are tax deferred is dependent on a number of factors (<strong>for</strong> example building amortisation anddepreciation of plant and equipment) and may vary from year to year. Deferred tax may be payable, in whole or in part, on the sale, transfer or redemption of units in the Trust.Order FormTo receive a PDS simply the relevant box(es) and return by either mail: CommSec, Reply Paid 60768,Australia Square NSW 1215, fax on 1300 135 519 or phone 13 15 20, 8am to 5pm, Sydney time, Monday to Friday.CBA Capital Series TrioMan OM-IP 3 AHLMan AHL Alpha (AUD)Perpetual Industrial Share FundPerpetual Concentrated Equity FundCromwell Riverpark TrustMPG Enterprise Property TrustOpus Income and Capital Fund No.21CFS FirstChoice SuperannuationCFS FirstChoice PensionCFS FirstChoice InvestmentPlease provide <strong><strong>you</strong>r</strong> daytime phone number[ ] .......................................................Are <strong><strong>you</strong>r</strong> address details correct?If not, please let us know so wecan update our records.Privacy PolicyCommSec respects client privacy. If <strong>for</strong> any reason <strong>you</strong> no longer want toreceive Selector’s List ® , simply tick the box below and return this <strong>for</strong>m tous, or telephone us on 13 15 20.No thanks. I no longer wish to receive Selector’s List ®Commonwealth Securities Limited ABN 60 067 254 399 AFSL 238814 Locked Bag 22, Australia Square NSW 1215Tel: 13 15 20 Fax: 02 8223 7160 Email: directfunds@commsec.com.au www.funds.commsec.com.auSL001page 19
TOP PERFORMING FUNDSFund Manager Fund NameReceive Selector’s List OnlineSend us <strong><strong>you</strong>r</strong> email address to receive Selector’s List Online. You’ll also getfree market and investment news every month, direct to <strong><strong>you</strong>r</strong> inbox.Why switch to email?• Receive a free monthly e-newsletter from CommSec with thelatest funds per<strong>for</strong>mance and market news, straight to <strong><strong>you</strong>r</strong> inbox.• Receive Selector’s List online in advance of the printed version.• Do <strong><strong>you</strong>r</strong> bit <strong>for</strong> the environment and help save paper.In this issueInvestment opportunitiesTop per<strong>for</strong>ming fundsSave on feesINVESTMENT OPPORTUNITIESCurrent Offers Closing DateCapital Series 19 June 2009CompassMan OM-IP 2AHL 11 July 2009Macquarie Forestry 30 June 2009Investment 2009Macquarie Almond 15 June 2009Investment 2009MONTHLY UPDATE – JULY 2009Dear Sir/Madam,Welcome to the CommSec Selector’s List July newsletter.This month we look at the Swan/Rudd budget set in one of the mostcha lenging economic environments we have seen <strong>for</strong> many yearsand how the budget may impact investing. We also have a diverserange of new investment opportunities to show <strong>you</strong>.To read the full newsletter, copy and paste this link into <strong><strong>you</strong>r</strong>web browser [link]ECONOMY Which assets will move next?The healing process is we l underway, writes CommSec Chief Economist CraigJames in his review of the past financial year and outlook <strong>for</strong> the year ahead.Investors have been gradua ly moving out of cash and bonds to return toshares, property and commodities. Sharemarket returns have lifted 26.6 percent since March 6 while returns on bonds have fa len 4.1 per cent in theJune quarter – the biggest fa l in 20 years.TAX No time to loseA little ef<strong>for</strong>t now could mean savings down the track. With the new taxyear underway, spend some time thinking about what <strong>you</strong> need to do. Butremember that choosing investments jus to cut <strong><strong>you</strong>r</strong> tax bi l is not necessarilya sound strategy <strong>for</strong> building wealth.SMSFs Opportunity knocksWhether <strong>you</strong>’re shaken or stirred, don’t let market volatility get in the wayof the many opportunities that sti l exist. Get active when it comes toasset a location rather than sitting on <strong><strong>you</strong>r</strong> hands. Research is the key.ETFs Countering volatilityThe global recession is expected to have a positive effect on exchange tradedfunds (ETFs), which have become one of the world’s fastest growing investments.ETFs are winning investors over because they offer diversification,liquidity and low-cost access to overseas markets.FREE Tools, research and newslettersCommSec Direct Managed Funds – a smarter, faster way to manage and develop<strong><strong>you</strong>r</strong> portfolio. Choose from more than 1000 funds and enjoy savings of up to 100%on entry or contribution fees.How do I subscribe to Selector’s List Online?Just give us <strong><strong>you</strong>r</strong> email address in one of the following ways:Online: Visit https://funds.comsec.com.au/Public/MyPortfolio and follow the prompts.Email: directfunds@commsec.com.auFax: Fill in the <strong>for</strong>m below and fax to 1300 135 519.Post: Fill in the <strong>for</strong>m below and return to us in the postage-free envelope provided in this edition of Selector’s List.Phone: Call us on 13 15 20 and we will set <strong>you</strong> up on the spot.Subscribe now■ Yes, I would like to receive Selector’s List Online*My email address is: ___________________________________________________________________Return this <strong>for</strong>m using the Reply Paid envelope in this issue of Selector’s ListOR fax this <strong>for</strong>m to: 1300 135 519* Your email address will be used <strong>for</strong> no other purpose than to receive in<strong>for</strong>mation from CommSec. By ticking this box<strong>you</strong> are also subscribing to CommSec’s Managed Funds News monthly e-newsletter and Monthly Funds email alert.Privacy policyCommSec respects client privacy. If <strong>you</strong> no longer want to receive Selector’s List,either in print or online, tick the box below and return this <strong>for</strong>m to us, or telephone us on 13 15 20.■ No thanks - I no longer wish to receive Selector’s List, either in print or online.Commonwealth Securities Limited ABN 60 067 254 399. AFSL 238814 Locked Bag 22, Australia Square NSW 1215page Tel: 2013 15 20; fax: 02 8223 7160; email: directfunds@commsec.com.au; www.funds.commsec.com.au