Converting from a Two-Sided Power Spectrum to a Single-Sided ...
Converting from a Two-Sided Power Spectrum to a Single-Sided ...
Converting from a Two-Sided Power Spectrum to a Single-Sided ...

You also want an ePaper? Increase the reach of your titles
YUMPU automatically turns print PDFs into web optimized ePapers that Google loves.
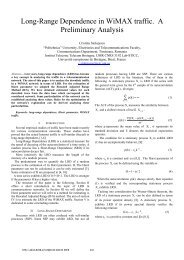
The Fundamentals of FFT-BasedSignal Analysis and Measurement inLabVIEW and LabWindows/CVIStudent: Cosmin ButasProfessor: Corina Nafornita2010
The Fast Fourier Transform (FFT) and the power spectrum arepowerful <strong>to</strong>ols for analyzing and measuring signals <strong>from</strong> plug-in data acquisition(DAQ) devices. For example, you can effectively acquire time-domain signals,measure the frequency content, and convert the results <strong>to</strong> real-world units anddisplays as shown on traditional bench<strong>to</strong>p spectrum and network analyzers.To perform FFT-based measurement, however, you must understandthe fundamental issues and computations involved.The basic functions for FFT-based signal analysis are the FFT, the<strong>Power</strong> <strong>Spectrum</strong>, and the Cross <strong>Power</strong> <strong>Spectrum</strong>. Using these functions asbuilding blocks, you can create additional measurement functions such asfrequency response, impulse response, coherence, amplitude spectrum, andphase spectrum.FFTs and the <strong>Power</strong> <strong>Spectrum</strong> are useful for measuring the frequencycontent of stationary or transient signals. FFTs produce the average frequencycontent of a signal over the entire time that the signal was acquired. For thisreason, you should use FFTs for stationary signal analysis or in cases whereyou need only the average energy at each frequency line. To measurefrequency information that is changing over time, use joint time-frequencyfunctions such as the Gabor Spectrogram.
Basic Signal Analysis ComputationsThe basic computations for analyzing signals include converting <strong>from</strong> atwo-sided power spectrum <strong>to</strong> a single-sided power spectrum, adjustingfrequency resolution and graphing the spectrum, using the FFT, and convertingpower and amplitude in<strong>to</strong> logarithmic units.The power spectrum returns an array that contains the two-sided powerspectrum of a time-domain signal. The array values are proportional <strong>to</strong> theamplitude squared of each frequency component making up the time-domainsignal.A k is the peak amplitude of thesinusoidal component at frequency k.Figure 1. <strong>Two</strong>-<strong>Sided</strong> <strong>Power</strong> <strong>Spectrum</strong> of Signal
<strong>Converting</strong> <strong>from</strong> a <strong>Two</strong>-<strong>Sided</strong> <strong>Power</strong> <strong>Spectrum</strong><strong>to</strong> a <strong>Single</strong>-<strong>Sided</strong> <strong>Power</strong> <strong>Spectrum</strong>Most real-world frequency analysis instruments display only the positivehalf of the frequency spectrum because the spectrum of a real-world signal issymmetrical around DC. Thus, the negative frequency information is redundant.The two-sided results <strong>from</strong> the analysis functions include the positivehalf of the spectrum followed by the negative half of the spectrum.In a two-sided spectrum, half the energy is displayed at the positivefrequency, and half the energy is displayed at the negative frequency.Therefore,<strong>to</strong> convert <strong>from</strong> a two-sided spectrum <strong>to</strong> a single-sided spectrum, discard thesecond half of the array and multiply every point except for DC by two.Figure 2. <strong>Single</strong>-<strong>Sided</strong> <strong>Power</strong> <strong>Spectrum</strong> of Signal in Figure 1SAA is the two-sided power spectrumGAA is the single-sided power spectrumN is the length of the two-sided power spectrum
Adjusting Frequency Resolution andGraphing the <strong>Spectrum</strong>Figures 1 and 2 show power versus frequency for a time-domain signal.The frequency range and resolution on the x-axis of a spectrum plot depend onthe sampling rate and the number of points acquired. The number of frequencypoints or lines in Figure 2 equalsThe first frequency line is at 0 Hz, that is, DC. The last frequency line is atFs is the frequency at which the acquired time-domain signal was sampledThe frequency lines occur at intervalsFrequency lines also can be referred <strong>to</strong> as frequency bins or FFT bins becauseyou can think of an FFT as a set of parallel filters of bandwidth centered at eachfrequency increment <strong>from</strong>The computations for the frequency axis demonstrate that the samplingfrequency determines the frequency range or bandwidth of the spectrum andthat for a given sampling frequency, the number of points acquired in the timedomainsignal record determine the resolution frequency.
Computations Using the FFTThe power spectrum shows power as the mean squared amplitude ateach frequency line but includes no phase information. Because the powerspectrum loses phase information, you may want <strong>to</strong> use the FFT <strong>to</strong> view boththe frequency and the phase information of a signal.The phase information the FFT yields is the phase relative <strong>to</strong> the star<strong>to</strong>f the time-domain signal. For this reason, you must trigger <strong>from</strong> the same pointin the signal <strong>to</strong> obtain consistent phase readings. In many cases, your concernis the relative phases between components, or the phase difference betweentwo signals acquired simultaneously.The FFT returns a two-sided spectrum in complex form (real andimaginary parts), which you must scale and convert <strong>to</strong> polar form <strong>to</strong> obtainmagnitude and phase. The frequency axis is identical <strong>to</strong> that of the two-sidedpower spectrum. The amplitude of the FFT is related <strong>to</strong> the number of points inthe time-domain signal.
The two-sided amplitude spectrum actually shows half the peakamplitude at the positive and negative frequencies. To convert <strong>to</strong> the singlesidedform, multiply each frequency other than DC by two, and discard thesecond half of the array. The units of the single-sided amplitude spectrum arethen in quantity peak and give the peak amplitude of each sinusoidalcomponent making up the time-domain signal. For the single-sided phasespectrum, discard the second half of the array.To view the amplitude spectrum in volts (or another quantity) rms,divide the non-DC components by the square root of two after converting thespectrum <strong>to</strong> the single-sided form.The amplitude spectrum is closely related <strong>to</strong> the power spectrum. Youcan compute the single-sided power spectrum by squaring the single-sided rmsamplitude spectrum. Conversely, you can compute the amplitude spectrum bytaking the square root of the power spectrum. The two-sided power spectrum isactually computed <strong>from</strong> the FFT as follows.
<strong>Converting</strong> <strong>to</strong> Logarithmic UnitsMost often, amplitude or power spectra are shown in the logarithmicunit decibels (dB). Using this unit of measure, it is easy <strong>to</strong> view wide dynamicranges; that is, it is easy <strong>to</strong> see small signal components in the presence oflarge ones. The decibel is a unit of ratio and is computed as followsP is the measured powerPr is the reference powerTo compute the ratio in decibels <strong>from</strong> amplitude values we will useA is the measured amplitudeAr is the reference amplitudeWhen using amplitude or power as the amplitude-squared of the samesignal, the resulting decibel level is exactly the same. Multiplying the decibelratio by two is equivalent <strong>to</strong> having a squared ratio. Therefore, you obtain thesame decibel level and display regardless of whether you use the amplitude orpower spectrum.
Antialiasing and Acquisition Front Endsfor FFT-Based Signal AnalysisFFT-based measurement requires digitization of a continuous signal.According <strong>to</strong> the Nyquist criterion, the sampling frequency, Fs, must be at leasttwice the maximum frequency component in the signal. If this criterion isviolated, a phenomenon known as aliasing occurs.Figure 3.This figure shows an adequately sampled signal and an undersampledsignal. In the undersampled case, the result is an aliased signal that appears <strong>to</strong>be at a lower frequency than the actual signal.
When the Nyquist criterion is violated, frequency components abovehalf the sampling frequency appear as frequency components below half thesampling frequency, resulting in an erroneous representation of the signal.Figure 4. Alias Frequencies Resulting <strong>from</strong> Sampling a Signal at 100 Hz ThatContains Frequency Components Greater than or Equal <strong>to</strong> 50 HzFigure 4 shows the alias frequencies that appear when the signal withreal components at 25, 70, 160, and 510 Hz is sampled at 100 Hz. Aliasfrequencies appear at 10, 30, and 40 Hz.
Before a signal is digitized, you can prevent aliasing by usingantialiasing filters <strong>to</strong> attenuate the frequency components at and above half thesampling frequency <strong>to</strong> a level below the dynamic range of the analog-<strong>to</strong>-digitalconverter (ADC).These higher frequency components, do not interfere with themeasurement. If you know that the frequency bandwidth of the signal beingmeasured is lower than half the sampling frequency, you can choose not <strong>to</strong> usean antialiasing filter.Figure 5.Figure 5 shows the input frequency response of the NationalInstruments PCI-4450 Family dynamic signal acquisition boards, which haveantialiasing filters. Note how an input signal at or above half the samplingfrequency is severely attenuated.
Limitations of the Acquisition Front EndIn addition <strong>to</strong> reducing frequency components greater than half thesampling frequency, the acquisition front end you use introduces somebandwidth limitations below half the sampling frequency. To eliminate signals a<strong>to</strong>r above half of the sampling rate <strong>to</strong> less than the measurement range,antialiasing filters start <strong>to</strong> attenuate frequencies at some point below half thesampling rate. Because these filters attenuate the highest frequency portion ofthe spectrum, typically you want <strong>to</strong> limit the plot <strong>to</strong> the bandwidth you considervalid for the measurement.The characteristics of the signal acquisition front end affect themeasurement. The National Instruments PCI-4450 Family dynamic signalacquisition boards and the NI 4551 and NI 4552 dynamic signal analyzers areexcellent acquisition front ends for performing FFT-based signal analysismeasurements. These boards use delta-sigma modulation technology, whichyields excellent amplitude flatness, high-performance antialiasing filters, andwide dynamic range as shown in Figure 5. The input channels are alsosimultaneously sampled for good multichannel measurement performance.
Dynamic Range SpecificationsThe signal-<strong>to</strong>-noise ratio (SNR) of the PCI-4450 Family boards is 93 dB.SNR is defined asVs and Vn are the rms amplitudes of thesignal and noise.A bandwidth is usually given for SNR. In this case, the bandwidth is thefrequency range of the board input, which is related <strong>to</strong> the sampling rate asshown in Figure 5. The 93 dB SNR means that you can detect the frequencycomponents of a signal that is as small as 93 dB below the full-scale range ofthe board. This is possible because the <strong>to</strong>tal input noise level caused by theacquisition front end is 93 dB below the full-scale input range of the board.If the signal you moni<strong>to</strong>r is a narrowband signal (that is, the signalenergy is concentrated in a narrow band of frequencies), you are able <strong>to</strong> detectan even lower level signal than -93 dB. This is possible because the noiseenergy of the board is spread out over the entire input frequency range.The spurious-free dynamic range of the dynamic signal acquisitionboards is 95 dB. Besides input noise, the acquisition front end may introducespurious frequencies in<strong>to</strong> a measured spectrum because of harmonic orintermodulation dis<strong>to</strong>rtion, among other things.
The signal-<strong>to</strong>-<strong>to</strong>tal-harmonic-dis<strong>to</strong>rtion (THD)-plus-noise ratio, whichexcludes intermodulation dis<strong>to</strong>rtion, is 90 dB <strong>from</strong> 0 <strong>to</strong> 20 kHz. THD is ameasure of the amount of dis<strong>to</strong>rtion introduced in<strong>to</strong> a signal because of thenonlinear behavior of the acquisition front end. This harmonic dis<strong>to</strong>rtion showsup as harmonic energy added <strong>to</strong> the spectrum for each of the discretefrequency components present in the input signal.Figure 6.This figure shows a typical spectrum plot of the PCI-4450 Familydynamic range with a full-scale 997 Hz signal applied. You can see that theharmonics of the 997 Hz input signal, the noise floor, and any other spuriousfrequencies are below 95 dB.
Spectral LeakageFor an accurate spectral measurement, it is not sufficient <strong>to</strong> use propersignal acquisition techniques <strong>to</strong> have a nicely scaled, single-sided spectrum.You might encounter spectral leakage.Spectral leakage is the result of an assumption in the FFT algorithmthat the time record is exactly repeated throughout all time and that signalscontained in a time record are thus periodic at intervals that correspond <strong>to</strong> thelength of the time record. If the time record has a nonintegral number of cycles,this assumption is violated and spectral leakage occurs. Another way of lookingat this case is that the nonintegral cycle frequency component of the signaldoes not correspond exactly <strong>to</strong> one of the spectrum frequency lines.There are only two cases in which you can guarantee that an integralnumber of cycles are always acquired.- one case is if you are sampling synchronously with respect <strong>to</strong> the signalyou measure and can therefore deliberately take an integral number of cycles.- another case is if you capture a transient signal that fits entirely in<strong>to</strong> thetime record.In most cases, however, you measure an unknown signal that isstationary; the signal is present before, during, and after the acquisition.
Spectral leakage dis<strong>to</strong>rts the measurement in such a way that energy<strong>from</strong> a given frequency component is spread over frequency lines or bins. Youcan use windows <strong>to</strong> minimize the effects of performing an FFT over anonintegral number of cycles.Figure 7.This figure shows the effects of three different windows -- none(Uniform), Hanning (also commonly known as Hann), and Flat Top -- when anintegral number of cycles have been acquired, in this figure, 256 cycles in a1,024-point record. The Uniform window has the narrowest lobe, and the Hannand Flat Top windows introduce some spreading. The Flat Top window has abroader main lobe than the others.
Figure 8.This figure shows the leakage effects when you acquire 256.5 cycles.Notice that at a nonintegral number of cycles, the Hann and Flat Top windowsintroduce much less spectral leakage than the Uniform window. Also, theamplitude error is better with the Hann and Flat Top windows. The Flat Topwindow demonstrates very good amplitude accuracy but also has a widerspread and higher side lobes than the Hann window.
In addition <strong>to</strong> causing amplitude accuracy errors, spectral leakage canobscure adjacent frequency peaks. Figure 9 shows the spectrum for two closefrequency components when no window is used and when a Hann window isused.Figure 9. Spectral Leakage Obscuring Adjacent Frequency Components
Thank You !