R E H A B I L I T A T I O N - Ontario Hospital Association
R E H A B I L I T A T I O N - Ontario Hospital Association
R E H A B I L I T A T I O N - Ontario Hospital Association

You also want an ePaper? Increase the reach of your titles
YUMPU automatically turns print PDFs into web optimized ePapers that Google loves.
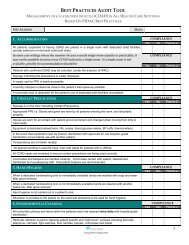
PERFORMANCE ALLOCATION TABLECLINICAL UTILIZATION AND OUTCOMES<strong>Hospital</strong>CommunityServedLHINAll Rehabilitation Client Groups Stroke Orthopedic ConditionsAverage Active Average Active Average Active Length ofAverage Total Rehabilitation Length of Average Total Rehabilitation Length of Average Total Rehabilitation StayFunction Change Length of Stay Stay Efficiency Function Change Length of Stay Stay Efficiency Function Change Length of Stay EfficiencyPROVINCIAL AVERAGE 19.7 23.7 1.5 21.6 35.9 0.8 20.6 16.4 2.0Baycrest Centre for Geriatric Care Toronto 7 17.7 37.7 0.5 24.5 45.6 0.6 21.7 36.8 0.7Bluewater Health Sarnia 1 20.5 25.9 1.3 20.4 37.0 0.7 21.0 16.0 2.0Bridgepoint Health Toronto 7 25.4 31.3 1.3 23.0 52.4 0.5 26.4 24.5 1.5Chatham-Kent Health Alliance Chatham 1 18.9 21.4 1.2 18.6 33.7 0.9 20.7 17.4 1.4Cornwall Community <strong>Hospital</strong> Cornwall 11 16.2 36.3 0.5 17.6 48.3 0.4 16.2 31.8 0.5Grand River <strong>Hospital</strong> Kitchener 3 16.5 21.1 1.5 22.8 36.1 1.2 15.5 15.3 1.7Grey Bruce Health Services Owen Sound 2 22.4 29.9 0.9 25.0 36.5 0.8 19.6 15.2 1.5Guelph General <strong>Hospital</strong> Guelph 3 12.0 8.9 1.5 10.4 8.1 1.4 13.5 8.7 1.7Halton Healthcare Oakville 6 19.3 15.7 1.7 16.6 26.7 0.9 19.6 12.9 2.0Hamilton Health Sciences Corporation Hamilton 4 21.2 32.2 1.1 22.8 34.3 0.8 24.5 22.9 1.8Hôpital Montfort <strong>Hospital</strong> Ottawa 11 12.9 13.0 1.1 12.4 13.9 0.8 14.7 12.8 1.2Hôpital régional de SudburyRegional <strong>Hospital</strong>Sudbury 13 17.0 40.0 0.5 17.9 37.3 0.5 17.5 41.0 0.4Hôtel-Dieu Grace <strong>Hospital</strong> Windsor 1 19.4 7.5 3.4 11.9 8.2 1.6 24.2 6.0 4.8Humber River Regional <strong>Hospital</strong> Toronto 8 25.1 10.2 3.0 18.5 12.0 1.8 25.7 9.3 3.2Huron Perth Healthcare Alliance Stratford 2 22.6 32.4 1.2 22.0 46.5 0.8 25.7 22.5 1.7Joseph Brant Memorial <strong>Hospital</strong> Burlington 4 22.0 21.7 1.4 25.2 31.0 1.1 23.1 19.6 1.6Lakeridge Health Oshawa 9 27.8 33.1 1.5 32.6 52.6 0.8 27.7 21.7 2.2Leamington District Memorial <strong>Hospital</strong> Leamington 1 16.1 9.7 1.6 12.6 7.6 1.6 18.8 11.6 1.7Listowel and Wingham <strong>Hospital</strong>s Alliance Listowel 2 19.3 16.6 1.6 25.2 19.8 1.7 17.6 15.2 1.7Markham Stouffville <strong>Hospital</strong> Markham 8 15.3 12.4 1.6 19.6 22.0 1.2 14.1 9.5 1.7North Bay General <strong>Hospital</strong> North Bay 13 23.6 30.0 1.3 27.5 40.4 1.2 20.6 19.1 2.1North York General <strong>Hospital</strong> Toronto 8 16.8 15.6 1.2 12.8 11.5 1.2 18.7 14.6 1.5Northumberland Hills <strong>Hospital</strong> Cobourg 9 22.2 27.6 1.2 19.2 42.1 0.5 25.2 22.5 1.6Pembroke Regional <strong>Hospital</strong> Pembroke 11 24.2 26.1 1.4 24.9 30.5 1.1 24.1 23.9 1.8Penetanguishene General <strong>Hospital</strong> Inc. Penetangui-12 15.4 18.6 0.9 21.0 31.5 0.6 13.4 13.9 0.9(The)—North Simcoe <strong>Hospital</strong> Alliance shenePeterborough Regional Health Centre Peterborough 9 18.4 36.5 0.7 22.7 42.5 0.8 19.1 36.7 0.7Providence Continuing Care Centre Kingston 10 22.6 37.0 1.0 21.3 49.5 0.5 25.9 23.3 1.4Above-Average Performance Average Performance Below-Average PerformancePAGE 33