R E H A B I L I T A T I O N - Ontario Hospital Association
R E H A B I L I T A T I O N - Ontario Hospital Association R E H A B I L I T A T I O N - Ontario Hospital Association
SYSTEM INTEGRATION AND CHANGECommunityHospital Served LHINCoordination Coordination Coordinationand and andContinuity Continuity Continuity Evidenceof Care of Care of Care of Organiza-Interdisci- Evidence of Across Across Across Organiza- tionalplinary Client- the the the tional CommitmentHealthy Work Integration Centred Best Continuum Continuum Continuum Client- to StaffEnvironment of Care Care Practices —All RCGs —Total Stroke —Total Ortho Centredness DevelopmentPROVINCIAL AVERAGE 74.5 73.1 74.0 61.3 65.4 64.6 62.2 68.6 79.5Baycrest Centre for Geriatric Care Toronto 7 59.7 83.3 79.6 80.0 50.0 67.5 67.5 95.9 85.0Bluewater Health Sarnia 1 87.9 52.8 60.2 40.9 55.0 55.0 55.0 57.7 47.7Bridgepoint Health Toronto 7 94.5 82.8 100.0 64.9 68.8 68.8 68.8 67.9 81.6Chatham-Kent Health Alliance Chatham 1 75.6 47.9 38.9 73.8 55.0 55.0 55.0 84.1 69.1Cornwall Community Hospital Cornwall 11 79.5 69.7 70.4 48.4 82.5 100.0 100.0 81.3 81.6Grand River Hospital Kitchener 3 44.9 81.9 69.8 91.1 63.8 72.5 72.5 45.4 72.7Grey Bruce Health Services Owen Sound 2 89.6 78.0 38.0 40.0 91.3 91.3 32.5 53.4 87.5Guelph General Hospital Guelph 3 92.7 83.1 96.3 70.7 37.5 37.5 37.5 58.3 85.0Halton Healthcare Oakville 6 100.0 89.4 71.6 83.6 65.0 65.0 65.0 89.3 74.3Hamilton Health Sciences Corporation Hamilton 4 84.0 89.9 85.0 96.0 91.3 100.0 100.0 94.1 73.8Hôpital Montfort Hospital Ottawa 11 90.0 71.1 82.2 57.3 72.5 55.0 55.0 58.2 69.1Hôpital régional de Sudbury Regional Hospital Sudbury 13 38.2 84.4 87.1 66.7 81.3 90.0 90.0 55.9 73.0Hôtel-Dieu Grace Hospital Windsor 1 96.7 69.5 69.9 64.0 92.5 92.5 92.5 56.8 100.0Humber River Regional Hospital Toronto 8 96.4 62.6 83.4 48.0 56.3 23.8 17.5 66.3 92.9Huron Perth Healthcare Alliance Stratford 2 53.5 77.1 80.6 53.3 60.0 68.8 68.8 54.9 62.0Joseph Brant Memorial Hospital Burlington 4 64.3 73.9 73.7 70.7 30.0 30.0 30.0 61.4 77.9Lakeridge Health Oshawa 9 36.4 70.8 78.3 64.0 41.3 41.3 37.5 57.7 88.8Leamington District Memorial Hospital Leamington 1 62.3 59.9 69.9 24.0 30.0 30.0 30.0 61.6 60.7Listowel and Wingham Hospitals Alliance Listowel 2 33.5 44.0 55.1 72.0 51.3 60.0 60.0 41.9 54.8Markham Stouffville Hospital Markham 8 83.2 84.6 66.4 46.7 68.8 68.8 68.8 52.9 82.2North Bay General Hospital North Bay 13 18.0 35.6 43.7 16.0 63.8 63.8 63.8 47.9 69.1North York General Hospital Toronto 8 95.8 85.8 56.9 45.8 30.0 30.0 30.0 58.5 92.9Northumberland Hills Hospital Cobourg 9 95.9 85.1 83.3 72.4 65.0 82.5 82.5 70.2 76.3Pembroke Regional Hospital Pembroke 11 89.3 75.8 75.2 48.4 60.0 68.8 68.8 88.4 85.2Penetanguishene General Hospital Inc.(The)— North Simcoe Hospital AlliancePenetanguishene 12 97.1 70.8 75.0 68.0 56.3 65.0 65.0 85.0 69.1Peterborough Regional Health Centre Peterborough 9 68.9 50.8 68.4 44.0 67.5 42.5 50.0 71.6 73.2Providence Continuing Care Centre Kingston 10 96.6 95.3 77.8 82.7 72.5 81.3 63.8 95.9 85.0Providence Healthcare Toronto 7 74.7 91.9 79.2 39.1 51.3 60.0 27.5 85.3 83.9Above-Average Performance Average Performance Below-Average PerformancePAGE 16
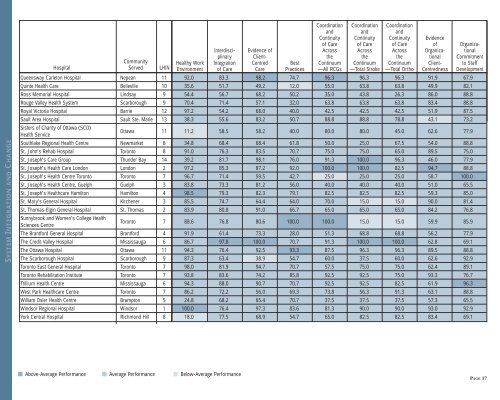
SYSTEM INTEGRATION AND CHANGECommunityHospital Served LHINCoordination Coordination Coordinationand and andContinuity Continuity Continuity Evidenceof Care of Care of Care of Organiza-Interdisci- Evidence of Across Across Across Organiza- tionalplinary Client- the the the tional CommitmentHealthy Work Integration Centred Best Continuum Continuum Continuum Client- to StaffEnvironment of Care Care Practices —All RCGs —Total Stroke —Total Ortho Centredness DevelopmentQueensway Carleton Hospital Nepean 11 92.0 83.3 98.2 74.7 96.3 96.3 96.3 91.9 67.9Quinte Health Care Belleville 10 35.6 51.7 49.2 12.0 55.0 63.8 63.8 49.9 82.1Ross Memorial Hospital Lindsay 9 54.4 56.7 68.2 50.2 35.0 43.8 26.3 86.0 88.8Rouge Valley Health System Scarborough 9 70.4 71.4 57.1 32.0 63.8 63.8 63.8 83.4 88.8Royal Victoria Hospital Barrie 12 97.2 54.2 68.0 40.0 42.5 42.5 42.5 51.9 87.5Sault Area Hospital Sault Ste. Marie 13 38.3 55.6 83.2 50.7 88.8 88.8 78.8 43.1 73.2Sisters of Charity of Ottawa (SCO)Health ServiceOttawa 11 11.2 58.5 58.2 40.0 80.0 80.0 45.0 62.6 77.9Southlake Regional Health Centre Newmarket 8 34.8 68.4 68.4 61.8 50.0 25.0 67.5 54.0 88.8St. John’s Rehab Hospital Toronto 8 91.0 76.3 83.5 70.7 75.0 75.0 65.0 89.5 75.0St. Joseph’s Care Group Thunder Bay 14 39.2 81.7 98.1 76.0 91.3 100.0 96.3 46.0 77.9St. Joseph’s Health Care London London 2 97.2 85.3 87.2 92.0 100.0 100.0 82.5 94.7 88.8St. Joseph’s Health Centre Toronto Toronto 7 96.7 71.4 59.5 42.7 25.0 25.0 25.0 58.7 100.0St. Joseph’s Health Centre, Guelph Guelph 3 83.8 73.3 81.2 56.0 40.0 40.0 40.0 51.0 65.5St. Joseph’s Healthcare Hamilton Hamilton 4 98.5 79.3 82.3 79.1 82.5 82.5 82.5 59.3 85.0St. Mary’s General Hospital Kitchener 3 85.5 74.7 64.4 64.0 70.0 15.0 15.0 90.0 81.4St. Thomas-Elgin General Hospital St. Thomas 2 83.9 80.8 91.0 66.7 65.0 65.0 65.0 84.2 76.8Sunnybrook and Women’s College HealthSciences CentreToronto 7 88.6 76.8 80.6 100.0 100.0 15.0 15.0 59.9 85.9The Brantford General Hospital Brantford 4 91.9 61.4 73.3 28.0 51.3 68.8 68.8 56.2 77.9The Credit Valley Hospital Mississauga 6 86.7 97.8 100.0 70.7 91.3 100.0 100.0 62.8 69.1The Ottawa Hospital Ottawa 11 94.3 76.4 92.5 93.3 87.5 96.3 96.3 89.5 88.8The Scarborough Hospital Scarborough 9 87.3 63.4 38.9 54.7 60.0 37.5 60.0 62.6 92.9Toronto East General Hospital Toronto 7 98.0 81.9 94.7 70.7 57.5 75.0 75.0 62.4 89.1Toronto Rehabilitation Institute Toronto 7 93.8 83.6 74.2 85.8 92.5 92.5 75.0 93.3 76.7Trillium Health Centre Mississauga 6 94.3 88.0 90.7 70.7 92.5 92.5 82.5 61.9 96.3West Park Healthcare Centre Toronto 7 86.2 72.2 56.0 69.3 73.8 56.3 91.3 63.1 88.8William Osler Health Centre Brampton 5 24.8 68.2 65.4 70.7 37.5 37.5 37.5 57.3 65.5Windsor Regional Hospital Windsor 1 100.0 76.4 97.3 83.6 81.3 90.0 90.0 93.0 92.9York Central Hospital Richmond Hill 8 18.0 77.5 68.9 54.7 65.0 82.5 82.5 83.4 69.1Above-Average Performance Average Performance Below-Average PerformancePAGE 17
- Page 1: HospitalReportR E H A B I L I T A T
- Page 5 and 6: A SNAPSHOT OF HOSPITAL ACTIVITYIN O
- Page 7 and 8: Table 2 depicts the total number of
- Page 9 and 10: “HIGH-PERFORMING” HOSPITALSHIGH
- Page 11 and 12: INTERPRETATION OF BOX PLOTS AND PER
- Page 13 and 14: SYSTEM INTEGRATION AND CHANGEINTEGR
- Page 15 and 16: SUMMARY OF RESULTS (CONT’D)SYSTEM
- Page 17 and 18: SUMMARY OF RESULTS (CONT’D)SYSTEM
- Page 19: PERFORMANCE ALLOCATION TABLEThe per
- Page 23 and 24: CLIENT PERSPECTIVESPERSPECTIVESThis
- Page 25 and 26: SUMMARY OF RESULTS (CONT’D)CLIENT
- Page 28 and 29: CLIENT PERSPECTIVESCommunityHospita
- Page 30 and 31: CLINICAL UTILIZATION AND OUTCOMESUT
- Page 32 and 33: SUMMARY OF RESULTSAll RCGsHospital-
- Page 34 and 35: SUMMARY OF RESULTS (CONT’D)CLINIC
- Page 36 and 37: SUMMARY OF RESULTS (CONT’D)CLINIC
- Page 38 and 39: 8CLINICAL UTILIZATION AND OUTCOMESP
- Page 40 and 41: FINANCIAL PERFORMANCE AND CONDITION
- Page 42 and 43: SUMMARY OF RESULTSFINANCIAL PERFORM
- Page 44 and 45: FINANCIAL PERFORMANCE AND CONDITION
- Page 46: APPENDIX A: DATA SOURCESThe followi
- Page 49: To download a copy of Hospital Repo
SYSTEM INTEGRATION AND CHANGECommunity<strong>Hospital</strong> Served LHINCoordination Coordination Coordinationand and andContinuity Continuity Continuity Evidenceof Care of Care of Care of Organiza-Interdisci- Evidence of Across Across Across Organiza- tionalplinary Client- the the the tional CommitmentHealthy Work Integration Centred Best Continuum Continuum Continuum Client- to StaffEnvironment of Care Care Practices —All RCGs —Total Stroke —Total Ortho Centredness DevelopmentQueensway Carleton <strong>Hospital</strong> Nepean 11 92.0 83.3 98.2 74.7 96.3 96.3 96.3 91.9 67.9Quinte Health Care Belleville 10 35.6 51.7 49.2 12.0 55.0 63.8 63.8 49.9 82.1Ross Memorial <strong>Hospital</strong> Lindsay 9 54.4 56.7 68.2 50.2 35.0 43.8 26.3 86.0 88.8Rouge Valley Health System Scarborough 9 70.4 71.4 57.1 32.0 63.8 63.8 63.8 83.4 88.8Royal Victoria <strong>Hospital</strong> Barrie 12 97.2 54.2 68.0 40.0 42.5 42.5 42.5 51.9 87.5Sault Area <strong>Hospital</strong> Sault Ste. Marie 13 38.3 55.6 83.2 50.7 88.8 88.8 78.8 43.1 73.2Sisters of Charity of Ottawa (SCO)Health ServiceOttawa 11 11.2 58.5 58.2 40.0 80.0 80.0 45.0 62.6 77.9Southlake Regional Health Centre Newmarket 8 34.8 68.4 68.4 61.8 50.0 25.0 67.5 54.0 88.8St. John’s Rehab <strong>Hospital</strong> Toronto 8 91.0 76.3 83.5 70.7 75.0 75.0 65.0 89.5 75.0St. Joseph’s Care Group Thunder Bay 14 39.2 81.7 98.1 76.0 91.3 100.0 96.3 46.0 77.9St. Joseph’s Health Care London London 2 97.2 85.3 87.2 92.0 100.0 100.0 82.5 94.7 88.8St. Joseph’s Health Centre Toronto Toronto 7 96.7 71.4 59.5 42.7 25.0 25.0 25.0 58.7 100.0St. Joseph’s Health Centre, Guelph Guelph 3 83.8 73.3 81.2 56.0 40.0 40.0 40.0 51.0 65.5St. Joseph’s Healthcare Hamilton Hamilton 4 98.5 79.3 82.3 79.1 82.5 82.5 82.5 59.3 85.0St. Mary’s General <strong>Hospital</strong> Kitchener 3 85.5 74.7 64.4 64.0 70.0 15.0 15.0 90.0 81.4St. Thomas-Elgin General <strong>Hospital</strong> St. Thomas 2 83.9 80.8 91.0 66.7 65.0 65.0 65.0 84.2 76.8Sunnybrook and Women’s College HealthSciences CentreToronto 7 88.6 76.8 80.6 100.0 100.0 15.0 15.0 59.9 85.9The Brantford General <strong>Hospital</strong> Brantford 4 91.9 61.4 73.3 28.0 51.3 68.8 68.8 56.2 77.9The Credit Valley <strong>Hospital</strong> Mississauga 6 86.7 97.8 100.0 70.7 91.3 100.0 100.0 62.8 69.1The Ottawa <strong>Hospital</strong> Ottawa 11 94.3 76.4 92.5 93.3 87.5 96.3 96.3 89.5 88.8The Scarborough <strong>Hospital</strong> Scarborough 9 87.3 63.4 38.9 54.7 60.0 37.5 60.0 62.6 92.9Toronto East General <strong>Hospital</strong> Toronto 7 98.0 81.9 94.7 70.7 57.5 75.0 75.0 62.4 89.1Toronto Rehabilitation Institute Toronto 7 93.8 83.6 74.2 85.8 92.5 92.5 75.0 93.3 76.7Trillium Health Centre Mississauga 6 94.3 88.0 90.7 70.7 92.5 92.5 82.5 61.9 96.3West Park Healthcare Centre Toronto 7 86.2 72.2 56.0 69.3 73.8 56.3 91.3 63.1 88.8William Osler Health Centre Brampton 5 24.8 68.2 65.4 70.7 37.5 37.5 37.5 57.3 65.5Windsor Regional <strong>Hospital</strong> Windsor 1 100.0 76.4 97.3 83.6 81.3 90.0 90.0 93.0 92.9York Central <strong>Hospital</strong> Richmond Hill 8 18.0 77.5 68.9 54.7 65.0 82.5 82.5 83.4 69.1Above-Average Performance Average Performance Below-Average PerformancePAGE 17


