R E H A B I L I T A T I O N - Ontario Hospital Association
R E H A B I L I T A T I O N - Ontario Hospital Association
R E H A B I L I T A T I O N - Ontario Hospital Association

Create successful ePaper yourself
Turn your PDF publications into a flip-book with our unique Google optimized e-Paper software.
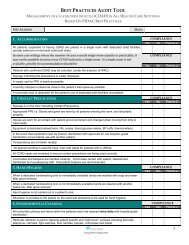
SYSTEM INTEGRATION AND CHANGECommunity<strong>Hospital</strong> Served LHINCoordination Coordination Coordinationand and andContinuity Continuity Continuity Evidenceof Care of Care of Care of Organiza-Interdisci- Evidence of Across Across Across Organiza- tionalplinary Client- the the the tional CommitmentHealthy Work Integration Centred Best Continuum Continuum Continuum Client- to StaffEnvironment of Care Care Practices —All RCGs —Total Stroke —Total Ortho Centredness DevelopmentPROVINCIAL AVERAGE 74.5 73.1 74.0 61.3 65.4 64.6 62.2 68.6 79.5Baycrest Centre for Geriatric Care Toronto 7 59.7 83.3 79.6 80.0 50.0 67.5 67.5 95.9 85.0Bluewater Health Sarnia 1 87.9 52.8 60.2 40.9 55.0 55.0 55.0 57.7 47.7Bridgepoint Health Toronto 7 94.5 82.8 100.0 64.9 68.8 68.8 68.8 67.9 81.6Chatham-Kent Health Alliance Chatham 1 75.6 47.9 38.9 73.8 55.0 55.0 55.0 84.1 69.1Cornwall Community <strong>Hospital</strong> Cornwall 11 79.5 69.7 70.4 48.4 82.5 100.0 100.0 81.3 81.6Grand River <strong>Hospital</strong> Kitchener 3 44.9 81.9 69.8 91.1 63.8 72.5 72.5 45.4 72.7Grey Bruce Health Services Owen Sound 2 89.6 78.0 38.0 40.0 91.3 91.3 32.5 53.4 87.5Guelph General <strong>Hospital</strong> Guelph 3 92.7 83.1 96.3 70.7 37.5 37.5 37.5 58.3 85.0Halton Healthcare Oakville 6 100.0 89.4 71.6 83.6 65.0 65.0 65.0 89.3 74.3Hamilton Health Sciences Corporation Hamilton 4 84.0 89.9 85.0 96.0 91.3 100.0 100.0 94.1 73.8Hôpital Montfort <strong>Hospital</strong> Ottawa 11 90.0 71.1 82.2 57.3 72.5 55.0 55.0 58.2 69.1Hôpital régional de Sudbury Regional <strong>Hospital</strong> Sudbury 13 38.2 84.4 87.1 66.7 81.3 90.0 90.0 55.9 73.0Hôtel-Dieu Grace <strong>Hospital</strong> Windsor 1 96.7 69.5 69.9 64.0 92.5 92.5 92.5 56.8 100.0Humber River Regional <strong>Hospital</strong> Toronto 8 96.4 62.6 83.4 48.0 56.3 23.8 17.5 66.3 92.9Huron Perth Healthcare Alliance Stratford 2 53.5 77.1 80.6 53.3 60.0 68.8 68.8 54.9 62.0Joseph Brant Memorial <strong>Hospital</strong> Burlington 4 64.3 73.9 73.7 70.7 30.0 30.0 30.0 61.4 77.9Lakeridge Health Oshawa 9 36.4 70.8 78.3 64.0 41.3 41.3 37.5 57.7 88.8Leamington District Memorial <strong>Hospital</strong> Leamington 1 62.3 59.9 69.9 24.0 30.0 30.0 30.0 61.6 60.7Listowel and Wingham <strong>Hospital</strong>s Alliance Listowel 2 33.5 44.0 55.1 72.0 51.3 60.0 60.0 41.9 54.8Markham Stouffville <strong>Hospital</strong> Markham 8 83.2 84.6 66.4 46.7 68.8 68.8 68.8 52.9 82.2North Bay General <strong>Hospital</strong> North Bay 13 18.0 35.6 43.7 16.0 63.8 63.8 63.8 47.9 69.1North York General <strong>Hospital</strong> Toronto 8 95.8 85.8 56.9 45.8 30.0 30.0 30.0 58.5 92.9Northumberland Hills <strong>Hospital</strong> Cobourg 9 95.9 85.1 83.3 72.4 65.0 82.5 82.5 70.2 76.3Pembroke Regional <strong>Hospital</strong> Pembroke 11 89.3 75.8 75.2 48.4 60.0 68.8 68.8 88.4 85.2Penetanguishene General <strong>Hospital</strong> Inc.(The)— North Simcoe <strong>Hospital</strong> AlliancePenetanguishene 12 97.1 70.8 75.0 68.0 56.3 65.0 65.0 85.0 69.1Peterborough Regional Health Centre Peterborough 9 68.9 50.8 68.4 44.0 67.5 42.5 50.0 71.6 73.2Providence Continuing Care Centre Kingston 10 96.6 95.3 77.8 82.7 72.5 81.3 63.8 95.9 85.0Providence Healthcare Toronto 7 74.7 91.9 79.2 39.1 51.3 60.0 27.5 85.3 83.9Above-Average Performance Average Performance Below-Average PerformancePAGE 16