Vehicle control and drowsiness - VTI
Vehicle control and drowsiness - VTI
Vehicle control and drowsiness - VTI
- No tags were found...

Create successful ePaper yourself
Turn your PDF publications into a flip-book with our unique Google optimized e-Paper software.
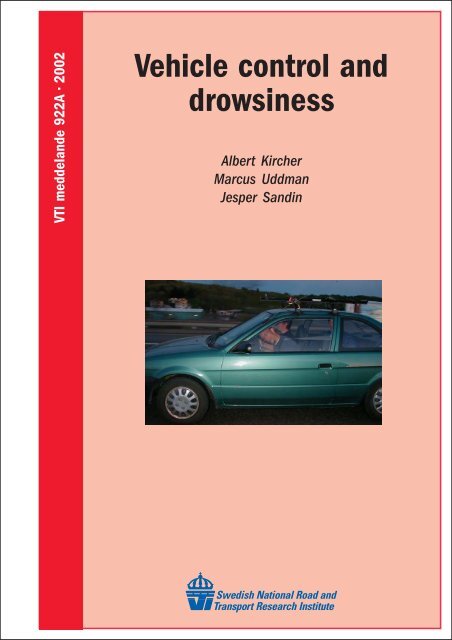
<strong>VTI</strong> meddel<strong>and</strong>e 922A • 2002<strong>Vehicle</strong> <strong>control</strong> <strong>and</strong><strong>drowsiness</strong>Albert KircherMarcus UddmanJesper S<strong>and</strong>in
<strong>VTI</strong> meddel<strong>and</strong>e 922A · 2002<strong>Vehicle</strong> <strong>control</strong> <strong>and</strong> <strong>drowsiness</strong>Albert Kircher, <strong>VTI</strong>Marcus Uddman, Jesper S<strong>and</strong>in, Virtual Technology
Publisher:Publication:<strong>VTI</strong> Meddel<strong>and</strong>e 922APublished:2002Project code:40409SE-581 95 Linköping SwedenProject:<strong>Vehicle</strong> Control <strong>and</strong> DrowsinessAuthor:Albert Kircher, <strong>VTI</strong>Marcus Uddman, Virtual TechnologyJesper S<strong>and</strong>in, Virtual TechnologySponsor:Autoliv ResearchTitle:<strong>Vehicle</strong> Control <strong>and</strong> DrowsinessAbstractThe report consists of two parts. The first part is a literature study aimed at identifying the mostrelevant indicators for predicting <strong>and</strong> detecting fatigue induced impaired driving. The aim was toidentify possible performance based technologies, such as the lateral <strong>control</strong> of the car. Thus, lessattention was devoted to e.g. psycho-physiological measures like EEG. A large number of researchreports describing various approaches have been reviewed. The survey clearly indicates that nosingle indicator can be used to detect drowsy driving. A combination of different measures isrecommended e.g. analysis of lateral <strong>control</strong> performance <strong>and</strong> eye blink pattern. Furthermore, itshould be noted that so far there is no commercial system available that provides a sufficientlyreliable method to detect a drowsy driver. In the second part, experimental data from previousdriving simulator experiments were analysed by means of signal processing <strong>and</strong> statisticalanalyses. Specific attention was paid to investigate the potential of lateral vehicle position data as amean to estimate driver <strong>drowsiness</strong>. The analysis of experimental data did not reveal any clearanswer to what indicators are the most prominent with respect to detect drowsy driving behaviour.Further investigations <strong>and</strong> analyses of driving behaviour data are needed. However, the dataanalysis conforms in large to the findings in the literature survey.ISSN: Language: No. of pages:0347-6049 English 84 + 4 Appendices
Utgivare:Publikation:<strong>VTI</strong> Meddel<strong>and</strong>e 922AUtgivningsår:2002Projektnummer:40409581 95 Linköping Projektnamn:Fordonskontroll och trötthetFörfattare:Albert Kircher, <strong>VTI</strong>Marcus Uddman, Virtual TechnologyJesper S<strong>and</strong>in, Virtual TechnologyUppdragsgivare:Autoliv ResearchTitel:Fordonskontroll och trötthetReferatDen här rapporten består av två delar. Den första delen är en litteraturstudie med syfte attidentifiera de mest relevanta mått som kan användas för att predicera och detektera farligtkörbeteende som beror på trötthet. Målsättningen begränsades till att försöka identifiera mått påkörprestation t.ex. lateral kontroll (styrbeteende). Således har mindre uppmärksamhet ägnats ått.ex. psykofysiologiska mått som EEG. Ett stort antal forskningsrapporter som beskriver olikaangreppssätt har granskats och refereras i rapporten. Studien visar tydligt att det inte finns någonunik indikator som kan användas isolerat för att detektera trötta förare. Istället rekommenderas attman kombinerar olika mått som t.ex. styrprestation (hur bra föraren följer vägen) och förarens"blinkbeteende". Vidare kan man konstatera att det idag inte finns något kommersiellt system somanvänder en tillräckligt tillförlitlig metod att detektera trötta förare. I den <strong>and</strong>ra delen av rapportenpresenteras olika analyser av data från tidigare "trötthetsstudier" i körsimulator med hjälp avsignalbeh<strong>and</strong>ling och statistiska metoder. Speciellt har analysen koncentrerats på att undersökapotentialen i att använda positionsdata för fordonet för att detektera trötthetsrelaterat körbeteende.Analysen gav emellertid inte några klara svar på vilka indikatorer som lämpar sig bäst i dettasammanhang. Ytterligare undersökningar och analyser av körbeteende under trötthetsbetingelser ärnödvändiga. Emellertid överensstämmer resultatet från dataanalysen i stora drag med det som komfram i litteraturstudien.ISSN: Språk: Antal sidor:0347-6049 Engelska 84 + 4 Bilagor
ForewordThis study was commissioned by Autoliv Research AB [1] <strong>and</strong> carried out by theSwedish National Road <strong>and</strong> Transport Research Institute, <strong>VTI</strong> [2] (literature surveypart) <strong>and</strong> by Virtual Technology [3] (data analysis part). It was carried out in theperiod June–September 2001. Project leader at <strong>VTI</strong> was Björn Peters.The report consists of two parts. The first part is a literature study aimed atidentifying the most relevant parameters for the prediction <strong>and</strong> detection offatigue <strong>and</strong> <strong>drowsiness</strong> in drivers. Special focus was put on vehicle basedperformance technologies, such as lateral position variability of the car. In thesecond part experimental data from previous driving simulator experiments wereanalysed by means of signal processing <strong>and</strong> statistical analyses. Specific attentionwas paid to investigate the potential of lateral vehicle position data as a mean toestimate driver <strong>drowsiness</strong>. The report concentrates on measures <strong>and</strong> methods thatcan be used to detect <strong>and</strong> possibly predict <strong>drowsiness</strong>, fatigue or the resulting stateof impaired driving performance in real time <strong>and</strong> in an automated manner, thuse.g. subjective <strong>and</strong> physiological methods are only briefly considered here.Linköping, May 2002Björn Peters1 www.autoliv.se2 www.vti.se3 www.virtualtechnology.se<strong>VTI</strong> meddel<strong>and</strong>e 922A
AcknowledgementThis report was produced under a contract with Autoliv Research. We would liketo express our gratitude to Jan-Erik Källhammer at Autoliv Research who hassupported the work not just financially but also provided very valuable feedback<strong>and</strong> guiding ideas for the production of this report.<strong>VTI</strong> meddel<strong>and</strong>e 922A
ContentPageSummary 7Sammanfattning 9Part one: Literature Study 111 Introduction 111.1 Exposure to accidents due to <strong>drowsiness</strong> (statistics) 121.2 Individual driving behaviour <strong>and</strong> incompleteness of onesingle measure of fatigue 121.3 Validation 131.4 Day <strong>and</strong> night driving 131.5 Requirements for <strong>drowsiness</strong> warning systems 141.6 Means of research 142 Terms <strong>and</strong> definitions 153 Variables looked at to detect <strong>drowsiness</strong> 164 Methods to identify <strong>drowsiness</strong> in drivers 174.1 Physiological measures 174.2 Ocular dynamics 184.3 Steering wheel movements <strong>and</strong> steering wheel variability 204.4 Lateral position 224.5 Time-to-line crossing (TLC) 294.6 Combination of different methods 325 Commercially available fatigue monitors 355.1 SAM 355.2 DAS 2000 Road Alert System 365.3 SafeTRAC 365.4 TravAlert 365.5 Companies that are planning to introduce <strong>drowsiness</strong> orfatigue detection <strong>and</strong> warning systems in vehicles 376 Patents 387 Problems related to automatic <strong>drowsiness</strong> detection 397.1 Detecting vs. predicting <strong>drowsiness</strong> 397.2 Gender <strong>and</strong> age of the driver 397.3 Overtaking <strong>and</strong> road curvature 408 Further literature of interest 419 Summary 429.1 Eyelid closure 429.2 Brain activity – EEG 429.3 Other physiological measures 439.4 Driving performance measures 439.5 Observations of body motions 439.6 Mathematical models 43<strong>VTI</strong> meddel<strong>and</strong>e 922A
Part two: Data Analysis 4610 The “Hök” project 4611 Analysis of <strong>drowsiness</strong> rating 5112 Analysis of the st<strong>and</strong>ard deviation of the lateralposition (SDLP) 5212.1 Regression analysis 5413 Analysis of the mean value of the lateral position 5814 Times driver change direction 5915 Time to line crossing – TLC 6016 Frequency Analysis 6516.1 Fast Fourier Transform 6516.2 Power Spectrum estimate via Burg's method 7116.3 Power Spectrum estimate via MUSIC eigenvector method 7116.4 Short time frequency transform 7117 The “SAVE” project 7217.1 Analysis of progression in time before driving off the road 7218 Summary 7418.1 Drowsiness rating 7418.2 SDLP – St<strong>and</strong>ard Deviation of the Lateral Position 7418.3 Lateral position 7418.4 Time to Line Crossing – TLC 7518.5 Spectral analysis of Lateral Position 7518.6 Possible measures 7519 References 77Appendices:Appendix 1:Appendix 2:Appendix 3:Appendix 4:TLC formulaeTLC calculationSearch methodsDefinition of terms used in the report<strong>VTI</strong> meddel<strong>and</strong>e 922A
<strong>Vehicle</strong> Control <strong>and</strong> Drowsinessby Albert Kircher, Marcus Uddman <strong>and</strong> Jesper S<strong>and</strong>inSummaryCurrently there are no simple <strong>and</strong> reliable drivingbehaviour measures that can be used to detectdrowsy driversIt is known that drivers' <strong>drowsiness</strong> <strong>and</strong> fatigue is accompanied bydeteriorated vehicle <strong>control</strong>. We investigated which factors are possible touse for the prediction <strong>and</strong> detection of fatigue induced impaired driving. Inthis study focus was on variables directly related to lateral <strong>control</strong> <strong>and</strong>steering behaviour aiming at a method capable of detection <strong>and</strong> prediction ofimpaired driving performance in real time <strong>and</strong> in an automated manner.Psycho-physiological variables, subjective rating scales, etc. are only brieflydiscussed.The first part of the report is a literature study. It served to examine the availableknowledge in the field <strong>and</strong> to identify the most promising indicators of impaireddriving. A large number of publications describing various approaches have beenreviewed. The survey clearly indicates that no single indicator can be used toreliably detect drowsy driving. A combination of different measures isrecommended, e.g. analysis of lateral <strong>control</strong> performance <strong>and</strong> eye blink patterns.Furthermore, it should be noted that even though there are a small number ofcommercial <strong>drowsiness</strong> detection systems available, no system provides asufficiently reliable <strong>and</strong> scientifically proven method to detect a drowsy driver.In the second part of the report experimental data from previous drivingsimulator experiments were analysed. Signal processing techniques, such asfrequency analysis by means of Fourier transforms, <strong>and</strong> statistical analyses wereused to disclose if data could be used to determine drivers' <strong>drowsiness</strong> as rated onsubjective rating scales (Karolinska Sleepiness Scale). Specific attention was paidto investigate the potential of lane <strong>control</strong> data (steering performance) as a meanto estimate driver <strong>drowsiness</strong>. Measures related to lateral vehicle position, such astime to line crossing <strong>and</strong> deviation of lateral position, were also analysed, butwere not found useful. The analysis of experimental data did not reveal any clearanswer to what driver behaviour indicators are the most prominent to detectdrowsy driving behaviour.However, the data analysis conforms in large to the findings in the literaturesurvey: a single variable is hardly usable as <strong>drowsiness</strong> predictor. More advancedsignal processing techniques could be more proficient for the aspired goal. Furtherinvestigations <strong>and</strong> analyses of driving behaviour data are needed. Combination ofdifferent variables, such as eye blink patterns <strong>and</strong> lane <strong>control</strong> measures, areexpected to be more successful.<strong>VTI</strong> meddel<strong>and</strong>e 922A 7
Fordonskontroll och trötthetav Albert Kircher, Marcus Uddman och Jesper S<strong>and</strong>inSammanfattningDet saknas enkla och tillförlitliga körbeteendemåttför att identifiera trötta förareDet är känt att sömnighet och trötthet sammanfaller med att förare har försämradkontroll över fordonet. Vi undersökte vilka faktorer som skullekunna vara möjliga att använda för att förutsäga och upptäcka försämradfordonskontroll och som beror på att föraren är trött. I denna undersökningfokuserades på variabler som direkt relaterades till lateral kontroll och styrbeteende.Siktet var inställt på en metod som skulle kunna predicera ochdetektera nedsatt körprestation i realtid och på ett automatiserat sätt. Psykofysiologiskamått, subjektiva skattningsskalor etc. tas bara kortfattat upp idenna studie.Rapportens första del är en litteraturstudie. Syftet med denna är att ge en överblicköver den tillgängliga domänkunskapen och ett försök att identifiera de mestlov<strong>and</strong>e indikatorerna på nedsatt körbeteende. Ett stort antal publikationer sombeskriver olika angreppssätt har granskats. Kartläggningen visar tydligt att det intefinns unika indikatorer som kan användas isolerat för att tillförlitligt detekteranedsatt körbeteende som beror på att föraren är trött. En kombination av olikamått rekommenderas, t.ex. analys av lateral kontroll och blinkbeteende. På marknadenfinns ett fåtal kommersiella system för att detektera trötthet, men inget avdessa system erbjuder en tillräckligt tillförlitlig och vetenskapligt beprövad metodför att detektera en trött förare.I den <strong>and</strong>ra delen av rapporten redovisas en analys av kördata från tidigareförsök i körsimulator. Signalbeh<strong>and</strong>lingsmetoder som frekvensanalys med hjälpav Fouriertransformationer och statistiska analyser genomfördes med syfte attundersöka om data gick att använda för att detektera trötthetstillstånd som skattatsmed hjälp av en subjektiv skattningsskala (Karolinska Sleepiness Scale). Specielltundersöktes potentialen i att använda data som beskriver lateral kontroll (styrningen)som ett sätt att mäta förarens trötthet. Mått som relaterade till lateralposition, t.ex. tid till linjeöverskridning (time to line crossing) och st<strong>and</strong>ardavvikelseför lateral position, prövades men inget av dessa mått befanns varaanvändbart. Analysen av experimentella data gav inga klara svar på vilka körbeteendevariabler/måttsom är mest lov<strong>and</strong>e för att detektera trötthet hos föraren.Analysresultaten sammanfaller således med det man fann i litteraturstudien:Det finns inget unikt mått som kan användas isolerat i syfte att detektera trötthetstillståndtillräckligt tillförlitligt. En mer avancerad signalbeh<strong>and</strong>lingsteknikskulle kunna ge ett bättre resultat. Ytterligare undersökningar och analyser av dataär nödvändiga. Kombinationer av olika mått som ögonblinkssmått tillsammansmed mått på lateral kontroll (styrning) har bättre förutsättningar att ge ett tillräckligtbra resultat.<strong>VTI</strong> meddel<strong>and</strong>e 922A 9
Part one: Literature Study1 IntroductionLoss of driver alertness is almost always preceded by psycho-physiological <strong>and</strong>/orperformance changes [1, 2]; these changes are the reason that it is possible todetect onset of <strong>drowsiness</strong> associated with loss of alertness in drivers.The basic idea behind vehicle-based detection is to monitor the driverunobtrusively by means of an on-board system that can detect when the driver isimpaired by <strong>drowsiness</strong>. The concept involves sensing various driver-relatedvariables (such as physiological measures) <strong>and</strong> driving-related variables (drivingperformance measures), computing measures from these variables on-line, <strong>and</strong>then using the measures separately or in a combined manner to detect when<strong>drowsiness</strong> is occurring, <strong>and</strong> more important to predict the onset of <strong>drowsiness</strong>.Measures are combined because no single unobtrusive operational measureappears adequate in reliably detecting <strong>drowsiness</strong> [3].It is important to point out the distinction between prediction <strong>and</strong> detection of<strong>drowsiness</strong>. Clearly the prediction is the main aim, since at the detection point,drowsy driving may already have led to a potentially hazardous situation or evenan accident. Another aspect is the great inter-individual variability in driver <strong>and</strong>driving behaviour, which an eventual automated system must be able to h<strong>and</strong>le.The second main part of this report consists of analyses of driving data. Thepurpose of data <strong>and</strong> statistical analysis was to analyse the lateral position <strong>and</strong>compare it to estimated <strong>drowsiness</strong>. The only data available was the lateralposition. No other data such as steering wheel angle or velocity variation wasavailable. The main variables focused on were: frequency of lateral position,amplitude variations in lateral position <strong>and</strong> time-to-line crossing.Main goal of the reportIdentify the most relevant parameters for the identification of <strong>drowsiness</strong> indrivers. Focus is on relationships between <strong>drowsiness</strong> <strong>and</strong> vehicle basedperformance technologies such as lateral position variability of the car. Thepossible techniques to identify <strong>drowsiness</strong> are of interest as well.This report will not treat:• how to make use of the results of <strong>drowsiness</strong> detection techniques (forexample how to warn or alert a driver);• legal <strong>and</strong> ethical issues related to <strong>drowsiness</strong> detection;• <strong>drowsiness</strong> detection in other areas than passenger vehicles (here the primaryfocus is on cars, although trucks are examined as well);• readiness-to-perform <strong>and</strong> fitness-for-duty prior to driving technologies;• mathematical models of sleep-alertness dynamics (models that predictoperator alertness/performance based on interactions of sleep, circadian, <strong>and</strong>related temporal antecedents of fatigue <strong>and</strong> predict performance capabilityover a period of time <strong>and</strong> when future periods of increased fatigue/sleepinesswill occur);<strong>VTI</strong> meddel<strong>and</strong>e 922A 11
1.1 Exposure to accidents due to <strong>drowsiness</strong> (statistics)Driver fatigue is estimated to cause 3.2 % of the traffic accidents (source: TrafficSafety Facts 1999 Annual Report, available athttp://www.nhtsa.dot.gov/people/ncsa/809-100.pdf). Other authors found that upto 10 % of all traffic accidents <strong>and</strong> up to 25 % of single-vehicle accidents arerelated to fatigue [4, 5].In the USA cost of fatigue related crashes: NHTSA estimates that vehiclecrashes due to driver fatigue cost Americans $12.5 billion per year in reducedproductivity <strong>and</strong> property loss, <strong>and</strong> 1500 lives [6].According to Knipling <strong>and</strong> Wierwille [3] 96 % of drowsy driver crashes involvecars <strong>and</strong> 3 % involve trucks. For trucks, however, the expected number ofinvolvements per vehicle life cycle is about four times greater than for cars; this isdue to the longer operational lives <strong>and</strong> higher mileage per year. Truck accidentsare more damaging. Most accidents occur on highways, caused by men (77 %)less than 30 years of age (62 %). (Data: US National Highway Traffic SafetyAdministration 1992).In the USA, recent estimates of the proportion of accidents in which fatigue or<strong>drowsiness</strong> were involved, range from 1.2–1.6 % for all police-reported accidents[7] to 3.2 % of the fatal crashes [8]. UK estimates are essentially similar, 1.7 %<strong>and</strong> 2.5 %, respectively [9]. Estimates of fatigue <strong>and</strong> <strong>drowsiness</strong> involvement inaccidents are consistently higher when based on ‘in-depth’ accident investigationsor on clinical studies. From 1–4 % involvement rate estimated from general policedatabases, the figures rise to 10–25 % or even higher [10].The increasing interest in methods to detect <strong>drowsiness</strong> in drivers originatespartly in the high cost in terms of money <strong>and</strong> lives that accidents attributed to<strong>drowsiness</strong> cause. Furthermore there is an increased interest from car manufacturesto offer in-car techniques that make driving safer.1.2 Individual driving behaviour <strong>and</strong> incompleteness ofone single measure of fatigueIt is well known that each driver has individual driving behaviour. This factcauses problems in the automatic recognition of <strong>drowsiness</strong> through measurementof parameters such as lateral position. Furthermore it is not seen as sufficient touse one single parameter to detect <strong>drowsiness</strong> in drivers. Renner <strong>and</strong> Mehring [19,page 1] state that: ”With ongoing research it became evident that lane departurewarning <strong>and</strong> lane position parameters reflect only one facet of the performancedecrements within fatigued drivers. A fatigued driver can actually keep his vehicleperfectly in the lane, provided the vehicle heading is coincidentally appropriatefor the road curvature ahead. In our studies we found evidence for intentionalshort „naps“ on straight road sections, on which the vehicle path was perfect, butthe driver was incapable to react upon any unexpected event (e.g. front endcollision). In order to prevent these dangerous situations of „good“ lateral<strong>control</strong> without reaction readiness, a more complex <strong>drowsiness</strong> detectiontechnique had to be developed.”12 <strong>VTI</strong> meddel<strong>and</strong>e 922A
1.3 ValidationA relevant problem in <strong>drowsiness</strong> detection is the validation of a potentialtechnology or methodology; in other words: what to validate the (new) technologyagainst, or what is the criterion available. Another difficulty is the adequacy of thevalidation data (what is acceptable validation, what is the safe level of the fatigueindex?) [11].A representation formalism widely utilized to define the performance of a testin general is represented in table 1.Table 1 Contingency table for sensitivity <strong>and</strong> specificity calculation.Driver drowsyDriver alertSystem alarms True Positive (TP) False Positive (FP) Total tested drowsySystem alarms notFalse Negative(FN)True Negative (TN)Total tested alertTotal drowsyTotal alertThe contingency table (also referred as generalized payoff matrix or true signaldetection) is representative for the quality of the adopted analyses or of the useddetection system.In our case, sensitivity is the percentage of all drowsy drivers that are detectedas drowsy by the system.Sensitivity (%)= TP/(TP+FN) * 100 % = P(T|D),where T=test (system) <strong>and</strong> D=drowsySpecificity is the percentage of all alert drivers that are detected as alert by thesystem.Specificity (%)=TN/(TN+FP) * 100 % = P(¬T|¬D).Ideally, all drivers that are driving drowsy have to be detected by the system, <strong>and</strong>no driver which is not driving drowsy has to be identified as drowsy, thus asystem that aims at predicting <strong>drowsiness</strong> should have a high sensitivity as well asa high specificity, however to obtain both is very difficult. It could be argued thatfor the “performance” of the systems it is more important to really detect alldrowsy drivers (high sensitivity); on the other h<strong>and</strong> the acceptance of a systemwould be poor if alert drivers are alarmed since judged drowsy by the system. Atrade-off will have to be found, also considering the technical, legal <strong>and</strong> ethicalimplications of this thematic.1.4 Day <strong>and</strong> night drivingNight driving is more associated with fatigue related accidents than day driving[12]. This effect is biologically intrinsic to human physiology, additionally nightdriving prolongs the time a driver is sleepless <strong>and</strong> shortens the sleep time [95, 32].The study by Wylie et al. [32] even concluded that time of day was a far betterpredictor of decreased driving performance than time on task or cumulativenumber of trips.<strong>VTI</strong> meddel<strong>and</strong>e 922A 13
1.5 Requirements for <strong>drowsiness</strong> warning systemsThe most important requirements for <strong>drowsiness</strong> prediction <strong>and</strong>/or detectionsystems are:1. real time measurement,2. be unobtrusive <strong>and</strong> have no physical contact with the driver,3. not cause harmful emissions,4. not include moving parts,5. detect <strong>drowsiness</strong> prior to occurrence of critical performance failure.Renner <strong>and</strong> Mehring [19], who were doing research on automated <strong>drowsiness</strong>detection systems for Daimler Benz, state that: “A clear directive for a ready tomarket product is „never bother the driver“. For a successful warning system it isnot feasible to expect the driver to wire him-/herself with electrodes or sensorsevery time she/he goes on the road, thus a non-obtrusive monitoring system wasthe goal.”1.6 Means of researchThe methods, search engines <strong>and</strong> search terms used for the present literaturereview are summarized in appendix 3.14 <strong>VTI</strong> meddel<strong>and</strong>e 922A
2 Terms <strong>and</strong> definitions“Fatigue: specific form of human inadequacy in which the individual experiencesan aversion to exertion <strong>and</strong> feels unable to carry on [13].”Fatigue is not the same as <strong>drowsiness</strong>, but the desire to sleep may accompanyfatigue. Fatigue represents a normal <strong>and</strong> important response to physical exertion,emotional stress, or lack of sleep. Fatigue can also be a non-specific symptom of apsychological or physiological disorder. Drowsiness is the excessive daytimesleepiness (without a known cause), which can suggest the presence of asignificant sleep disorder <strong>and</strong> is different from fatigue. [14, 15]. It has to be saidthat there is a lack of an agreed <strong>and</strong> distinct definition of fatigue <strong>and</strong> <strong>drowsiness</strong>[16], <strong>and</strong> that different authors have different opinions on the theme; a distinctionbetween physiological <strong>and</strong> psychological factors contributing to fatigue is alsorare [17].Note:Trötthet → fatigueSömnighet → <strong>drowsiness</strong> (sometimes used synonymously with fatigue)sidolägesvariation → lateral position variation or variabilitySidoläge → lateral placement or lateral positionIn this literature review the term <strong>drowsiness</strong> is used to refer to the state of reducedalertness, usually accompanied by performance <strong>and</strong> psycho physiologicalchanges, which may result in loss of alertness or being “asleep at the wheel”.Definitions of terms used in the reportFor a definition of the terms amplitude, frequency, time-to-line crossing, relativelateral position, absolute lateral position, steering wheel variability, root meansquare error of the lateral position, st<strong>and</strong>ard deviation of lateral position (SDLP)see appendix 4.<strong>VTI</strong> meddel<strong>and</strong>e 922A 15
3 Variables looked at to detect <strong>drowsiness</strong>Since the literature study focused on methods to automatically detect <strong>drowsiness</strong>,the following variables were of main interest: time-to-line crossing, lateralposition of the car <strong>and</strong> related measures, steering wheel measures (see also definitionsin appendix 4). Other measurement variables of possible interest are:longitudinal position deviation, eye blink frequency, physiological variables, <strong>and</strong>driving performance measures (other than lateral position).16 <strong>VTI</strong> meddel<strong>and</strong>e 922A
4 Methods to identify <strong>drowsiness</strong> in drivers4.1 Physiological measuresPhysiological measures have been frequently used to detect <strong>drowsiness</strong>. The mostpromising measures are electroencephalogram measures (EEG) aimed at detectingbrain waves typical for fatigue. There is good evidence that rising alpha (8–11Hz)<strong>and</strong> theta (4–7 Hz) EEG activities indicate increasing sleepiness <strong>and</strong> thus thepotential for lapses in attention <strong>and</strong> behaviour [18].Renner <strong>and</strong> Mehring [19] used EEG <strong>and</strong> eye parameters to capture driverimpairment (mainly caused by fatigue): slow eye movements were used toidentify moments of "insufficient perceptual capabilities", <strong>and</strong> increase of slowwave EEG to identify "deficient information processing". The authors write thatthis combination appears to be the most promising way to obtain a completepicture of the drivers state related to alertness.The following figure (figure 1) shows the correlation coefficients r forsubjectively evaluated <strong>drowsiness</strong> <strong>and</strong> a) an algorithm based on signals fromlateral vehicle position, steering wheel angle <strong>and</strong> longitudinal speed (vehicle state<strong>and</strong> driver inputs); b) only driver inputs (such as steering angle); c) only vehiclestate variables (such as lateral vehicle position).single vehicle state input (best result)single driver input (best result)driver inputs combinationvehicle state inputs combinationalgorithm w ith both driver inputs <strong>and</strong>vehicle state inputs0 0,1 0,2 0,3 0,4 0,5 0,6 0,7 0,8correlation coefficient rFigure 1 Correlation coefficients for different methods of <strong>drowsiness</strong> prediction,based on a study in the Daimler Benz simulator with 20 professional truck drivers[19]. The algorithm itself is based on retrospective six minute moving averagesusing one-minute intervals. Driver inputs are for example steering wheel angle;vehicle state inputs are measures like lateral position <strong>and</strong> TLC.The heart rate variability is also reported to be able to determine the alertnessstate of the driver [20, 21]. It is though challenging to obtain this measure withouthaving to place electrodes on the driver.<strong>VTI</strong> meddel<strong>and</strong>e 922A 17
4.2 Ocular dynamicsVarious studies have shown the possibility to detect <strong>and</strong> partly predict fatigue bymeans of ocular dynamics.The study from the Federal Motor Carrier Safety Administration (FMCSA,formerly the Federal Highway Administration Office of Motor Carriers) of the USDepartment of Transportation indicated six parameters as potential c<strong>and</strong>idates fordetecting <strong>drowsiness</strong> [22]. “Blink duration showed evident correlation to time-ofday(TOD) <strong>and</strong> time-on-task (TOT, which means how long has the driver beendriving without break) <strong>and</strong> was longer in the minute preceding the simulated offroadaccidents than immediately after, <strong>and</strong> considerably longer than at the start ofearly morning driving. Blink frequency showed similar TOD <strong>and</strong> TOT effects,however, the results were less consistent than with blink duration. Partial eyeclosures during fixations showed clear TOD <strong>and</strong> TOT effects. The results showthat this parameter can detect degraded alertness at least two to three minutes, <strong>and</strong>likely ten to twelve minutes, before an accident. Eye closures occurred with arelatively high frequency in the minute preceding off-road accidents <strong>and</strong> showed adramatic increase 20 to 30 seconds before the accidents. Saccade frequency wasmarkedly higher in the 30 seconds following [off-road accidents] as compared tothe 60 seconds preceding off-road accidents. Large head <strong>and</strong> body movements,although not specifically measured in the study, were observed to be obviousindicators of fatigue.” For the complete report see [22], a short summary isavailable under [23].Wierwille <strong>and</strong> Ellsworth [24] state that the measurement of duration of eyeclosure is the best <strong>and</strong> practical instrument to detect driver fatigue. The techniquesto detect eye closure can be fibre optical lenses <strong>and</strong> image analysis instruments. Itis also mentioned that combining eye closure measurements with other methods,such as steering wheel movements, can enhance the prediction <strong>and</strong> detection offatigue.In the report by Obara et al. [25] an “intelligent” car is presented that incorporatesa <strong>drowsiness</strong> detection system based on image processing technologies.The system uses a small CCD camera that is installed in the instrument panel ofthe car to monitor the face of the driver <strong>and</strong> record the eye closure, from whichinformation about how drowsy a driver is are computed. If <strong>drowsiness</strong> is detectedthe systems provides warnings in form of a sound <strong>and</strong> a fragrance. The <strong>drowsiness</strong>detection system described by Obara is based on the observation that eye blinkinggenerally changes from blinking quickly (at wide-awake), to increasingly slowblinking (<strong>and</strong> even closed eyelid) with declination of alertness. According to theauthors the system was successful in detecting <strong>drowsiness</strong>.Smith et al. [26] reported the successful head/eye monitoring <strong>and</strong> tracking ofdrivers to detect <strong>drowsiness</strong> by use of one camera pointed at the driver’s face. Theimage processing algorithms are also described to some extent in the paper.The number of publications that confirm the successful detection of driver<strong>drowsiness</strong> by use of measures from eyelid movements, such as blinks, isabundant. Nevertheless, few authors go into details about hardware or algorithmsof the detection systems. Some details are revealed in the paper by Shimotani etal. [86] <strong>and</strong> Grace et al. [30], where basic hardware <strong>and</strong> algorithms are depicted.It has to be noted that systems operating cameras to monitor the eyes of thedriver mostly do not function properly when the driver is wearing sunglasses,furthermore the functioning can be problematical in poor light conditions, in very18 <strong>VTI</strong> meddel<strong>and</strong>e 922A
ight light conditions, when people wear eyeglasses, for people with very darkskin, <strong>and</strong> atypical facial shape [27, 45].PERCLOSPERCLOS (PERcent eyelid CLOSure) is a measure of driver alertness, which wasidentified as the most reliable <strong>and</strong> valid in a study by the US Federal HighwayAdministration; various authors refer PERCLOS as a st<strong>and</strong>ard for <strong>drowsiness</strong>detection. The measure is the percentage of eyelid closure over the pupil over time<strong>and</strong> reflects slow eyelid closures rather than blinks. The PERCLOS <strong>drowsiness</strong>metric was established in a 1994 driving simulator study as the proportion of time(%) in a minute when the eyelids are at least 80 percent closed. Based on researchby Wierwille et al. [28], the US Federal Highway Administration (FHWA) <strong>and</strong>the US National Highway Traffic Safety Administration (NHTSA) considerPERCLOS to be among the most promising known real-time measures ofalertness for in-vehicle <strong>drowsiness</strong>-detection systems [29].In the literature three metrics related to PERCLOS are mentioned:• P70: the proportion of time when the eyes were closed at least 70 percent.• P80: the proportion of time when the eyes were closed at least 80 percent(the P80 metrics is usually referred as ”PERCLOS”)• EYEMEAS (EM): the mean square percentage of the eyelid closure rating.It has to be noted that in the study by Wierwille et al. [28] <strong>and</strong> the relatedtechnical brief from the Federal Highway Administration [29] that in order todetect the eyelid closures the face of test persons was monitored <strong>and</strong> recorded, <strong>and</strong>then trained human scorers viewed the recordings <strong>and</strong> rated the degree to whichthe drivers’ eyes were closed from moment to moment. The challenge related tothe PERCLOS metrics is the automatic measurement of the eyelid position,however, successful attempts to measure eyelid position (<strong>and</strong> derive PERCLOSfrom it) are reported by Grace et al. [30], where a CCD camera monitors the faceof the driver.The PERCLOS metrics is measured directly <strong>and</strong> estimated with non-parametricmethods for detecting <strong>drowsiness</strong> in drivers in the paper by Grace et al. [30].For more details about the PERCLOS measure see chapter 4.6 “Combinationof different methods” on page 32.DDDSThe “drowsy driver detection system” (DDDS) is related to the PERCLOSmeasure (see above). It uses of a low-power Doppler radar system operating at24–GHz to monitor the face of the driver. Main measures extracted are eye lidclosure <strong>and</strong> closure frequency. The system is claimed to detect <strong>drowsiness</strong> <strong>and</strong>fatigue prior to the driver’s falling asleep [31]. More information about theproduct is not available.Summarizing, eyelid closure <strong>and</strong> related measures are, according to theliterature, the most promising <strong>and</strong> reliable predictors of <strong>drowsiness</strong> <strong>and</strong> sleeponset. The problem with these methods is the eye tracking <strong>and</strong> monitoringtechnology needed to record the eye parameters of the driver.<strong>VTI</strong> meddel<strong>and</strong>e 922A 19
4.3 Steering wheel movements <strong>and</strong> steering wheelvariabilityAs reported by Wylie et al. [32], steering wheel variability is related to the amountof <strong>drowsiness</strong> in drivers (variability greater as drivers become more drowsy) afterbeing adjusted for road dependent effects. Steering wheel variability is alsostrongly <strong>and</strong> reliably affected by location on the route. Therefore this measuremust be corrected for route dependent effects if it is to achieve its full potential asan indicator of driver fatigue. The adjustment for route dependent effects can beperformed for example by subtracting the all-driver average steering wheelvariability associated with each mile of road, thus reducing the variationassociated with road curvature. The authors of the article also suggest consideringthe power spectral density of the steering wheel angle in relation to fatigue.Clearly this approach is arduous for real-time measurements.Mitsubishi has reported the use of steering wheel sensors <strong>and</strong> measures ofvehicle behaviour (such as lateral position of the car) to detect driver <strong>drowsiness</strong>in their “advanced safety vehicle” [33]. Toyota uses steering wheel sensors(steering wheel variability) <strong>and</strong> pulse sensor [34] (to record the heart rate <strong>and</strong> theheart rate variability of the driver) to achieve the same goal, though no detailsabout the exact nature of the measures used are available. The following imagerepresents a <strong>drowsiness</strong> detection example from the Toyota study.Figure 2 Drowsiness judgment example from [34]. “General judgment (actuation)”is the system output (detection of <strong>drowsiness</strong>), “self declaration” is thedriver’s subjective <strong>drowsiness</strong> experience, the “fluctuation” (pulse of the driver)<strong>and</strong> the “steering adjustments interval“ are the recorded input variables for the<strong>drowsiness</strong> detection. Note: the authors do not explain how the three thresholdsare set.20 <strong>VTI</strong> meddel<strong>and</strong>e 922A
Micro-correction in steeringMicro-corrections are necessary for environmental factors such as small roadbumps <strong>and</strong> crosswinds. Drivers tend to reduce the number of micro corrections inthe steering wheel movements with increasing <strong>drowsiness</strong>. When these microcorrectionsdiminish, the operator is defined as being in an impaired state [35].The commercial device “Steering Attention Monitor” (see 5.1 “SAM” on page 35)monitors such micro-corrective movements, sounding an alarm when the microcorrectionsare absent.VHAL indexThe VHAL index is a steering wheel-related parameter that is used by certainauthors to identify steering wheel movements. It is calculated by extracting highfrequency <strong>and</strong> low frequency components from the steering wheel signal [79].Bittner et al. [79] showed a relationship between the VHAL index <strong>and</strong> fatiguelevel (determined offline by human expert based on video recordings of thedriver’s face). The basic idea was that a tired driver selects an easy drivingstrategy, i.e., he compensates only large deviations, which can be detected fromsteering wheel movements. An example of VHAL index <strong>and</strong> fatigue is shown infigure 3.sleepyalertFigure 3 Time series of VHAL (top) <strong>and</strong> fatigue index (bottom) indexes.Horizontal axis in minutes.Note: the authors do not specify the explicit meaning of the VHAL acronym.The bottom curve of the same figure illustrates the fatigue index of the driver. Itcan be seen that in approximately the fifteenth minute the courses of the twoparameters become very similar, both in shape <strong>and</strong> in phasing (it seems that thefirst 15–20 minutes are the time necessary for the driver to adapt to the givenfreeway <strong>and</strong> the appropriate driving style). The VHAL index value decreases withincreasing fatigue (as can be seen in the mentioned medium-time periods <strong>and</strong>long-time trend).The authors conclude that the results related to steering wheel movements arevery promising, but that more experiments will be needed to validate the results.SummaryVarious studies show the possibility to detect <strong>drowsiness</strong> by using measures fromsteering movements. It is possible to derive a number of variables from steeringwheel movements, which correlate in some way with <strong>drowsiness</strong>, such as velocityof the steering movement [49], variance in the steering wheel velocity [40], etc.<strong>VTI</strong> meddel<strong>and</strong>e 922A 21
An important advantage of measures recorded from the steering wheel overmeasures based on lateral car position (described below) or eye blinks, is that theformer are much easier to measure, since no camera or image processing equipmentis needed.It has to be pointed out that a common pattern in drowsy drivers is that theoverall number of small <strong>and</strong> slow steering corrections (so called microcorrections, which are normal in driving) diminishes, while the number of large<strong>and</strong> fast corrections increases.Steering wheel monitors were developed, evaluated <strong>and</strong> in some instances theywere even commercially available from certain car manufacturers (such as Nissan[36] <strong>and</strong> Renault [37], <strong>and</strong> for trucks as described by Haworth [38]). The mainproblem with steering wheel input monitors are that they do not really work veryeffectively, or at least only work in very limited situations [39]. Such monitors aretoo dependent on the geometric characteristics of the road (<strong>and</strong> to a lesser extentthe kinetic characteristics of the vehicle), thus, they can only function reliably onmotorways [37]. Thus, the approach now being developed by Renault is tointegrate steering wheel input data with a video of the driver’s face (to monitoreye lid droop) [11].4.4 Lateral positionDingus et al. [40] tested the correlation between different indicators of driverimpairment, such as lane measures <strong>and</strong> eye closure measures. A result was thatthe number of lane exceedances due to these impairments had the highestcorrelation with the PERCLOS measure, which is considered a st<strong>and</strong>ard for<strong>drowsiness</strong> detection (see also chapter “PERCLOS” in page 19). Table 2 displaysresults of the study.Table 2 Eye measures vs. lane measure correlations in relation to driverimpairment due to intoxication or <strong>drowsiness</strong>. (EYEMEAN: mean eyelid closure(zero = wide open), EYEMEAS: mean-square percentage of the eyelid closuresignal, PERCLOS: proportion of time that the eyes are 80 % to 100 % closed,LANEX: count of the number of samples taken while the simulated vehicle wasout of the lane, LANEDEVV: lane position variance, LANEDEVSQ: weightedlane deviation (heavier weighting away from the centre lane by a squaredfunction), LANEDEV4: heavily weighted lane deviation (heavier weighting awayfrom the centre of the lane by a fourth power function)).EYEMEAN EYEMAS PERCLOSLANEX .47 .54 .62LANEDEVV .50 .55 .60LANEDEVSQ .55 .59 .60LANEDEV4 .36 .40 .40In the report by Wylie et al. [32] lane-tracking variability was observed to berelated to the amount of <strong>drowsiness</strong> in drivers. The authors of the article observed<strong>and</strong> identified <strong>drowsiness</strong> in the test drivers by off-line video recording of thedriving. It was concluded that lane-tracking variability is a valid indicator ofdriving performance, <strong>and</strong> that <strong>drowsiness</strong> causes increased lane-trackingvariability (here lane tracking variability is defined as st<strong>and</strong>ard deviation of laneposition). The authors conclude that because drivers alter their driving behaviours22 <strong>VTI</strong> meddel<strong>and</strong>e 922A
in response to conditions in the roadway environment, it is important to accountfor those differences when using measures such as lateral position <strong>and</strong> steeringwheel angle for detecting <strong>drowsiness</strong> in drivers. For example, the lateral positionof a vehicle can change according to the traffic conditions in the adjoining lanes,as well as in response to the condition of the roadway itself (ruts in the wheelpath, the cross-slope of the road, <strong>and</strong> other factors). Additionally, sensors thatmonitor the vehicle's position with respect to a fixed mark, such as a lane stripe,operate under the assumption that the mark is both properly placed <strong>and</strong> is readableby the sensor.The simulator study by Peters <strong>and</strong> Kloeppel [41] also shows that the variancein the lateral position of the car on the lane increases with <strong>drowsiness</strong> of thedriver. The results are shown in figure 5.Figure 4 Average lateral placement variance in meters. Driver sleep deprivationincreases from day one to day 4.The st<strong>and</strong>ard deviation of lateral position (SDLP, see definitions in appendix 4),first mentioned by Klein et al. [42] as indicator of fatigue based impairment is,according to Allen <strong>and</strong> O’Hanlon, in close relation to the probability of comingoff the road (lane exceedance probability) [43]. Stein et al. [82] also measured asignificant increase in the SDLP during prolonged driving sessions (see figure 6).<strong>VTI</strong> meddel<strong>and</strong>e 922A 23
Figure 5 St<strong>and</strong>ard deviation of lane position during tracking task (from Stein,[82]). X-axis: run number (hours).It is also noteworthy that the most common consequence of falling asleep duringdriving is crossing the right lane end, rather than crossing the middle roadmarking (see also figure 7) [44]. From the article it is, however, not clear ifdriving on the left h<strong>and</strong> side (as in Engl<strong>and</strong> for example) creates the samebehaviour pattern.Figure 6 Consequences of falling asleep during driving according to Sagberg,[44].In one field study within the SAVE project analysing eight subjects susceptible tofalling asleep [45] mean lateral position, st<strong>and</strong>ard deviation of lateral position(SDLP), <strong>and</strong> st<strong>and</strong>ard deviation of steering wheel movements were used as24 <strong>VTI</strong> meddel<strong>and</strong>e 922A
driving performance measures. Some results are shown in the following figures.The figures summarize four hours of motorway driving.Figure 7 Mean lateral position on the road (distance right-h<strong>and</strong> wheel to righth<strong>and</strong>line) for conditions normal to drowsy (SAVE study).Note: In figure 8 until figure 11 the x-axis (time) resembles the increasing<strong>drowsiness</strong> in drivers. This approach has the advantage that <strong>drowsiness</strong> as suchdoes not need to be defined or calculated, since it is assumed that drivers get moredrowsy with increasing driving time (also called time on task, or TOT).Figure 8 Average st<strong>and</strong>ard deviation of the lateral position (SDLP) (SAVEstudy).<strong>VTI</strong> meddel<strong>and</strong>e 922A 25
Figure 9 St<strong>and</strong>ard deviation of steering wheel movements (SAVE study).In figure 8 the mean position on the road is displayed as the distance between theright-h<strong>and</strong> line <strong>and</strong> the right-h<strong>and</strong> wheel. The position on the road is fairly stable,although there is a tendency to drive closer to the right-h<strong>and</strong> side of the lane whenimpaired by alcohol <strong>and</strong> after three hours of driving. Drivers apparently noticetheir impairment <strong>and</strong> choose to drive on the safer side of the lane.In figure 8 the SDLP is shown. SDLP increases rapidly after the first30 minutes. After two hours of driving there is a slight improvement in performance,although in the following hour SDLP increases again.Figure 9 shows the average st<strong>and</strong>ard deviation of the steering wheel movements.It reflects more or less the same increase as SDLP, but st<strong>and</strong>ard deviationof the steering wheel is of course more affected by road curvature.A driving simulator study performed in the SAVE project did not completelymatch the results of the field tests mentioned above. However, the SDLP wasobserved to be related to <strong>drowsiness</strong>, especially in the last five minutes before adriver went off the road because of dozing off (see following figure).26 <strong>VTI</strong> meddel<strong>and</strong>e 922A
SD lateral positionFigure 10 St<strong>and</strong>ard deviation of lateral position in a driving simulator study.A simulator study commissioned by the Swedish National Road Association(SNRA) [46] showed that there is a difference in the lateral vehicle position ofdrowsy <strong>and</strong> alert drivers. Drowsy drivers tend to drive closer to the right road endthan the other group. However, the study could not confirm a statistically significantdifference in the lateral position variation between the two groups.De Waard illustrates in his thesis that the st<strong>and</strong>ard deviation of lateral position<strong>and</strong> of steering wheel movements increase with prolonged driving [47]. Thoughprolonged driving is not the same as <strong>drowsiness</strong>, it can be assumed that a driverwho is driving for a long time will be drowsier compared to a baseline (short timedriving for example). Selected results from the thesis by De Waard are shown infigure 11. The 95 % confidence intervals are also indicated in the figure. Thefigure shows also the st<strong>and</strong>ard deviation in steering wheel position for fatigueddrivers. It can be seen from the figure that fatigued drivers have both significantlyhigher variability in lateral position <strong>and</strong> in steering wheel movements than alertdrivers. The results are based on the “DREAM” study by Brookhuis <strong>and</strong> DeWaard (1993) [48].<strong>VTI</strong> meddel<strong>and</strong>e 922A 27
Figure 11 St<strong>and</strong>ard deviation of lateral vehicle position (right h<strong>and</strong> lane) <strong>and</strong> ofsteering wheel position. "Base" represents the baseline of the study (driver notfatigued); "Load" represents fatigued driver.SummaryMeasures of lateral lane <strong>control</strong> are important to detect the onset of <strong>drowsiness</strong>, asdifferent studies have shown. Still the problem lies in the reliable real-timedetection of the vehicle’s lateral position. Another problem is so called microsleeps:when a drowsy driver falls asleep for some seconds on a very straight roadsection without changing the lateral position of the vehicle. Such happeningswould not be detectable by a system based only on lateral vehicle position.28 <strong>VTI</strong> meddel<strong>and</strong>e 922A
Different measures have been used in the studies; the following table (table 3)summarizes different lateral lane position results from two extensive studies bySkipper et al. [49], <strong>and</strong> by Dingus et al. [40] (see also [28]).Table 3 Lateral position measures <strong>and</strong> relationship to <strong>drowsiness</strong> (adapted from[28]).FindingLane deviations which were heavily weighted for lane exceedances were foundto be highly correlated with eye closure <strong>and</strong> were influenced by sleepdeprivation <strong>and</strong> time on task.St<strong>and</strong>ard deviation of the lane position was found to be highly correlated witheye closure <strong>and</strong> was influenced by sleep deprivation <strong>and</strong> time on task.Global maximum lane deviation was found to be highly correlated with eyeclosure <strong>and</strong> was influenced by sleep deprivation <strong>and</strong> time on task.Mean square of the lane deviation was found to contain a significant amount ofindependent information. The measure is considered to be an accurate <strong>and</strong>reliable measure for the detection of <strong>drowsiness</strong>.Mean square of the high pass lateral position (heavily weighted for rapidchanges in lateral position) shows potential as a <strong>drowsiness</strong> indicator.Ref.49494940404.5 Time-to-line crossing (TLC)Time-to-line crossing represents the time available until any part of the vehiclereaches one of the lane boundaries. It is computed from the lateral position of thecar. Time-to-line crossing is considered an important measure of driver performance[50, 51]. However, it is difficult to compute in real driving. Thereforeapproximation methods that resemble the real time-to-line crossing have beenproposed for real-time measurements during car driving.In a study by Verwey <strong>and</strong> Zaidel [52] it was found that time-to-line crossingmay be used as a predictor for driver impairment induced by <strong>drowsiness</strong>. TLCminima may indicate progressing <strong>drowsiness</strong> <strong>and</strong> be used to warn the driver ofdeteriorating performance before the vehicle actually drifts out of the lane.Another important application of TLC in driver warning systems is to detectinstances when the vehicle actually moves out of the lane <strong>and</strong> to warn the driverin order to avoid an immediate accident. A major problem with the measurementof TLC is the complexity of its computation in real time while driving on theroad. Also, this measure is computed differently for straight stretches of roadcompared to curves.TLC can be computed trigonometrically offline, <strong>and</strong> is used as a reference inthe study by van Winsum et al. [53] (see also appendix 1 for the formulae). Forreal time calculation two methods are tested: approximation of TLC using the firstderivation of the lateral distance, <strong>and</strong> approximation of TLC using the first <strong>and</strong> thesecond derivation of the lateral distance. The most reliable result for normal lanekeeping of the study by van Winsum et al. was that the TLC estimation thatincludes both first <strong>and</strong> second derivative of lateral distance (lateral velocity <strong>and</strong>rate of change of lateral velocity) results in a good convergence with thetrigonometrically computed TLC (both with regard to TLC minima <strong>and</strong> thepattern of the signal in the time domain). This TLC approximation resulted in aclose correspondence of the minima with accurate TLC minima in an absolutesense <strong>and</strong> a close correspondence in time of the moments at which the approxi-<strong>VTI</strong> meddel<strong>and</strong>e 922A 29
mated <strong>and</strong> accurate TLC minima occur. The method of TLC estimation basedsolely on lateral distance <strong>and</strong> lateral velocity gives poor results on these points.Summarizing, the authors recommend using the approximation method based onlateral distance, lateral velocity, <strong>and</strong> the second derivation of lateral position (thus,the first <strong>and</strong> second derivation of lateral position) as an approximation of TLC inreal world driving. A more precise method to calculate TLC is presented in thethesis by Chiu-Geng Lin [54]; methods used are among others Kalman Filtering.It has to be noted that the lateral position data has to be sampled with at least10 Hz in order to be usable for TLC calculations. Time-to-line crossing was usedin the SAVE study [45] as a performance measure. The calculations were madebased on 30 seconds of data.Renner <strong>and</strong> Mehring [19] also used TLC, in their report it was used to initiatelane departure warning. Extensive work related to lane keeping <strong>and</strong> lane departurewarning (related to TLC <strong>and</strong> <strong>drowsiness</strong>) can be found in the Ph.D. thesis byBatavia [55]. In the report by Pomerleau et al. [56] different algorithms tocalculate TLC are presented <strong>and</strong> evaluated in their performance (see appendix 2).The extensive report also illustrates the results of the different algorithms relatedto TLC <strong>and</strong> lane keeping.In order to calculate some form of TLC it is needed to estimate the vehicle’stravel path, this prediction can be made in several ways, as exemplified in thework of Batavia et al. [57] Methods for calculation of TLC are for examplememory based learning <strong>and</strong> kinematics projection. In memory based learningcurrent lane position <strong>and</strong> lateral velocity is used to look up the most likely futurelane position based on previous training data. Kinematics prediction works asfollowing: given the current vehicle state, which consists of lane position <strong>and</strong>lateral velocity, compute what the lateral position of the vehicle will be in tseconds, assuming constant lateral velocity, using lp’=lp+(t*lv), where lp’ ispredicted lane position, lp is current lane position, lv is lateral velocity, <strong>and</strong> t is theprediction time step. Results of the methods by Batavia et al. in terms ofperformance of the TLC prediction are shown in figure 12 <strong>and</strong> figure 13. Asconcluding remarks for the results from Batavia, it can be said that a number ofdifferent algorithms <strong>and</strong> methods have being used to study the problematic ofcalculating TLC. The results of the calculations are somewhat similar, <strong>and</strong> thefinal scope of the calculation determines which method is used.30 <strong>VTI</strong> meddel<strong>and</strong>e 922A
Figure 12 Prediction results for 50 seconds of driver_10 using kinematicsprediction. The blue (dark) is actual future lane position; the red (bright) ispredicted.Figure 13 Prediction results for 50 seconds of driver_10 memory based learning.The blue (dark) is actual future position, the red (bright) is predicted future laneposition.In the thesis by De Waard ([47], also cited in relation to st<strong>and</strong>ard deviation oflateral position, see chapter 4.4 Lateral position) time-to-line crossing wasmentioned to be related to state of fatigue of the driver. Table 4 shows results forminimum <strong>and</strong> median TLC for fatigued drivers <strong>and</strong> a baseline (driver notfatigued).Table 4 Time-to-line crossing times in seconds for fatigued drivers compared tobaseline. Results for state "fatigue" <strong>and</strong> the different TLC are statistically significant.left h<strong>and</strong>median TLCleft h<strong>and</strong>minimum TLCright h<strong>and</strong>median TLCright h<strong>and</strong>minimum TLCbaseline 5,31 1,89 3,79 1,58fatigue 3,95 1,71 3,11 1,30<strong>VTI</strong> meddel<strong>and</strong>e 922A 31
4.6 Combination of different methodsThere is a general agreement that more than one of the methods mentioned aboveare necessary to obtain reliable <strong>drowsiness</strong> detection. Frequently combinedmethods are steering wheel movements <strong>and</strong> lateral position variables. Peltier-Dillies [27] describes in her study related to detection of decreased drivervigilance how a combination of more measures can be used to detect impaireddriving (also caused by <strong>drowsiness</strong>). A real-time fuzzy pattern recognition processimplemented in a neural network is fed with signals from the steering wheel, thespeed of the car <strong>and</strong> the accelerator. According to the author of the paper thesystem allows a reliable on-line detection of driver vigilance decrease.Moreno et al. [58] combined steering wheel movement data, acceleration <strong>and</strong>braking data, <strong>and</strong> speed data of the vehicle to detect the driving pattern of adrowsy driver. The first results of the research were promising; the authorsconcluded that more elaborated driving tests must be performed in the next stagesof the research in order to evaluate the performance of the system <strong>and</strong> to adjustthe system for optimal performance.Use of sensors present in vehicles with navigation system<strong>Vehicle</strong>s with a navigation system onboard use among other sensors a gyrosensor. This gyro sensor, together with a velocity sensor, could be used tocompute the driving trace in real time. The result of the calculation with gyrosensor is in fact very similar as the one with use of a lateral vehicle positiondetection system, with the great advantage that sensors already present in thevehicle can be used.Honda Motor Co. has research plans regarding the use of gyro sensor <strong>and</strong>speed sensor to assess the amount of horizontal deviation <strong>and</strong> the driving path ofthe vehicle (i.e. zigzag driving), which is caused for example by <strong>drowsiness</strong> [59,60] (see figure 14). By now, no details about used algorithms to detect <strong>drowsiness</strong>by use of the two sensors are known.Figure 14 Zigzag driving detection with speed <strong>and</strong> gyro sensor.AlgorithmsThe onset of <strong>drowsiness</strong> is slow, <strong>and</strong> there is no one single physiological orphysical measure that is a reliable indicator. Therefore, the approach taken byWierwille was to try over 120 different algorithms <strong>and</strong> test, which was best [28].The inputs to some of these algorithms include steering motion, lateralacceleration, lane deviation measures, yaw, yaw rate, <strong>and</strong> physiological measuressuch as EEG data taken from a headb<strong>and</strong>, so as to be minimally intrusive. Theoutput is a prediction of one of four different accepted <strong>drowsiness</strong> measures:32 <strong>VTI</strong> meddel<strong>and</strong>e 922A
1: AVEOBS, which is an observer rating measure, 2: EYEMEAS <strong>and</strong> PERCLOS,which are measures of slow eye closure, <strong>and</strong> 3: NEWDEF, which includes sloweye closure, <strong>and</strong> EEG data. The best prediction results to be implemented inalgorithms (in terms of R 2 ) were in fact obtained by using four to seven differentvariables together.Related to the publication by Wierwille mentioned before [28], in the work byKnipling <strong>and</strong> Wierwille [3] many algorithms to detect <strong>drowsiness</strong> in drivers areexamined. The algorithm, which was deemed best, was judged according to thegreatest correlation with the PERCLOS metrics (the percentage the eyes of thedriver are closed to 80 % <strong>and</strong> more); which is in fact considered as a st<strong>and</strong>ard for<strong>drowsiness</strong> indication for many authors. The algorithm that is presented is a linearcombination of the st<strong>and</strong>ard deviation of the lateral velocity over a six minutetime window, st<strong>and</strong>ard deviation of lateral position relative to the lane, meanst<strong>and</strong>ard deviation of the distance between the edge of the vehicle <strong>and</strong> the lanemarker only when the vehicle is outside the lane, the proportion of time thesteering velocity exceeds 150 deg/sec, the number of times the steering wheel isheld still for more than 0.4 sec, <strong>and</strong> the proportion of time the steering wheel isheld still for 0.4 sec or longer. The algorithm has 98 % correct classification(relative to the PERCLOS measure). The coefficients of the equation are shown intable 5. Thresholds were set for “awake, “questionable”, <strong>and</strong> “drowsy” state of thedriver. The measure resulting from the regression equation was compared to thePERCLOS measure (which is considered a st<strong>and</strong>ard). Figure 15 shows theprogression of <strong>drowsiness</strong> for a sample driver <strong>and</strong> the observed <strong>and</strong> predictedPERCLOS values. As it can be seen the algorithm is able to predict the originalPERCLOS value to a good extent (regression coefficient 0.872). What isimpressive is that they are able to classify fairly successfully between ’alert’,’somewhat drowsy’, <strong>and</strong> ’dangerously drowsy’, over different drivers withoutmodifying their algorithms. This generality is not seen in a lot of the other drivermodels.A considerable number of other different algorithms that use different variablesis listed <strong>and</strong> validated in the report by Wierwille [28, chapter 4 <strong>and</strong> 5].<strong>VTI</strong> meddel<strong>and</strong>e 922A 33
▪ PERCLOS algorithm− Observed PERCLOSFigure 15 Progression of <strong>drowsiness</strong> <strong>and</strong> concordance of predicted <strong>and</strong> observedPERCLOS value. The three threshold values are also drawn [3].Table 5 Algorithm to predict <strong>drowsiness</strong> based on the PERCLOS measure(regression result). The "B Weight" factors are used to form a linear regressionequation of the PERCLOS metrics.For the calculation of <strong>drowsiness</strong> with lateral position <strong>and</strong> steering wheel datausing PERCLOS as st<strong>and</strong>ard, the algorithm for <strong>drowsiness</strong> detection presented byKipling (table 5) shows the most promising results of the whole literature study.Neural networksThere are more attempts to use nonparametric methods such as artificial neuralnetworks to predict <strong>drowsiness</strong>. The networks are typically fed with inputs fromcar position on the road, speed variables, <strong>and</strong> steering wheel position (see [30] foran example). This approach was also applied in the SAVE project.34 <strong>VTI</strong> meddel<strong>and</strong>e 922A
5 Commercially available fatigue monitorsThere is a number of commercially available fatigue monitors; working principlesare based on head movements, heart rate variability, steering wheel movements<strong>and</strong> grasping strength, EEG analysis, eye movements <strong>and</strong> activity sensors [61,45].Examples are the Onguard eye closure monitor, Dozer's Alarm (a headnodding monitor), <strong>and</strong> an analogue of the Roadguard reaction time monitor.These devices have been evaluated in 1991 by the Monash University AccidentResearch Centre [87].The criteria used to evaluate the alarms were reliability, threshold <strong>and</strong> degreeof intrusiveness.Subjects rated the head nodding monitor (Dozer's Alarm) as the least annoyingof the three monitors, considered it to be the most effective <strong>and</strong> said they wouldbe most willing to use <strong>and</strong> purchase this device. However, these trends were notsignificant when subjected to analysis of variance, possibly because of the smallnumber of subjects in each group. A problem with such a detection method is thatit may not detect <strong>drowsiness</strong> until a late stage or even sleep, perhaps after seriousperformance deterioration has already occurred [87].The reliability of the Onguard eye monitor (which monitors eye closure byusing special eyeglasses that the driver must wear) <strong>and</strong>, to a lesser extent, theDozer's Alarm (which is similar to a belt that is carried by the driver on the head<strong>and</strong> records the head position of the driver) is reduced by the tendency to slipfrom the correct position. Redesign of the devices or more secure attachmentcould correct this problem, however.In conclusion, the devices showed the ability to detect fatigue in some casesbut were not able to maintain alertness <strong>and</strong> thus prevent performance deterioration,which is in some cases also seen as a goal. The need to develop more reliabledetectors of driver fatigue still remains. Fatigue detectors can only be used as awarning to stop driving <strong>and</strong> rest, not as an aid to prolong driving.A review of fatigue detectors can be found in [61, 45]. Other fatigue detectorsthan those briefly described here are found in the review by Hartley [11, page 16],the detectors described there belong to the group “physiological/behaviouralmonitoring” (thus, are left outside in this report).5.1 SAMRebman Driver Alert Systems Ltd [62] is selling “SAM” a “driver fatigue alarm”,which is installed under the steering wheel of the car <strong>and</strong> is claimed to detectfatigue <strong>and</strong> <strong>drowsiness</strong> in drivers. The small device monitors movements of thesteering wheel (micro-correction in steering) with a magnetic sensor, <strong>and</strong> throughthis detects <strong>drowsiness</strong> in drivers; it is currently priced 235 US $. The companygives no information about the working principle or the algorithms, <strong>and</strong> no proofof the functionality of the device provided.For more details about the measurement principle see Chapter “Microcorrection”on page 21.Note: the same system is sold from another company: “DrivAlert Systems, Inc.”[63] with the same specifications. No data are available to confirm the performanceof the system.<strong>VTI</strong> meddel<strong>and</strong>e 922A 35
5.2 DAS 2000 Road Alert SystemThe DAS 2000 Road Alert System [64] detects if drivers have inadvertentlycrossed the centre line or right shoulder lines (in the USA). If either line is crossedwithout using the turn signals, the system sounds an audio alarm to alert thedriver. No formal evaluation of this system was found in the literature. However;as a very general statement, after reviewing such methods the Accident ResearchCentre at Monash University Australia (1997) did not recommend them on theirown as driver fatigue countermeasure [11].5.3 SafeTRACThe SafeTRAC Drowsy Driver Warning System from the U.S. company“AssistWare Technology Inc” [65] is a lane tracker that monitors the lanemarkings with a camera mounted on the wind screen <strong>and</strong> facing toward the road,furthermore the system monitors the steering wheel movements of the driver. Thesystem is sold in its basic form for 1975 $, with diagnostic <strong>and</strong> data outputcapability for 15.000$, <strong>and</strong> the algorithms are sold for 25.000$.The company states that: “We <strong>and</strong> our customers have conducted about80,000 miles of testing with the SafeTRAC system, on all types of road <strong>and</strong> alltypes of weather/lighting conditions. The system's availability (percent of the timethe system is tracking the lane correctly) is in the vicinity of 99 %. False alarmsoccur about once every 4–5 hours. As one example, on a recent interstate trip ofabout 350 miles, the system was available 99.45 % of the trip, <strong>and</strong> experienced nofalse positives <strong>and</strong> no false negatives.” No independent validation has beenperformed, though, <strong>and</strong> no measurement data are available from the company toassess the performance of the system.FIAT (Fabbrica Italiana Automobili Torino) has also developed a system thatmonitors the lane markings <strong>and</strong> thus tracks the lateral position of the vehicle, <strong>and</strong>could theoretically be used as input for <strong>drowsiness</strong> prediction methodologies.5.4 TravAlertTravAlert, sold by TravAlert Safety International (Florida, USA), is a device thatmonitors steering movements. “When steering patterns deviate from the normindicating a lapse in driver alertness, a sensor on the steering shaft signals <strong>and</strong>an audible alarm is activated. The EEPROM computer receives data from thesteering shaft sensor relating to motion. When there is no movement of the shaft(4–13 seconds) an alarm sounds. The EEPROM unit built into the device recordsthe alarm event <strong>and</strong> generates a driver performance profile for downloading to anexternal source. TravAlert is armed automatically when the vehicle reaches30 mph. This system can be installed for about $400.”There is very little information available about the company <strong>and</strong> the product,however, it seems that the system is similar to the other steering movementsmonitors, since it alarms when no steering movements occur. No validation orperformance data are available.36 <strong>VTI</strong> meddel<strong>and</strong>e 922A
5.5 Companies that are planning to introduce<strong>drowsiness</strong> or fatigue detection <strong>and</strong> warningsystems in vehiclesThe following table (table 6) lists different companies that plan to introducesystems related to <strong>drowsiness</strong> detection in vehicles. For further information pleaseconsult the given references.Table 6 Selection of companies planning to introduce <strong>drowsiness</strong> or fatiguedetection systems in their vehicles.Manufacturer Method for detection ReferenceNissan (cars)eye movements (blinking)registration through infrared cameraDetroit News, November1, 1995 [66]Toyota (cars)steering wheel sensor <strong>and</strong> pulse [34]sensorMitsubishi (cars) two dash-mounted cameras tomonitor <strong>and</strong> analyze eye position<strong>and</strong> blinking[66, 67, 68]Daimler Chrysler(trucks)Siemens (automotiveelectronics)RenaultASCI & Complexicavehicle speed, steering angle <strong>and</strong>vehicle position relative to roaddelimitation (recorded by camera) todetect if vehicle is about to leaveroadvideo camera that monitors the eyelid movement (blink rate)infrared light, camera that monitorseyelid movements of the driverhead position detection with neuralnet processingDaimler Chrysler Report1999 [69]Siemens news release1997 [70]Renault R&D Magazine[71]PRN Newswire 2001 [72]<strong>VTI</strong> meddel<strong>and</strong>e 922A 37
6 PatentsA patent for an “alertness <strong>and</strong> <strong>drowsiness</strong> detection <strong>and</strong> tracking system” wasawarded in 1998 (US Patent 5,813,993). The system analyses the EEG, moreprecisely the rhythmic signal components above 30 Hz. “One or more analogueEEG signals are collected from a subject, appropriately filtered, converted intodigital form, <strong>and</strong> subjected to frequency analysis. Selected signal componentsfrom the frequencies above 30 Hz, which have a high correlation with subject<strong>drowsiness</strong>, are isolated, <strong>and</strong> their amplitude, energy, or power contribution to theEEG signal is used to produce a continuous output measure reflecting the subject'salertness or <strong>drowsiness</strong>. The output measure may be compared with a threshold toprovide an indication of whether or not the subject is excessively drowsy.” [73]Another patent for a “Driver's <strong>drowsiness</strong> detection method of drowsy drivingwarning system” was awarded in 1999 to Jung-Hack Yeo. The US patent with thenumber 6,243,015 describes the method of detection as based on monitoring ofeyelid closure by means of a CCD camera [74].There is a number of other patents that concentrate on <strong>drowsiness</strong> detection(see table 7 for a short list, for the patent details go to [74]).Table 7 Patents related to <strong>drowsiness</strong> warning for drivers. Search terms usedalone or in combination with each other: <strong>drowsiness</strong> – detection – alertness –driving – alarm.US Patent NumberName6,016,103 Sleep-detecting driving gloves4,144,531 Drowsiness detecting apparatus4,450,438 Drowsiness alarm system for a vehicle4,564,833 Dozing warning system for a vehicle4,928,090 Arousal level judging apparatus <strong>and</strong> method5,568,127 Drowsiness warning device <strong>and</strong> neck support6,154,123 Driver alertness monitoring system6,097,295 Apparatus for determining the alertness of a driver4,967,186 Method <strong>and</strong> apparatus for fatigue detection4,585,011 Conjugate eye movement detector for sleep analysisNote: US patents are listed here. The list of patents is not complete <strong>and</strong> is onlyrecorded as a summary.38 <strong>VTI</strong> meddel<strong>and</strong>e 922A
7 Problems related to automatic <strong>drowsiness</strong>detectionProblems with automatic <strong>drowsiness</strong> detection are: what is ‘normal’ or safetycritical ‘abnormal’ variability for measures such as lane deviation? What is therange of ‘normal’ variability of these measures in the driving population? Could aperfectly safe driver be classified as ‘abnormal’ on occasions, for example, score afalse positive (see also chapter 1.3 Validation). How has the threshold of‘abnormal’ driving behaviour been selected? With rare exceptions these questionsare not answered in the product descriptions of commercially available products.Thus these technologies also fail to provide satisfactory answers to the problem ofsuccessful validation [11].7.1 Detecting vs. predicting <strong>drowsiness</strong>Clearly the goal has to be the prediction of <strong>drowsiness</strong> onset, since the meredetection of it may already be too late to prevent an accident. The onset of<strong>drowsiness</strong> is slow, <strong>and</strong> there is no single physiological or physical measure that isa good indicator. The problem is emphasized in Renner’s <strong>and</strong> Mehring's paper:”Drowsiness is not easy to recognize especially on a pure visual basis. There aremoments in which the driver still looks awake (eyes wide open) but does notprocess the information anymore. These „looking without seeing“ moments aredangerous <strong>and</strong> need to be captured by an effective system.In order to identify moments of both „insufficient perceptual capabilities“(slow eye closures) <strong>and</strong> „deficient information processing“ (increase of slowwave EEG) we have chosen to define <strong>drowsiness</strong> as a combination of brain <strong>and</strong>eye function. This appears to be the most promising way to obtain a completepicture of the drivers state. Therefore our efforts to predict <strong>drowsiness</strong> werefocused on modelling the time course of a complex <strong>drowsiness</strong> parameter ratherthan concentrating on a single aspect of alertness.” [19, page 2]The prediction of <strong>drowsiness</strong> represents a greater problem then the detection ofit. Many <strong>drowsiness</strong> detectors <strong>and</strong> more general methods to detect <strong>drowsiness</strong>identify when the driver has fallen asleep, which in many cases is too late to avoidaccidents [75].Folkard <strong>and</strong> Åkerstedt [76] simulated the changes of daytime alertness by thecombined action of a homeostatic process, a circadian process <strong>and</strong> a sleep inertiaprocess. This model was recently validated [77] <strong>and</strong> applied for predicting sleeplatency <strong>and</strong> sleep duration (which is related to <strong>drowsiness</strong> in some extent),however, it will not be treated in depth here, since it belongs to the mathematicalmodels of sleep-alertness dynamics, which are not part of the report.7.2 Gender <strong>and</strong> age of the driverInvolvement in drowsy driver crashes is strongly related to the gender <strong>and</strong> age ofthe driver [78]: young males are for example the most endangered group when iscomes to such accidents.<strong>VTI</strong> meddel<strong>and</strong>e 922A 39
7.3 Overtaking <strong>and</strong> road curvatureWhen the detection of <strong>drowsiness</strong> is performed by methods such as lateralposition detection, the overtaking of vehicles can cause wrong detection of<strong>drowsiness</strong>.Road curvature can as well raise problems in the interpretation of lateralposition of the vehicle for the simple fact that a curve could be interpreted as astraight road section where a driver is turning because he/she fell asleep. This isalso a indication that one single measure to predict of detect <strong>drowsiness</strong> may notbe sufficient, but instead a combination of different measures has to be used.The nature of the collected data dictates the severity of these problems: if thedata collected contains information about absolute lateral position of the vehicle(where the vehicle is relative to the road), then the problem with curves disappearsclearly. If the measurements only contain data about relative lateral vehicleposition, then a curve cannot be identified as such!Methods based on steering wheel movements detection have similar problemas described above, with exception of methods based on micro-corrections insteering.40 <strong>VTI</strong> meddel<strong>and</strong>e 922A
8 Further literature of interestThe following literature list is given for the reader who wishes to read more aboutsafety related issues around vehicle <strong>control</strong> <strong>and</strong> <strong>drowsiness</strong>.• Belz SM. An On-Road Investigation Of Self-Rating Of Alertness AndTemporal Separation As Indicators Of Driver Fatigue In Commercial Motor<strong>Vehicle</strong> Operators. Virginia Polytechnic Institute <strong>and</strong> State University, 2000.Ph.D. Thesis.• U.S. Department of Transportation. National Highway Traffic SafetyAdministration. Research on <strong>Vehicle</strong>-Based Driver Status/PerformanceMonitoring; Development, Validation, <strong>and</strong> Refinement of Algorithms ForDetection of Driver Drowsiness. 3-year report. DOT HS 808 247.http://www.itsdocs.fhwa.dot.gov//JPODOCS/REPTS_TE/6Y601!PDF• Hartley L, Horberry T, Mabbott N, Krueger GP. Review of fatigue detection<strong>and</strong> prediction technologies. September 2000. Melbourne: National RoadTransport Commission. ISBN: 0 642 54469 7.• Fatigue <strong>and</strong> Driving: Driver Impairment, Driver Fatigue <strong>and</strong> DrivingSimulation. Laurence Hartley (Editor). ISBN: 0748402624. Publisher: Taylor& Francis, Inc. Pub. Date: January 1995.• Åkerstedt T, Kecklund G. Trötthet och trafiksäkerhet: en översikt avkunskapsläget. Borlänge, Vägverket, 2000, 46 s., 300 ref.; (Publikation/Vägverket2000:74); ISSN 1401-9612.• SAVE: System for effective Assessment of the driver state <strong>and</strong> <strong>Vehicle</strong><strong>control</strong> in Emergency situations. Transport Telematics Project N°: TR 1047.Commission of the European Communities – R&D programme TelematicsSystems in the Area of Transport, 1998.• Kaneda M et al., “Development of a Drowsiness Warning System”, the 14 thInternational Technical Conference on ESV, Munich, 1994<strong>VTI</strong> meddel<strong>and</strong>e 922A 41
9 SummaryThe present literature review served to explore possibilities to predict <strong>and</strong> detect<strong>drowsiness</strong> based on driver performance variables such as lateral positionvariability, as well as physiological variables such as eyelid movements. Whilephysiological variables expose the physical consequences of <strong>drowsiness</strong>, drivingperformance variables point to the effect of driving drowsy: dangerous drivingbehaviour. It should be noted also that a useful <strong>and</strong> acceptable method has to bereliable <strong>and</strong> robust i.e. the number of false alarm <strong>and</strong> misses has to be very low.The literature survey clearly indicates that no single variable, besides possiblyocular related measures (but even that method does not seem to be sufficientlyreliable with respect to false alarms <strong>and</strong> misses), is sufficient for the establishedgoal, even though various single variables show association to <strong>drowsiness</strong>. Acombination of different measures is recommended for <strong>drowsiness</strong> prediction.Furthermore, it should be noted that so far there is no commercial systemavailable that provides a sufficiently reliable method to overcome the seriousproblems with <strong>drowsiness</strong> related accidents. This clearly indicates the complexityof the problem of detecting or rather predicting fatigue induced impaired drivingbehaviour. Following is a short summary of main findings of the review.9.1 Eyelid closureEyelid closure <strong>and</strong> related eye measures are, according to the literature, the mostpromising <strong>and</strong> reliable predictors of <strong>drowsiness</strong> <strong>and</strong> sleep onset. The problem withthese methods is the eye tracking <strong>and</strong> monitoring technology needed to record theeye parameters of the driver. Varying light conditions, diversity of drivers’physiognomy <strong>and</strong> usage of (sun)glasses constitutes substantial difficulties that hasto be overcome by the developers of unobtrusive eyelid sensors. As the driver‘s<strong>drowsiness</strong> increases the eye movements slow down, sometimes accompanied bycharacteristic rolling movements. Eye blinking is also slower <strong>and</strong> more frequentwith increasing level of fatigue. The most plausible <strong>and</strong> accepted measure of<strong>drowsiness</strong> derived from eyelid closure is PERCLOS (see “PERCLOS” on page19).9.2 Brain activity – EEGBrain activity is closely related to <strong>drowsiness</strong> <strong>and</strong> fatigue, this points out thecapability of the electroencephalogram to detect sleep stages, as variations in thesubject’s alertness cause changes in both temporal domain <strong>and</strong> the frequencydomain of the EEG signal. States close to sleep are characterized by increasingalpha <strong>and</strong> theta activities <strong>and</strong> diminishing amplitude of beta activity; the onset ofsleep can be detected by spectral EEG analysis. Nevertheless, automaticassessment of <strong>drowsiness</strong> via EEG analysis was unsuccessful up to now, probablybecause of the difficulty to measure the EEG on drivers <strong>and</strong> also because the EEGof an alert person is very individual, <strong>and</strong> influenced by many psychologicalphenomena. Furthermore EEG recording require cabling of the driver, which isnot an acceptable solution I practice. However, it is useful as reference whenevaluating other systems.42 <strong>VTI</strong> meddel<strong>and</strong>e 922A
9.3 Other physiological measuresPhysiological measures, such as changes in heart rhythm, body temperature;bodily fluids, muscle activity, etc. are still controversial in their power to detect<strong>drowsiness</strong>. Even if laboratory experiments showed relationships between suchparameters <strong>and</strong> <strong>drowsiness</strong>, real-life experiments that demonstrate the possibilityto automatically detect <strong>drowsiness</strong> based on physiological measures are absent.9.4 Driving performance measuresDriving performance measures, such as lane-position measures (lane deviation,st<strong>and</strong>ard deviation of the lane position, the global maximum lane deviation <strong>and</strong>the mean square of lane deviation) <strong>and</strong> steering wheel related measures aretreated as capable <strong>drowsiness</strong> indicators in the literature. A drowsy driver showsworse sensitivity to small movements <strong>and</strong>, as a result, the number of micro-wheeladjustments decreases, lane keeping becomes also poorer with increasing<strong>drowsiness</strong>. These types of measures seem to be promising <strong>and</strong> should be furtherexplored. It also has an advantage in that it is possible to use existing sensors inthe vehicle. However, longitudinal velocity related measures, such as speed ofvehicle, were not found capable of detecting <strong>drowsiness</strong>.9.5 Observations of body motionsBehaviour-related measures are also related to the alertness state of drivers:shortly after beginning his drive, the driver frequently looks into his rear viewmirror <strong>and</strong> side window mirrors, <strong>and</strong> actively watches the road. After30–60 minutes this activity decreases: the driver prefers to move his eyes ratherthan turn his head when checking mirrors, <strong>and</strong> stretches his body when he feelstired. With increasing fatigue he yawns, bends his head to the left or right, takesdeep breaths from time to time, <strong>and</strong> so on. These epiphenomna must be recordedby a camera inside the cabin – <strong>and</strong> can hardly be evaluated automatically [79].9.6 Mathematical modelsMathematical models of sleep-alertness dynamics are not part of this report,however, it should be said that in an extensive review by Hartley et al.[30] it wasfound that today there is no existing system, which could be used in real-worldsituations.The following table (table 8) summarizes methods to detect <strong>drowsiness</strong> <strong>and</strong>offers the personal opinion of the authors regarding the "quality" of the methods.<strong>VTI</strong> meddel<strong>and</strong>e 922A 43
Table 8 A summary of possible methods <strong>and</strong> measures to detect <strong>drowsiness</strong> in adriving situation together with the author’s personal opinion about their possiblepractical value (see note below!).MeasurePossible todetect orpredict<strong>drowsiness</strong>with themeasureMeasurefeasible forautomatic invehicleregistration<strong>and</strong> detectionReferenceLateral placement of the car + (–) + 16, 46, (the SAVEstudy [45] gavenegative results forthis measure)Lateral position variation (<strong>and</strong>lane tracking variability)sSt<strong>and</strong>ard deviation of lateralposition (SDLP)+ + + 32, 45, 80,81+ + + 43 (SDLP is closelyconnected to lateralposition variation),45, 82, 42Steering movements(steering wheel variability)+ + + + 32, 16, 32, 45, 83,84, 35Time to collision (TTC) – – 45Time-to-line crossing (TLC) + + 53, 19Speed maintenance or variation – + + 16, 32, 45, 46Brake reaction – + + 16Time <strong>and</strong> accelerator behaviour – + + 16Eye movements <strong>and</strong> eye blinks + + + 16, 87, 22, 95, 24,45, 25, 28, 85, 67,86Eye closure + + – 87, 24, 92Heart rate <strong>and</strong> related cardiacphysiological measures– (+) – 16, 95, 88, 89(here differentauthors havedifferent opinions)EEG (electroencephalogram) + + – 16, 95, 90, 91Skin potential level + – 92, 93Muscle activity – – 92Analyses of bodily fluids – – 16Time needed to recover from+ + – 16fatigueSubsidiary reaction time devices + – 16, 87Subsidiary auditory reaction timetask (driver’s reaction to anacoustic signal)+ – 16Tests of persistence, Stroop+ + – 16effect, Critical Flicker FusionVideo recordings of driving + + + – 32Head nodding + + 87, 45Performance measures other than – – 16, 95driving relatedSecondary task measures + – 94Rating scales (ex: questionnaire) + + + – 16, 9544 <strong>VTI</strong> meddel<strong>and</strong>e 922A
Note: the summary only illustrates single factors. As pointed out before, manyauthors believe that only a combination of more factors can be used to predict<strong>drowsiness</strong> reliably (see for example Kipling [3]).+ →– →means that the measure is suitable to detect <strong>drowsiness</strong> or that automatic invehicleregistration is possible. If a measure has more than one + it isconsidered more suitable.means that the measure is not suitable to detect <strong>drowsiness</strong> or thatautomatic in-vehicle registration is not possible.<strong>VTI</strong> meddel<strong>and</strong>e 922A 45
Part two: Data Analysis10 The “Hök” projectThe ”Hök” study [46] was performed to examine the relationship between<strong>drowsiness</strong> <strong>and</strong> visual response, i.e. response to a r<strong>and</strong>omised visual stimulus. Thepurpose was to verify a connection between visual responsiveness <strong>and</strong> othermeasures for traffic safety related driver performance. In the Hök study, data from20 people were analysed, of which 10 were drowsy. The subjects of the experimentcompleted a two-hour drive on a road without oncoming traffic. The tensleep deprived test subjects had just completed their night shift on the night beforethe experiment <strong>and</strong> were brought to <strong>and</strong> from the simulator by taxi. The testsubjects that were not sleep deprived had had a normal night's sleep before theexperiment. Visual responsiveness was measured by introducing a yellow squareof the size 4x4 cm for 0.2 seconds in front of the driver. This was done 48 timesthrough the test. Each time, the driver was expected to respond as quickly aspossible by pressing any button on the steering wheel. In order to measure the testsubjects' subjective experience the KSS (Karolinska Sleepiness Scale) was used.Each test subject had to answer the question "How have you been feeling the past5 minutes?" every 5 minutes through the whole test session.Data from another study in the SAVE project [45] was also analysed but thedata from that study was incomplete because some test subjects were not able ocomplete the test drive as they were feeling too sleepy to continue driving.Collected dataIn the “Hök” study the lateral position was measured ten times per second duringa two-hour driving period. In the driving task the test-subject had to overtake afew cars <strong>and</strong> stop or give way for a few traffic situations. Data from theseovertakes etc. have been removed from the collected data (see figure 16). Thesemissing data will have the effect that various parts of the two-hour driving will notinclude the same amount of data. The first 900 seconds, 15 minutes of the testdriveare divided into five minute intervals, where the three intervals in thisspecific case (see figure 16) will contain 2076, 1776 <strong>and</strong> 2731 value points. If nodata were removed, each five minutes interval would contain 3000 value points.The calculations <strong>and</strong> the analysis in this report have taken account of thesedifferences in data amount.46 <strong>VTI</strong> meddel<strong>and</strong>e 922A
Figure 16 Lateral position of a driver from the “Hök” study. The plot is fromsubject number two first 900 seconds (15 minutes). The parts where there arestrait lines between two separated points contain no data. The lateral position ismeasured from the left-h<strong>and</strong> side of the lane with the negative direction towardsthe car.Lane tracking behaviour contra <strong>drowsiness</strong>The KSS (Karolinska Sleepiness Scale) is a 10-grade scale that has been validatedto be an accurate tool for measurements like <strong>drowsiness</strong>. The KSS is a subjectivescale <strong>and</strong> can not be detected by any instrument. The report concentrates onmeasures <strong>and</strong> methods that can be used to detect <strong>drowsiness</strong> or fatigue. Since theKSS can’t be detected by any instrument in an automated manner the KSS has notbeen consider in further discussions. The KSS has just been used as a referencetool to separate different subjects when it comes to <strong>drowsiness</strong>.In this report most of the analyses made on the “Hök” study will focus on therelationship between driving behaviour <strong>and</strong> <strong>drowsiness</strong>. Three examples aredescribed below.<strong>VTI</strong> meddel<strong>and</strong>e 922A 47
Example 1: subject number 2An initial analysis of the individual subjects driving behaviour may reveal somepossible indicators of connections between <strong>drowsiness</strong> <strong>and</strong> driving behaviour. Arelationship between <strong>drowsiness</strong> <strong>and</strong> lateral position can be detected on subjects’number two <strong>and</strong> 17 (both from the tired group). Subjects number two <strong>and</strong> 17 areexamples of drivers that have changes in lateral position through time. Thesesubjects have also higher amplitudes in the lateral position than others (higherSDLP). They are close to or are veering off more often than others.Figure 17 Lateral position, SDLP <strong>and</strong> estimated <strong>drowsiness</strong> for subjectnumber 2. The lateral position is measured with 10 Hz. The SDLP window is setto 30 seconds. The <strong>drowsiness</strong> was estimated every five minutes.For subject number two the estimated <strong>drowsiness</strong> is low when the subject startsdriving. When the driver gets tired, after 600 seconds, the SDLP starts to increase.From 600 seconds forwards, the SDLP increases <strong>and</strong> the SDLP <strong>and</strong> estimated<strong>drowsiness</strong> is high during a long period. After each time the driver have veeredoff, the driver seems to wake up for a few seconds before the SDLP increasesagain. After 5000 seconds the estimated <strong>drowsiness</strong> starts to decrease. The SDLPis also decreasing at the same time.48 <strong>VTI</strong> meddel<strong>and</strong>e 922A
Example 2, subject number 17Figure 18 Lateral position, SDLP <strong>and</strong> estimated <strong>drowsiness</strong> for subjectnumber 17. The lateral position is measured with 10 Hz. The SDLP window is setto 30 seconds. The <strong>drowsiness</strong> was estimated every five minutes.Subject number 17 has the highest SDLP values <strong>and</strong> amplitude in lateral positionof all. The SDLP for subject number 17 increases through the whole 2-hourperiod. The estimated <strong>drowsiness</strong> also seems to increase to some extent throughthe two hours. Note that subject number 17 does not use the whole KSS whenestimating his <strong>drowsiness</strong> even if the driver seems to be very tired (looking at theSDLP).<strong>VTI</strong> meddel<strong>and</strong>e 922A 49
Example 3, subject number 1Figure 19 Lateral position, SDLP <strong>and</strong> estimated <strong>drowsiness</strong> for subjectnumber 1. The lateral position is measured with 10 Hz. The SDLP window is setto 30 seconds. The <strong>drowsiness</strong> was estimated every five minutes.It is much harder to see any effect of SDLP <strong>and</strong> estimated <strong>drowsiness</strong> on thedriving behaviour of subject number 1. The SDLP does not fluctuate much even ifthe subject uses the whole KSS <strong>and</strong> becomes very tired at the end of the drivingperiod, looking at the estimated <strong>drowsiness</strong>. The estimated <strong>drowsiness</strong> can varywithout any variation in the SDLP. This is how it looks in most of the caseswhether the subject is from the tired group or not. Subject number two <strong>and</strong> 17 areexceptions that have higher <strong>and</strong> clearer values when it comes to lateral position.The correlation between estimated <strong>drowsiness</strong> <strong>and</strong> SDLP seems to be low. So isSDLP a bad indicator of <strong>drowsiness</strong> or is the rating scale a bad indicator of<strong>drowsiness</strong>? The KSS is validated, but is it useful as reference value for<strong>drowsiness</strong> in this context?50 <strong>VTI</strong> meddel<strong>and</strong>e 922A
11 Analysis of <strong>drowsiness</strong> ratingIn the report from the ”Hök” study [46], the variation in subjective <strong>drowsiness</strong>rating between tired <strong>and</strong> alert drivers was described as significant. Also, thedevelopment of <strong>drowsiness</strong> over time was significant. The tired subjects begin at ahigher average level of <strong>drowsiness</strong> compared to the alert subjects (see figure 20).The difference between the two groups is significant [F(1,12)=5.6, p=0.036]. Thechange over time is also significant [F(23,276)=24.43, p
12 Analysis of the st<strong>and</strong>ard deviation of thelateral position (SDLP)According to several prior investigations on <strong>drowsiness</strong> <strong>and</strong> vehicle <strong>control</strong>, thereis a close relationship between <strong>drowsiness</strong> <strong>and</strong> SDLP (st<strong>and</strong>ard deviation of thelateral position).With the ”Hök” data, it is possible to analyse SDLP thoroughly. Figure 21shows how SDLP increases over time for both tired <strong>and</strong> alert subjects. The meanvalue of the SDLP is calculated for every five-minute interval for the two groups.The change of SDLP over time is significant [F(23,414)=3.38, p
0,60,5SDLP (meters)0,40,30,2TiredAlert0,105 15 25 35 45 55 65 75 85 95 105 115MinutesFigure 22 SDLP increases over time for both tired <strong>and</strong> alert subjects.Figure 23 below shows how SDLP is affected for every five-minute period forevery subject. The figure demonstrates the two subjects’ large influence as peakson the mean value of SDLP.Figure 23 Demonstrates two subjects large influences as peaks on the meanvalue of SDLP. The subjects are divided into: tired group (1–10) <strong>and</strong> one alertgroup (11–20.) Subject number 17 is therefore shown as number nine in this plot.(Subject number two is number two in the graph as well).<strong>VTI</strong> meddel<strong>and</strong>e 922A 53
12.1 Regression analysisIn the report from the ”Hök” study, no regression analysis was made to findpossible relations between <strong>drowsiness</strong> <strong>and</strong> SDLP. Figure 24 below shows a plotfrom a regression analysis of a <strong>drowsiness</strong> scale with mean value of SDLP fortired drivers. The analysis showed that there is a relationship between increasing<strong>drowsiness</strong> <strong>and</strong> increasing SDLP (R 2 =0.67; R=0.82; B=7.74). The mean values ofthe <strong>drowsiness</strong> rating <strong>and</strong> SDLP are calculated for every five minutes during thetwo-hour drive.1098Tiredness76Predicted YTired5430,1 0,2 0,3 0,4 0,5 0,6 0,7mean SDLPFigure 24 Regression plot for tired drivers (<strong>drowsiness</strong> rating vs. mean SDLP).The R-square (R 2 ) value is an indicator of how well the modelfits the data (e.g., an R-square close to 1.0 indicates that wehave accounted for almost all of the variability with thevariables specified in the model). Usually, the degree to whichthe X variable is related to the Y variable is expressed in thecorrelation coefficient R, which is the square root of R-square.In multiple regression, R can assume values between 0 <strong>and</strong> 1.To interpret the direction of the relationship between variables,one looks at the signs (plus or minus) of the regression or Bcoefficients. If a B coefficient is positive, then the relationshipof this variable with the dependent variable is positive (e.g., thegreater the IQ the better the grade point average); if the Bcoefficient is negative then the relationship is negative (e.g., thelower the class size the better the average test scores). Ofcourse, if the B coefficient is equal to 0 then there is norelationship between the variables. The regression line(predicted Y) expresses the best prediction of the Y variable,given the X variable.54 <strong>VTI</strong> meddel<strong>and</strong>e 922A
As described in the previous section, there are two subjects in the group of tireddrivers that have a large influence on the SDLP. Figure 25 below shows the resultwhen these subjects are eliminated from the data. As can be seen, the largesteffect from this action is that the variation in SDLP is smaller but the degree oftiredness is hardly changed at all (R 2 =0.58; R=0.76; B=12.47).1098Tiredness76Predicted YTired5430,1 0,2 0,3 0,4 0,5 0,6 0,7mean SDLPFigure 25 Regression plot for tired drivers with the extreme subjects eliminated.(Drowsiness rating vs. mean SDLP).Figure 26 shows a plot from a regression analysis of <strong>drowsiness</strong> scale with meanvalue of SDLP for alert drivers. The analysis showed that there is a relationshipbetween increasing <strong>drowsiness</strong> <strong>and</strong> increasing SDLP (R 2 =0.88; R=0.94; B=28.6).The mean values of the <strong>drowsiness</strong> rating <strong>and</strong> SDLP are calculated for every fiveminutes during the two-hour drive.<strong>VTI</strong> meddel<strong>and</strong>e 922A 55
1098Tiredness76Predicted YAlert5430,1 0,2 0,3 0,4 0,5 0,6 0,7mean SDLPFigure 26 Regression plot for alert drivers (<strong>drowsiness</strong> rating vs. mean SDLP).In figure 27 below, both alert <strong>and</strong> tired drivers are represented in the sameregression plot (R 2 =0.76; R=0.87; B=11.8).1098Tiredness76Predicted YTiredAlert5430,1 0,2 0,3 0,4 0,5 0,6 0,7mean SDLPFigure 27 Regression plot for both alert <strong>and</strong> tired drivers.In figure 28 below, both alert <strong>and</strong> tired drivers are represented in the sameregression plot but with the two extreme subjects in the group of tired driversexcluded (R 2 =0.67; R=0.82; B=19.0).56 <strong>VTI</strong> meddel<strong>and</strong>e 922A
109Tiredness876Predicted YTiredAlert5430,1 0,2 0,3 0,4 0,5 0,6 0,7mean SDLPFigure 28 Regression plot for both alert <strong>and</strong> tired drivers without the extremesubjects.Conclusion:There is a relationship between increasing <strong>drowsiness</strong>, as measures by the KSSmethod, <strong>and</strong> increasing SDLP for both the group of tired drivers <strong>and</strong> the group ofalert drivers. The variation in SDLP for the group of tired drivers is smaller whenthe two extreme subjects are eliminated from the data. The <strong>drowsiness</strong> rating forthe tired drivers starts <strong>and</strong> ends at higher levels than for the alert drivers (seefigure 20).With the SAVE data from <strong>VTI</strong>, it was possible to make a similar regressionanalysis of the alertness versus the SDLP. However, in the SAVE study; only thetest leader rated the <strong>drowsiness</strong> of the subjects during the drive on a six-gradedscale. The subjects did not rate their own <strong>drowsiness</strong> while driving as in the”Hök” study. The analysis showed that there is a possible relationship betweendecreasing alertness <strong>and</strong> increasing SDLP. But the results had a low correlation(R=0.7). Probably because half of the driving sessions in the SAVE experimentdata were incomplete. Because of the incomplete data sets no conclusions can bedrawn, except that there are tendencies towards the same results as the analysismade on the data from the ”Hök” study a relationship between increasing<strong>drowsiness</strong> <strong>and</strong> increasing SDLP.<strong>VTI</strong> meddel<strong>and</strong>e 922A 57
13 Analysis of the mean value of the lateral positionFigure 29 shows the mean value of the lateral position for tired <strong>and</strong> alert subjectsin the “Hök” study, calculated for every five-minute period. The Y-scalerepresents the vehicles position measured from the middle line on the road to theleft side of the vehicle. The difference in lateral position between tired <strong>and</strong> alertdrivers is significant [F(1,18)=6.04, p=0.024]. As can be seen in figure 29, thetired subjects are closer to the middle line. A possible explanation is that on ahighway (which was the type of road used in the experiments), the driver thinks itis safer to drive closer to the middle line. There is a weak significance for changeof lateral position over time [F(23,414)=1.647, p=0.0313].2,52,42,3Lateral position (meters)2,22,121,91,81,7TiredAlert1,61,55 15 25 35 45 55 65 75 85 95 105 115MinutesFigure 29 Lateral position as a function of time for tired <strong>and</strong> alert subjects. TheY-scale represents the position of vehicles measured from the middle line on theroad to the left side of the vehicle.A egression analysis of mean values of the <strong>drowsiness</strong> rating <strong>and</strong> lateral positionfor tired <strong>and</strong> alert drivers was carried out. The analysis showed that there is nosignificant relationship between increasing <strong>drowsiness</strong> <strong>and</strong> increasing lateralposition. The mean values of the <strong>drowsiness</strong> rating <strong>and</strong> lateral position arecalculated for every five minutes during the two-hour drive.58 <strong>VTI</strong> meddel<strong>and</strong>e 922A
14 Times driver change directionA simple test to see how many times the subject turns, i.e. how many times thedriver change direction of the heading angle. In the figure it seems that thenumber of turns decreases in time through the two-hour period, see figure 30. Astatistic test could not show any difference between the groups. If the number ofturns would have any connection to <strong>drowsiness</strong> there should be a differencebetween the two groups. The reason for the decreasing values could depend onlearning factors.Figure 30 The number of turns each subject does during each five minutesinterval. Since there are different amount of data in each five minute interval thetimes the driver changes direction is divided by the amount of data points in eachfive minutes interval. Therefore the y-axis has a decimal value.<strong>VTI</strong> meddel<strong>and</strong>e 922A 59
15 Time to line crossing – TLCThere are different ways of calculating TLC. The most accurate way of doing it isto do a trigonometric calculation [99].The road curvature data are not available. When the sight is clear it is commonto shortcut over the other lane. The roads used in the test were relatively straightwith large curve radius. The first approximation is to divide the lateral positionwith the derivation of the lateral position (see equation box below). This is not ascorrect as the trigonometric way, but the final result does not change muchdepending on the method or approximations that have been done [99] (see alsoTime-to-Line Crossing on page 25 for a further discussion about TLC).Using the first derivation of the lateral position:Equation 1: d = (w l - w v )/2 - p ld = the distance between the outside edge of the vehicle’s tire <strong>and</strong> the edge of thelane boundary.p l = lateral position of the centreline of the vehicle relative to the centre of the lanew l = the width of the current lane.w v = the width of the subject vehicle.Equation 2: t l = d/v lv l = lateral velocity of the vehicle towards the edge of the lane.Since there are no data collected of the lateral velocity the derivation of thelateral position has been used.t l = look ahead time threshold. If vehicle is projected to cross boundary in lessthan this amount of time, trigger warning.Equation 3: v l = d´Equation 4: t l = d/d´60 <strong>VTI</strong> meddel<strong>and</strong>e 922A
A large number of previous studies have only looked at crossing over the righth<strong>and</strong> line. To be able to compare the results, the same method has been used inthis study. Therefore, the TLC definition does not include crossing over the lefth<strong>and</strong> line. No calculations have been done when the vehicle is moving towards theleft h<strong>and</strong> line.When simplifying the derivation of the lateral position the TLC will getdisplacement in time if compared with the trigonometric way [99].Figure 31 TLC over a 200 seconds period for one of the tired subjects (subjectnumber 2). The dotted plot describes the actual lateral position measured fromthe right-h<strong>and</strong> line (note that the dotted plot has been multiplied with a factor tento be more visible. The other plot shows the TLC. During this period the subjectcrosses the right h<strong>and</strong> line four times.The second approximation of TLC uses the rate of change of lateral velocity asadditional information in order to account for the non-linear movement of thevehicle path. In this, the rate of change of lateral velocity (second derivation of thelateral position) is applied as a correction factor by which the projected lateralvelocity is added to the present lateral velocity after one second. It is thenassumed that lateral velocity will not be constant.Studies have shown that there are small differences in the result depending onwhich of the three methods used. The various approximations in the equationswill make displacement in the TLC curve compared to the trigonometric way[99].To get a clearer view, over the changes in TLC over a 2-hour period, the linecrossings were counted. Each window was set to five minutes. In each fiveminutes window the line crossings (see figure 32) were counted (or how manytimes the subject was closer than a certain time limit from crossing the line). The<strong>VTI</strong> meddel<strong>and</strong>e 922A 61
window was updated every 30 seconds. The time limits were set to three <strong>and</strong> sixseconds from crossing the line.Figure 32 shows the characteristics of the different time limits for subjectnumber 17 during the two-hour period. This subject has been chosen because theSDLP changes a great deal during the two hours. Note that the TLC only countsthe crossings on the right h<strong>and</strong> side of the lane.Figure 32 A TLC analysis of subject number 17. The lower line describes thelateral position. The three upper lines shows how many times in each five minutesperiod the driver is crossing the right h<strong>and</strong> line or how many times the subject isthree or six seconds from crossing a line. The five minutes windows are updatedevery 30 seconds.It becomes harder to predict any crossings when the time limit is set to sixseconds. I.e. the plot showing “times crossing the line” <strong>and</strong> “times six secondsfrom crossing the line” is very different. It is no problem to predict a crossingwhen the vehicle is very close to the line, but when the time limit is set to sixseconds it is hard to see any differences between the first part where the SDLP islow <strong>and</strong> the last part where the SDLP has increased a lot. (SDLP <strong>and</strong> Estimated<strong>drowsiness</strong> for subject number 17 is showed in figure 18).62 <strong>VTI</strong> meddel<strong>and</strong>e 922A
The two groups where compared in order to see if the TLC has anything to dowith the <strong>drowsiness</strong>. As discussed before, it is statically shown that it is adifference in <strong>drowsiness</strong> between the two groups. It is stated that the group withpeople that suffered from <strong>drowsiness</strong> veered off the road more times than the alertdrivers. (50 to 1). But the figures below can give a hint of how the groups varied.Figure 33 The graph shows the mean value of how many times a person is twoseconds from crossing the line in each group.<strong>VTI</strong> meddel<strong>and</strong>e 922A 63
When studying the variations of the different individuals it is obvious that twotest-subjects in the group that are suffering from <strong>drowsiness</strong> are veering off theroad a lot more frequently than the others. The data from those two subjects whereremoved to see how much they influenced the result. After the data from subjectnumber two <strong>and</strong> 17 were removed the same study was done. Then it was not asobvious that it was a difference between the two groups, see figure 34.Figure 34 The graph shows the mean value of how many times a person is twoseconds from crossing the line in each group. In the tired group, data from twosubjects (2 <strong>and</strong> 17) has been removed. Both subjects are from the group thatsuffer from <strong>drowsiness</strong>.64 <strong>VTI</strong> meddel<strong>and</strong>e 922A
16 Frequency AnalysisAn analysis of the relationship between <strong>drowsiness</strong> <strong>and</strong> frequency variation inlateral position was also performed. All frequency analysis is made from the“Hök” study. The data from the SAVE study is not as homogeneous as the datafrom the “Hök” study. Therefore, most of the analysis is made on the “Hök”study.16.1 Fast Fourier TransformFast Fourier transforms are used to see if there are any differences in frequencyconnections through time or connections between frequency concentrations <strong>and</strong>estimated <strong>drowsiness</strong>.Fourier transform on one person through timeTo eliminate infinite low frequencies in the Fourier transforms the lateral positionwere divided by the mean lateral position for each five minutes period. The powerspectral density varied a great deal between individual subjects. For one subjectthe power spectral density can also differ over time for the two-hour period. Seefigure 35 <strong>and</strong> fiugre 36.Figure 35 Fast Fourier transform analyses for each five minutes interval for testsubjectnumber one (from the group with tired people).<strong>VTI</strong> meddel<strong>and</strong>e 922A 65
Figure 36 Fast Fourier transform analyses for each five minutes period for testsubjectnumber two (from the group with tired people).66 <strong>VTI</strong> meddel<strong>and</strong>e 922A
The large power variation between individual subjects (<strong>and</strong> time periods) makes itdifficult to detect any frequency concentrations. The power may hide possiblefrequency concentrations. To reduce the power differences the power in each timeinterval were divided by the total power of the same interval. By doing so, thetotal power in each five minutes interval becomes the same. If an alert subjectwould have another typical frequency in his driving behaviour the peaks of theFourier curves for tired <strong>and</strong> alert subject would be separated. No differences infrequency peaks can be seen. See figure 37.Figure 37 Fourier analysis on subject number two over 24 five minute periods,i.e. two hours. The power in each interval is divided by the total power in eachinterval. By doing so the intervals will have the same amount of power in eachinterval. This is data from the same subject as in figure 36.<strong>VTI</strong> meddel<strong>and</strong>e 922A 67
Still, there are a great number of variations <strong>and</strong> noise. The noise may depend onthe small amount of data in each five minutes interval (see figure 38). There arenot enough turns/waves during this period to detect the strongest frequency. Anequal test as above was done where the two hours where divided into 15 minuteintervals. These Fourier curves were compared to the mean estimated <strong>drowsiness</strong>value of the same interval. The result did not become clearer than the over fiveminute intervals.Figure 38 Shows the lateral position variation over a five minutes period. Thelateral position is measured from the middle line of the road. As seen in the figureno overtakes have been done during this interval <strong>and</strong> therefore no data have beenremoved.Figure 38 exemplifies how many waves were included in a five minutes interval.This is probably too few to get a reliable result from the Fourier analysis.68 <strong>VTI</strong> meddel<strong>and</strong>e 922A
Fourier transform on the two groupsIt is shown that there are differences in estimated <strong>drowsiness</strong> between the twogroups drowsy / not drowsy (see 2.1 Analysis of <strong>drowsiness</strong> rating). Comparingthe two groups will make it possible to use the whole two hours period for Fourieranalysis. When the two groups were compared without any power reduction, thegroup with tired drivers had more power, see figure 39. As showed before, thereare differences in power spectral density between different subjects. Subjects inthe group that suffer from <strong>drowsiness</strong> have a higher power spectral density thanthe other group since the group that suffers from <strong>drowsiness</strong> has a higher SDLP.Figure 39 A Fourier analysis done on the two groups. No reduction of power inany intervals.<strong>VTI</strong> meddel<strong>and</strong>e 922A 69
The <strong>drowsiness</strong> group had a higher amount of power. Thus, each graph wasdivided by the power spectral density in each interval. For the same reason thepower was reduced when testing one person over time. The power difference hasto be eliminated to easier detect any frequency variations. The result is shown infigure 40.Figure 40 A Fourier analysis done on the two groups, with power reduction.Dotted line describes the group of people that suffer from <strong>drowsiness</strong>. Since eachchart is divided by the area under each chart the y-axis does not show the realpower spectral density values.No frequency differences could be found between tired <strong>and</strong> alert drivers. There isno significant difference between the two groups, (F=1,15; p < 0,29).In the Fourier analysis done so far, the first tests have been designed to studyone person to see how the data change during the two hour driving period <strong>and</strong>compare this with the drivers estimated <strong>drowsiness</strong>. The other tests have beendesigned to study the data differences between the two groups. Since theestimated <strong>drowsiness</strong> between the two groups is statistically proved. See figure20.70 <strong>VTI</strong> meddel<strong>and</strong>e 922A
16.2 Power Spectrum estimate via Burg's methodThe same “Hök” data were analysed with Burg’s method to see if the noise in thedata could be eliminated. The method reduces some of the noise. The primaryadvantages of the Burg method are resolving closely spaced sinusoids in signalswith low noise levels, <strong>and</strong> estimating short data records in which case the AR(autoregressive) power spectral density estimates are very close to the true values.In addition, the Burg method ensures a stable AR model <strong>and</strong> is computationallyefficient [96]. However, this method did not reveal any significant correlations<strong>and</strong> therefore no deeper studies have been made with this method.16.3 Power Spectrum estimate via MUSIC eigenvectormethodThe music method was used for the same reason as the Burg method but withsimilar negative result. The MUSIC method is frequency estimator techniquebased on eigenanalysis of the autocorrelation matrix. This type of spectral analysiscategorizes the information in a correlation or data matrix, assigning informationto either a signal subspace or a noise subspace. This method is similar to Burg’smethod <strong>and</strong> has not shown any benefits for this study. There are a number ofst<strong>and</strong>ard filters to Fourier analysis of this kind.16.4 Short time frequency transformFinally, it is worth mentioning that there are alternative methods for Fourieranalysis of non-stationary signals, based on a joint time-frequency signalrepresentation that can be used to analyse these types of data. E.g. there are somemethods of using short time transforms, for instance Choi-Williams distribution orWigner-Ville distribution. Short time frequency transform could reveal single“high” one-time frequencies at a certain time. It is a compromise between the time<strong>and</strong> the frequency view of a signal, <strong>and</strong> is thereby better suited for analysis ofnon-stationary signals than the ordinary Fourier Transform is [97]. When driving<strong>and</strong> suffering from <strong>drowsiness</strong>, the steering pattern may change. Some of thosepatterns may not be discovered in the ordinary Fourier Transform. This is one ofthe areas where deeper studies could reveal some interesting results in drivingbehaviour for people suffering from various degrees of <strong>drowsiness</strong>. However nosuch deeper analysis have been done within the frame of this report.<strong>VTI</strong> meddel<strong>and</strong>e 922A 71
17 The “SAVE” projectSAVE was an acronym for System for effective Assessment of the driver <strong>and</strong><strong>Vehicle</strong> <strong>control</strong> in Emergency situations. In a critical traffic situation (due to<strong>drowsiness</strong>, inattention, alcohol or illness), the SAVE system was intended towarn the driver or take over the <strong>control</strong> of the vehicle if the driver did not respondproperly to a warning or depending on the severity of the particular situation.The SAVE system registered the steering wheel angle; lateral position <strong>and</strong> eyeblink frequency. These measures were processed to create an indicator, which wasused as predictor of progressing <strong>drowsiness</strong> <strong>and</strong> declining driving performance.The core in the SAVE system was a neural network.One of the evaluating experiments in the SAVE project was made at <strong>VTI</strong>. Theaim was to evaluate the performance of the trained SAVE system regarding itscapacity to detect driver impairment caused by alcohol or <strong>drowsiness</strong>. Two withinsubject studies were performed; one on effects of <strong>drowsiness</strong> <strong>and</strong> the other oneffects of alcohol were conducted [45].In the <strong>drowsiness</strong> study, a number of differences were found between the<strong>drowsiness</strong> condition <strong>and</strong> the <strong>control</strong> condition. Ratings by the test leadersindicated that <strong>drowsiness</strong> was pronounced during the long drive in the <strong>drowsiness</strong>condition compared to the <strong>control</strong> condition. Some performance measures alsoshowed a marked difference between the two conditions. SDLP was clearlyincreasing towards the end of the <strong>drowsiness</strong> driving condition. Similarly, whenthose subjects who veered off the road were studied separately, the lateral positiondeviation was markedly increased before veering off in comparison to the <strong>control</strong>condition. St<strong>and</strong>ard variation of steering wheel position was somewhat largertowards the end of the drive in the <strong>drowsiness</strong> condition than in the <strong>control</strong>condition. No differences between the <strong>drowsiness</strong> condition <strong>and</strong> the <strong>control</strong>condition were found for average speed, speed variation, average lateral positionor time to collision. In the alcohol study no effects were found.During the “Save”-study a lot of subjects did not complete the whole test drivefor the sleep-deprived condition. Thus, as mentioned before, the SAVE data istherefore very difficult to analyse <strong>and</strong> subsequently the main data analyses havebeen carried out with data from the “Hök”-study.17.1 Analysis of progression in time before driving off theroadThe following section is an extract from a report in the SAVE project [45]. Anumber of experiments were carried out in the SAVE project apart from the <strong>VTI</strong>experiment discussed earlier. In an driving simulator experiment conduced atTNO it was found that impairment-related driving behaviour variables showedclear effects of the period before the off-the-road event (Table 1). Some timebefore the driver moves off-the-road the SDLP increases, the average of minimumdistances to the right lane boundary (DIS min ) decreases <strong>and</strong> the minima time-tolinecrossing (TLC min ) decrease as well. This suggests that some time in advanceof the ‘accident’ the driver drifts to the right.72 <strong>VTI</strong> meddel<strong>and</strong>e 922A
Table 9 Average value of dependent variables over blocks of 30 secondspreceding off-the-road events. 0=0–30 s after the event, 1=0–30 s before,2=30–60 s before, 3=60–90 s before, 4=90–120 s before, 5=120–150 s before.F5–1 indicates the F-ratio <strong>and</strong> significance for the effect of time 5 to 1 (timebefore the event), while F1–0 indicates the F-ratio <strong>and</strong> significance for the effectof time 1 to 0 (time just before the event vs. just after the event). In a one-wayANOVA (Analysis of Variance), the F-ratio is computed. The F-ratio is defined asthe mean square between (the variance between the means of each data set)divided by the mean square within (the mean of the variance estimates). * meanssignificant at a p-value of 0.05, ** means significant at a p-value of 0.01.Variable 5 4 3 2 1 0 F5–1 F1–0SDLP 0.294 0.292 0.297 0.308 0.344 0.463 ** 10.48 * 9.58DIS min 0.423 0.377 0.391 0.270 –0.110 0.070 ** 54.97 * 6.60TLC min 3.232 3.262 3.141 2.852 2.884 2.768 * 3.51 0.33Some conclusions <strong>and</strong> discussions based on the information presented in thereport:Driving performance measures, i.e. SDLP, DIS min <strong>and</strong> TLC min , are reliablepredictors of serious errors (driving off-the-road), from about one to two minutesbefore the accident. This suggests that before an accident happens, <strong>drowsiness</strong> isalready so far advanced that there is no longer sufficient error correction toprevent an accident, <strong>and</strong> the driver drifts to the right lane boundary, no longeraware of the need for a steering correction. However, the error is followed by asteering correction, as can be seen form the strong effect of the occurrence of theerror on the steering wheel related measures.Measuring steering velocity is relatively easy if compared to other measuressuch as eyelid closures <strong>and</strong> lateral position or TLC. Measuring eye closuresrequires at least a camera <strong>and</strong> may be sensitive to artefacts <strong>and</strong> individualdifferences in eye blinking behaviour. Measuring lateral position <strong>and</strong> TLCrequires a lane-tracking device <strong>and</strong> is sensitive to vehicle manoeuvres such as lanechanges. Also it requires white lines on the road. Steering velocity by errorcorrection may be less sensitive to type of road or manoeuvres. The resultssuggest that this measure is a robust <strong>and</strong> reliable predictor of <strong>drowsiness</strong>-relateddriver impairment that adds predictive power to the eyelid closure measures <strong>and</strong>lateral position.The SAVE study does not include the amount of large peak-to-peak steeringamplitudes with could be an indicator of <strong>drowsiness</strong> in this discussion. When asubject becomes tired the steering wheel amplitudes become higher <strong>and</strong> the timebetween these peaks increases. Van Winsum [98] states that steering correctionsare reliable indicators progressing driver impairment due to <strong>drowsiness</strong>.<strong>VTI</strong> meddel<strong>and</strong>e 922A 73
18 SummaryThe original data from the ”Hök” report [46] is somewhat different from the dataanalysed in this project. There were overtaking situations included in the drivingtask used in the “Hök” study. These situations have been removed in the data setthat was analysed here. The reason to this was that we focused primarily on lateralvehicle <strong>control</strong>.18.1 Drowsiness ratingThe Karolinska Sleepiness Scale (KSS), which was used to estimate the driver’ssleepiness, has been validated in several studies. But still, according to the dataanalyses, there can be large performance differences between two subjects thathave estimated the same “amount" of sleepiness. How sensitive the KSS is in therange where the subject is staring to get “dangerously” tired might be questioned.Only a few extreme subject where driving poorly when they where tired accordingto the KSS-scale.18.2 SDLP – St<strong>and</strong>ard Deviation of the Lateral PositionSeveral studies have shown that increased SDLP correlates with increased<strong>drowsiness</strong>, prolonged driving <strong>and</strong> the risk of driving off the road [44]. Thispreliminary investigation has shown similar results. This corresponds well withwhat de Waard described in his thesis [47]. However, no statistically significantdifference between the group of tired <strong>and</strong> alert subjects in SDLP could be foundhere. With increased <strong>drowsiness</strong> the within-group variation increases <strong>and</strong> nostatistical differences between the groups could be found.In the report from the ”Hök” study [46] the results from the analysis of SDLPconforms to our findings in matters of no difference between the group of tired<strong>and</strong> alert subjects in SDLP. On the other h<strong>and</strong>, there is no change in SDLP overtime according to the ”Hök” report.18.3 Lateral positionAccording to other studies on <strong>drowsiness</strong> driving a common finding is that tireddrivers drive closer to the right edge line [44]. One general theory concerning thisbehaviour is that the driver feels safer driving closer to roadside than closer to themiddle because of the risk of oncoming traffic.Interestingly, our investigation shows a contradictory result. Instead, theanalysis showed that the drivers drove closer to the middle line as the got tired.One possible explanation is that on a highway (which actually was the type ofroad used in the experiments), a tired driver thinks it is safer to drive closer to themiddle line due to the fact there is no oncoming traffic.In the ”Hök” the conclusion was that a tired driver drives closer to the rightedge line. This result was first very confusing because our results pointed in theopposite direction. After all - the data was generated from the same experiment.During our discussions with one of the authors, we draw the conclusion that the”Hök” result as presented in their report was inaccurate. Some mistakes must havebeen made in their analysis <strong>and</strong> interpretation of the results.74 <strong>VTI</strong> meddel<strong>and</strong>e 922A
18.4 Time to Line Crossing – TLCIn a study by Verwey <strong>and</strong> Zaidel [52] it was found that TLC is a promisingpredictor for driver impairment induced by <strong>drowsiness</strong>. TLC is defined as the timeleft until a moving vehicle crosses either side of the lane boundaries (white lines)under the assumption that the vehicle continues along the same travel path withthe current momentary motion. TLC seems to be a good cue to determine adriver’s lateral safety margins. To calculate the real TLC, road geometry data areneeded. However, in this study only lateral position data were available.Subsequently, we had to use approximations to calculate TLC. For the analysisconducted in this project it is no possible to determine the potential in using theTLC measure in this area. However, we could not find that TLC could be used ona group level to predict fatigue induced impaired driving. Furthermore, whendetecting that the driver is to close to the line it is often too late to warn the driveretc. Finally, looking at the TLC when the driver is relatively far from the laneboundaries makes the TLC calculation inaccurate.18.5 Spectral analysis of Lateral PositionThe results from the analysis of lateral position frequency conform to the resultfrom the literature study. The frequency variation was not related to the rated<strong>drowsiness</strong>, while the amplitude of the spectral components showed association toit. We suggest that further studies should focus on modern mathematical spectralanalysis techniques, such as short time frequency transform <strong>and</strong> Wavelets.18.6 Possible measuresBelow is a table that shows a summary of measures possible to use with the givenpreferences in the previous data analysis section. Advantages <strong>and</strong> disadvantagesof the measures when used for detection of <strong>drowsiness</strong> in simulated driving aredescribed shortly.Table 10 Summary of possible measures to detect drowsy driving conditions.Measure Advantage DisadvantageLateral position <strong>and</strong> SDLP A measure that may changewith increasing <strong>drowsiness</strong>Steering movementsTLCSome steering variables arerelated to the amount of<strong>drowsiness</strong> (s.8–10)A measure that may changewith increasing <strong>drowsiness</strong>Difficult to see significantdifferences between tired <strong>and</strong>alert driversRoad geometry influence theresultRoad geometry may influencethe result. Difficult to calculatein real-time.The purpose was to find a method to predict when the driver is starting to drivepoorly <strong>and</strong> not to detect when the driver is drowsy. Such a method would then beused in order to investigate if a possible negative effects of a Vision EnhancementSystem on driver’s level of <strong>drowsiness</strong>. Signs of <strong>drowsiness</strong> might precedeimpaired driving behaviour. When a driver becomes drowsy is very individual.The main focus should be on how the driver h<strong>and</strong>les the car <strong>and</strong> not when he istired.<strong>VTI</strong> meddel<strong>and</strong>e 922A 75
The results from the data analysis correspond generally to the results of theliterature study in the first part of the report: a single driving performancemeasure, like lateral vehicle position, is not sufficient to reliably detect<strong>drowsiness</strong> <strong>and</strong> predict impaired driving behaviour. There is a clear need tofurther investigate the problem before a sufficiently reliable system can bepresented on the market.76 <strong>VTI</strong> meddel<strong>and</strong>e 922A
19 References1. Wierwille, WW & Wreggit, SS & Mitchell, MW: Research on <strong>Vehicle</strong>-Based Driver Status/ Performance Monitoring. First Semi-AnnualResearch Report. NHTSA Cooperative Agreement Number DTNH 22-91-Y-07266. Virginia Polytechnic Institute <strong>and</strong> State University, April 1992.2. Vallet, M & Fakhar, S & Olivier, D & Baez, D: Detection <strong>and</strong> Control ofthe Degree of Vigilance of Drivers. Proceedings of the 13 th InternationalConference on Experimental Safety <strong>Vehicle</strong>s, Paris, November 4–11, 1991.(DOT HS 807 990, July, 1993).3. Knipling, RR & Wierwille, WW: <strong>Vehicle</strong>-based Drowsy DriverDetection: Current Status <strong>and</strong> Future Prospects. Proceedings of IVHSAmerica, pp. 245–256, April 1994.4. Storie, VJ: Involvement of Good <strong>Vehicle</strong>s in <strong>and</strong> Public Service <strong>Vehicle</strong>sin Motorway Accidents. 1113, UK Department of Transport; Transport <strong>and</strong>Road Research Laboratory, 1984.5. O’Hanlon, JF: That is the Extent of the Driving Fatique Problem?EUR6065EN; Commission of the European Communities, 1978.6. www.nhtsa.dot.gov/people/ncsa/June 20017. Knipling, RR & Wang, JS: Revised Estimates of the US Drowsy DriverCrash Problem Size Based on General Estimates Systems CaseReviews. Proceedings of the 39 th Annual Association for the Advancementof Automotive Medicine. Chicago, Illinois.8. NHTSA, 1996: Traffic Safety Facts-1995. National Center For Statistics<strong>and</strong> Analysis, National Highway Safety Administration, U.S. Department ofTransportation, Washington, DC 20590.9. Maycock, G: Driver Sleepiness as a Factor in Car <strong>and</strong> HGV Accidents.1995; Technical Report 169. Crowthorne, UK: Transport <strong>and</strong> ResearchLaboratory.10. Horne, JA & Reyner, LA: Falling Asleep at the Wheel. 1995. TRL Report168. Crowthorne, UK: Transport Research Laboratory.11. Hartley, L & Horberry, T & Mabbott, N & Krueger, GP: Review of FatigueDetection <strong>and</strong> Prediction Technologies. September 2000. Melbourne:National Road Transport Commission. ISBN: 0 642 54469 7.www.nrtc.gov.au/publications/report-50.asp?lo=public July 200112. Fatigue <strong>and</strong> Driving: Driver Impairment, Driver Fatigue <strong>and</strong> DrivingSimulation. The Role of Fatigue Research in Setting Driving HoursRegulations. Laurence Hartley (Editor). ISBN: 0748402624. Publisher:London, Taylor & Francis, Inc. Pub. Date: January 1995, pp. 41–47.13. Encyclopædia Britannica.14. University of Maryl<strong>and</strong> Medicine, Medical Encyclopedia.http://umm.drkoop.com/conditions/ency/article/003208.htm July 2001<strong>VTI</strong> meddel<strong>and</strong>e 922A 77
15. Tepas, DI & Paley, MJ: Managing Alertness <strong>and</strong> Fatigue in AdvancedIVHS. Proceedings of the IVHS America 1992 Annual Meeting. pp.785–789, 1992.16. Haworth, NL & Triggs, TJ & Grey, EM: Driver Fatigue: Concepts,Measurement <strong>and</strong> Crash Countermeasures. Federal Office of Road Safety -Contract Report 72 (Performing Organisation Human Factors Group,Department of Psychology, Monash University), 1988.www.general.monash.edu.au/muarc/rptsum/escr72.htm July 200117. Fatigue <strong>and</strong> Driving: Driver Impairment, Driver Fatigue <strong>and</strong> DrivingSimulation. Methodological Issues in Driver Fatigue Research. LaurenceHartley (Editor). ISBN: 0748402624. Publisher: Taylor & Francis, Inc. Pub.Date: January 1995, pp. 151–166.18. Dinges, DF: An Overview of Sleepiness <strong>and</strong> Accidents. Journal of SleepResearch 1995; 4(2):4–14.19. Renner, G & Mehring, S: Lane Departure <strong>and</strong> Drowsiness -Two MajorAccident Causes - One Safety System. Transport Research Laboratory,TRL Report 220, 1997.20. Bunji, A: Evaluation of Mental Condition on Drivers by Analysis ofHeart Rate Variability. Journal of the Society of Automotive Engineers ofJapan No. 9437601, 1994.21. Fatigue <strong>and</strong> Driving: Driver Impairment, Driver Fatigue <strong>and</strong> DrivingSimulation. Fatigue <strong>and</strong> Alcohol: Interactive Effects on HumanPerformance. Laurence Hartley (Editor). ISBN: 0748402624. Publisher:Taylor & Francis, Inc. Pub. January 1995, pp. 189–205.22. Stern, J: Eye Activity Measures of Fatigue, <strong>and</strong> Napping as a Countermeasure.USDOT Technical Report. FHWA-MC-99-028 Jan. 1999; 26.23. www.fmcsa.dot.gov/safetyprogs/research/driverfatigue.htm July 200124. Wierwille, WW & Ellsworth, LA: Evaluation of Driver Drowsiness byTrained Raters. Accident Analysis <strong>and</strong> Prevention 1994; 26: 571–581.25. Obara, H & Kenada, M & Koreishi, J & Shirato, R: Nissan’s AdvancedSafety <strong>Vehicle</strong>. Proceedings of the 4 th world Congress on IntelligentTransport Systems. 1997. Berlin, Germany.26. Smith, P & Shah, M & Lobo, NV: Monitoring Head/Eye Motion forDriver Alertness with One Camera. 15 th IEEE International Conferenceon Pattern Recognition, September 3–8, 2000.Barcelona, Spain.27. Dillies-Peltier, MA: Driver Vigilance Decrease Detection: A Real-Time,Driver Adaptive On-Board System. Proceedings of the 4 th WorldCongress on Intelligent Transport Systems. 1997. Berlin, Germany.28. Wierwille, WW & Ellsworth, LA & Wreggit, SS & Fairbanks, RJ &Kirn CL: Research on <strong>Vehicle</strong>-Based Driver Status/PerformanceMonitoring: Development, Validation, <strong>and</strong> Refinement of Algorithmsfor Detection of Driver Drowsiness. National Highway Traffic SafetyAdministration Final Report: DOT HS 808 247, 1994. (October 1998.Publication No. FHWA-MCRT-98-006)78 <strong>VTI</strong> meddel<strong>and</strong>e 922A
29. PERCLOS: A Valid Psychophysiological Measure of Alertness asAssessed by Psychomotor Vigilance – TechBrief FHWA-MCRT-98-006,October 1998. www.fmcsa.dot.gov/pdfs/tb98-006.pdf July 200130. Grace, R & Byrne, VE & Bierman, DM et al: A Drowsy Driver DetectionSystem for Heavy <strong>Vehicle</strong>s. Proceedings of the 17 th Digital AvionicsSystems Conference, Vol. 2, 2001, pp. I36/1 – I36/8.www.ri.cmu.edu/pub_files/pub2/grace_richard_2001_1/grace_richard_2001_1.pdf July 200131. www.jhuapl.edu/ott/technology/DDDS/ July 200132. Wylie, CD & Shultz, T & Miller, JC et al: Commercial Motor <strong>Vehicle</strong>Driver Fatigue <strong>and</strong> Alertness Study. Technical summary. Essex Corporation,November 1996. TP report number 12876E.www.tc.gc.ca/TDC/publicat/tp12876/english/12876_e.htm July 200133. Mimuro, T & Miichi, Y & Maemura, T & Hayafune, K: MitsubishiAdvanced Safety <strong>Vehicle</strong> (ASV). Proceedings of the 4 th World Congresson Intelligent Transport Systems. 1997. Berlin, Germany.34. Toshiaki Matsumoto & Yoshihito Hori: Toyota Advanced Safety <strong>Vehicle</strong>(Toyota ASV). Proceedings of the 4 th World Congress on IntelligentTransport Systems. 1997. Berlin, Germany.35. Petit, C & Chaput, D & Tarriere, C & Le Coz, JY & Planque, S: Researchto Prevent the Driver from Falling Asleep Behind the Wheel.Proceedings of the 34 th Annual Conference of the Association for theAdvancement of Automotive Medicine, 1990. Arizona, USA.36. Yabuta, K & Iizuka, H & Yanagishima, T & Kataoka, Y & Seno, T: TheDevelopment of Drowsiness Warning Devices. Proceedings 10 thInternational Technical Conference on Experimental Safety <strong>Vehicle</strong>s,Washington, 1985, USA.37. Artaud, P & Planque, S & Lavergne, C & Cara, H & de Lepine, P &Tarriere, C & Gueguen, B: An On-board System for Detecting Lapses ofAlertness in Car Driving. Proceedings of the 14 th International Conferenceon Enhanced Safety of <strong>Vehicle</strong>s, 1994, Vol. 1, Munich, Germany.38. Haworth, NL: Fatigue Detection in Trucks in Normal Operations.International Technical Conference on the Enhanced Safety of <strong>Vehicle</strong>s,1996, Melbourne, Australia.39. Lavergne, C & De Lepine, P & Artaud, P et al: Results of the FeasibilityStudy of a System for Warning of Drowsiness at the Steering WheelBased on Analysis of Driver Eyelid Movements. Proceedings of the 15 thInternational Technical Conference on the Enhanced Safety of <strong>Vehicle</strong>s,1996, Vol. 1, Melbourne, Australia.40. Dingus, TA & Hardee, LH & Wierwille, WW: Detection of Drowsy <strong>and</strong>Intoxicated Drivers Based on Highway Driving Performance Measures.1985; IEOR Department Report #8402. <strong>Vehicle</strong> Simulation Laboratory,Human Factors Group. Virginia Polytechnic Institute <strong>and</strong> State University,Blacksburg, Virginia.<strong>VTI</strong> meddel<strong>and</strong>e 922A 79
41. Peters, RD & Kloeppel, E & Alic<strong>and</strong>ri, E: Effects of Partial <strong>and</strong> TotalSleep Deprivation On Driving Performance. US Department ofTransportation, Federal Highway Administration, 1999. Publication No.FHWA-RD-94-046.www.tfhrc.gov/humanfac/sleep/sleepweb.htm July 200142. Klein, RH & Allen, RW & Miller, JC: Relationship Between Truck RideQuality <strong>and</strong> Safety of Operations: Methodology Development.Hawthorne, CA: Systems Technology, Inc. 1980, NTIS: DOT HS 805 494.43. Allen, RW & O’Hanlon, JF: Effects of Roadway Delineation <strong>and</strong>Visibility Conditions on Driver Performance. Transportation Record 739.Transportation Research Board. US National Academy of Sciences,Washington DC, 1979.44. Sagberg, F: Road Accidents Caused by Drivers Falling Asleep. AccidentAnalysis <strong>and</strong> Prevention 1999; 31: 639–649.45. SAVE: System for Effective Assessment of the Driver State <strong>and</strong> <strong>Vehicle</strong>Control in Emergency Situations. Transport Telematics Project N°: TR1047. Commission of the European Communities – R&D programmeTelematics Systems in the Area of Transport, 1998.46. System för fordonsförares uppmärksamhet och vakenhet. Vägverketpublikation 1999: 169. ISSN 1401-9612.47. De Waard, D: The Measurement of Drivers' Mental Workload. 1996.PhD thesis, University of Groningen. Haren, The Netherl<strong>and</strong>s: University ofGroningen, Traffic Research Centre. available at:http://www.home.zonnet.nl/waard2/mwl.htm August 200148. Brookhuis, KA & De Waard, D: The Use of Psychophysiology to AssessDriver Status. Ergonomics 1993; 36: 1099–1110.49. Skipper, JH & Wierwille, WW & Hardee, L: An Investigation of Low-Level Stimulus-Induced Measures of Driver Drowsiness (IEORDepartment Report #8402). 1984. <strong>Vehicle</strong> Simulation Laboratory, HumanFactors Group. Virginia Polytechnic Institute <strong>and</strong> State University,Blacksburg, Virginia.50. Godthelp, H & Milgram, P & Blaauw, GJ: The Development of a Time-Related Measure to Describe Driving Strategy. Human factors 1984;26(3): 257–268.51. Van Winsum, W & De Waard, D & Brookhuis, KA: Lane ChangeManoeuvres <strong>and</strong> Safety Margins. Transportation Research Part F, 2; 1999,139–149.52. Verwey, WB & Zaidel, D: Predicting Drowsiness Accidents fromPersonal Attributes, Eye Blinks, <strong>and</strong> Ongoing Driving Behaviour.Report TM-97-B009. 1997; Soesterberg. TNO Human Factors ResearchInstitute, The Netherl<strong>and</strong>s.53. Van Winsum, W & Brookhuis, KA & De Waard D: A Comparison ofDifferent Ways to Approximate Time-to-Line Crossing (TLC) DuringCar Driving, Accident Analysis <strong>and</strong> Prevention 2000, 32 (1): 47–56.80 <strong>VTI</strong> meddel<strong>and</strong>e 922A
54. Chiu-Geng, Lin: Lane Sensing <strong>and</strong> Path Prediction for Preventing RoadDeparture Accidents. Ph.D. Thesis. University of Michigan, 1995.55. Batavia, PH: Driver-Adaptive Lane Departure Warning Systems. Ph.D.Thesis, September 1999. CMU-RI-TR-99-25. The Robotics Institute;Carnegie Mellon University, Pittsburgh, Pennsylvania, USA.56. Pomerleau, D & Jochem, T & Thorpe, C et al: Run-Off-Road CollisionAvoidance Using IVHS Countermeasures. U.S. Department ofTransportation. National Highway Traffic Safety Administration. ReportDOT HS 809 170. December 1999.57. Batavia, P & Pomerleau, D & Thorpe, C: Predicting Lane Position forRoadway Departure Prevention. Proceedings of the IEEE Intelligent<strong>Vehicle</strong>s Symposium, IEEE, October, 1998.www.ri.cmu.edu/pubs/pub_470.html July 200158. Moreno, C & Gou, M & Boukas, EK & Laberge-Nadeau, C: TransparentDrivers Drowsiness Detection: An Approach. Proceeding of the 27thISATA conference, 1996.www.mochima.com/articles/driver-<strong>drowsiness</strong>-detection.html July 200159. Highway Industry Development Organization.http://www.hido.or.jp/ITSHP_e/wi/itshb/Zigzag.htm August 200160. Intelligent Transportation Systems H<strong>and</strong>book 2000–2001.http://www.its.go.jp/ITS/2000HBook/chapter4/4-7e.html August 200161. Dinges, DF & Whitehouse, WG & Orne, EC & Orne, MT: The Benefits ofa Nap During Prolonged Work <strong>and</strong> Wakefulness. Work <strong>and</strong> Stress 1998;2: 139–153.62. www.sleepydriver.com/ June 200163. www.zzzzalert.com/info.html July 200164. www.premiersystems.com/market June 200165. www.assistware.com July 200166. http://detnews.com/AUTOS/1101/lead.htm June 200167. Ogawa, K & Okumura, T: Development of a Drowsiness DetectionSystem. Proceedings of the 5 th World Congress on Intelligent TransportSystems. October 1998, Seoul, Korea. Paper nr. 4072.68. Ogawak, Shimotani, M: A Drowsiness Detection System. MitsubishiElectric ADVANCE, Technical Report. March 1997.69. www.daimlerchrysler.com/index_e.htm?/specials/drawbar/drawbar4_e.htmJuly 200170. http://media.siemensauto.com/mediacenter2/queries/releasefull.phtml?prjob_num=1094 July 200171. www.retdmag.renault.com/en/htm/biblio/savoir/article.cfm?ArtIdx=501&FromPage=theme July 200172. www.ensera.com/Feb%20news/0219-1.htm July 2001<strong>VTI</strong> meddel<strong>and</strong>e 922A 81
73. The International Society for Optical Engineering. OE Reports, PatentBriefs, December 1998.http://spie.org/web/oer/december/dec98/patent.html July 200174. www.uspto.gov/patft/index.html July 2001.75. Brown, ID: Prospects for Technological Countermeasures AgainstDriver Fatique. Accident Analysis <strong>and</strong> Prevention 1997;29: 525–531.76. Folkard, S & Åkerstedt, T: A Three-Process Model of the Regulation ofAlertness-Sleepiness. Broughton RJ, Ogilvie RD, eds. Sleep, Arousal, <strong>and</strong>Performance. Boston, Basel, Berlin: Birkhäuser, 1992;11–26.77. Åkerstedt, T & Folkard, S: Validation of the S <strong>and</strong> C Components of theThree-process Model of Alertness Regulation. Sleep 1995; 18: 1–6.78. Horne, JA & Reyner, LA: Sleep Related <strong>Vehicle</strong> Accidents. BritishMedical Journal 1995; 310: 565–567.79. Bittner, R & Smrcka, P & Vysoky, P & Hana, K & Pousek, L & Schreib, P:Detecting of Fatigue States of a Car Driver. First InternationalSymposium on Medical Data Analysis - ISMDA 2000, Frankfurt, Germany,September 2000, ISBN 3-540-41089-9, Springer-Verlag Berlin Heidelberg2000, pp. 260–273.80. Belz, SM: An On-Road Investigation Of Self-Rating Of Alertness AndTemporal Separation As Indicators Of Driver Fatigue In CommercialMotor <strong>Vehicle</strong> Operators. Virginia Polytechnic Institute <strong>and</strong> StateUniversity, 2000. Ph.D. Thesis.81. Mollenhauer, MA & Dingus, TA & Hankey, JM & Carney, C & Neale, VL:Development of Human Factors Guidelines for Advanced TravelerInformation Systems (ATIS) <strong>and</strong> Commercial <strong>Vehicle</strong> Operations(CVO): Display Formats <strong>and</strong> Commercial <strong>Vehicle</strong> Operator (CVO)Workload. U.S. Department of Transportation. Federal HighwayAdministration. PUBLICATION NO. FHWA-RD-96-152. Sep. 1997.82. Fatigue <strong>and</strong> Driving: Driver Impairment, Driver Fatigue <strong>and</strong> DrivingSimulation. Detecting Fatigued Drivers with <strong>Vehicle</strong> Simulators. LaurenceHartley (Editor). ISBN: 0748402624. Publisher: Taylor & Francis, Inc. Pub.Date: January 1995, pp. 133–148.83. Junichi, F & Eisaku, A & Keiji, A: Estimation of Driver’s DrowsinessLevel Using Interval of Steering Adjustment for Lane Keeping, Journalof the Society of Automotive Engineers of Japan No. 9533866, 1995.84. Sayed, R & Esk<strong>and</strong>arian, A & Oskard, M: Driver Drowsiness DetectionUsing Artificial Neural Networks. US National Research Council.Transportation Research Board; meeting 80, 2001, Washington DC.85. Stern, JA & Boyer, D & Schroeder, D: Blink Rate: A Possible Measure ofFatigue. Human Factors 1994, 36(2): 285–297.86. Shimotani, M & Satake, T & Seki, M: On Board Drowsiness DetectionAnd Alert Device Based On Image Processing. Abstracts of the 3 rd WorldCongress on Intelligent Transport Systems. Orl<strong>and</strong>o, Florida. 1996, pp. 49.82 <strong>VTI</strong> meddel<strong>and</strong>e 922A
87. Haworth, NL & Vulcan, AP: Testing of Commercially Available FatigueMonitors. Monash University Accident Research Centre – Report #15,1991. www.general.monash.edu.au/muarc/rptsum/es15.htm July 200188. Volow, MR & Erwin, CW: The Heart Rate Variability Correlated ofSpontaneous Drowsiness Onset. Society of Automotive EngineersInternational 1973. Automotive Engineering Congress, Detroit, Michigan,January 8–12, Report No. 730124.89. Törnros, J & Peters, B & Östlund, J: Heart Rate Measures as DrowsinessIndicators. <strong>VTI</strong> notat 38A-2000. <strong>VTI</strong>. Sweden, 2000.90. Mabbott, NA & Lydon, M & Hartley, L & Arnold, P: Procedures <strong>and</strong>Devices to Monitor Operator Alertness Whilst Operating Machinery inOpen-Cut Coal Mines. Stage 1: State-of the-art review. ARRB TransportResearch Report 1999, RC 7433.91. Nguyen, LT & Jauregui, B & Dinges, DF: Changing Behaviors to PreventDrowsy Driving <strong>and</strong> Promote Traffic Safety: Review of Proven,Promising, <strong>and</strong> Unproven Techniques. AAA Foundation for TrafficSafety. www.aaafts.org/text/research/drowsyfinalreport.htm July 200192. Erwin, CW: Studies of Drowsiness – Final Report. 1976. Durham, NorthCarolina: The National Driving Center.93. Erwin, CW & Hartwell, JW & Volow, MR & Alberti, GS: ElectrodermalChange as a Predictor of Sleep. 1976. Erwin, C. W. (1976, February).Studies of Drowsiness (Final Report). Durham, North Carolina: TheNational Driving Center.94. Hardee, LH & Dingus, TA & Wierwille, WW: A Comparison of ThreeSubsidiary Tasks Used as Driver Drowsiness Countermeasures. 1985.(IEOR Department Report #8505). <strong>Vehicle</strong> Simulation Laboratory, HumanFactors Group. Virginia Polytechnic Institute <strong>and</strong> State University,Blacksburg, Virginia.95. Åkerstedt, T & Kecklund, G: Trötthet och trafiksäkerhet: en översikt avkunskapsläget. Borlänge, Vägverket, 2000, 46 s., 300 ref.; (Publikation/Vägverket2000:74); ISSN 1401-9612.96. Matlab: Documentation, Signal Processing Toolbox, Parametricmethods, burgs method.http://www.mathworks.com/access/helpdesk/help/toolbox/signal/spectr9a.shtml October 200197. Short Time Fourier Transformation.http://www.cs.umu.se/~anna/master/sfourier.html October 200198. Van Winsum, W: Age-related differences in effects of <strong>drowsiness</strong> onmeasures of driver behavior <strong>and</strong> performance. – Report No. TM-99-C001T, TNO Human Factors Research Institute 1999.99. Van Winsum, W & Brookhuis, KA & De Waard, D: Approximations ofTime-to-Line Crossing (TLC) for Real Time Measurement During CarDriving (Report TM-98-B008, 1998). Soesterberg, The Netherl<strong>and</strong>s: TNOHuman Factor Research Institute.<strong>VTI</strong> meddel<strong>and</strong>e 922A 83
100. Renner, GK: Fahrzeugführung unter kognitiver Belastung – EineSimulationsstudie. Dissertation at the RWTH Aachen, 1995.101. American National St<strong>and</strong>ard for Telecommunications. Telecom Glossary2000. http://www.its.bldrdoc.gov/projects/t1glossary2000/ July 200184 <strong>VTI</strong> meddel<strong>and</strong>e 922A
Appendix 1Page 1 (2)TLC formulae<strong>VTI</strong> meddel<strong>and</strong>e 922A
Appendix 1Page 2 (2)<strong>VTI</strong> meddel<strong>and</strong>e 922A
TLC calculationAppendix 2Page 1 (1)<strong>VTI</strong> meddel<strong>and</strong>e 922A
Appendix 3Page 1 (1)Search methodsThe literature study used expert knowledge, library quest, Internet databases <strong>and</strong>literature search as means for finding information about vehicle <strong>control</strong> <strong>and</strong><strong>drowsiness</strong>. Most recent results in terms of publication date were givenpreference.Main Internet search engines for the literature review:– TRIS ONLINE http://199.79.179.82/sundev/search.cfm– MOBI+ http://194.119.253.27/scripts/find.EXE– Elsevier Science www.transguide.org/intra/etidskrifter.htm– TRANSGUIDE http://www.transguide.org/Tsearch/Sframe.asp?Resfull=Search4ny.asp?WEBB– LINK SPRINGER http://link.springer.de/search.htm– SwetsBlackwell http://webspirs.swets.nl:8610/– Google www.google.com– Bullseye– WebferretMain search terms used alone <strong>and</strong> in combination with each other:• fatigue – <strong>drowsiness</strong> • lateral position• lane tracking – stability • warning systems• side position variation • tlc• steering wheel variability – variation • <strong>drowsiness</strong> prediction – detection• track deviation – stability • lane variability – tracking• side position variability • dozing – nodding – alertness<strong>VTI</strong> meddel<strong>and</strong>e 922A
Appendix 4Page 1 (2)Definition of terms used in the reportamplitudefrequencytime-to-linecrossingrelative lateralpositionabsolute lateralpositionSteering wheelvariabilityRoot mean squareerror of the lateralpositionThe magnitude of a parameter.Pulse amplitude is measured with respect to a specified reference <strong>and</strong>therefore should be modified by qualifiers, such as "average,""instantaneous," "peak," or "root-mean-square."In our case the peak-peak amplitude will be used to denote the differencebetween the maximal <strong>and</strong> the minimal value in a specific time window ofthe signal of interest.A pp[ t0 .. t1]= smax− smin,A pp = peak to peak amplitude[t 0 .. t 1 ] = time window of interests max , s min = maximal <strong>and</strong> minimal signal values during the timewindowThe instantaneous amplitude is the magnitude of a signal at a given time.The average amplitude is the mean values of the instantaneous amplitudeover a certain period of time.t112The root-mean-square: rms ( s)= ∫ s(t)∂t.t − t1For a periodic function: the number of cycles or events per unit time.Metrical unit: [1/second].In our case the term “frequency” is not entirely fitting, since the signal isnot periodic. The term will be used anyhow to denote the instantaneousfrequency of the signal.Is the time that a vehicle will take until it crosses a defined lateral line onthe road (for example the road margin lines), in other words, thisrepresents the time available until any part of the vehicle reaches one ofthe lane boundaries (see also [99]). Time-to-line crossing is sometimesalso called time-to-lane crossing.Position of the car relative to the position it had before on the road (noinformation where the vehicle is in relation to the road margins).The absolute lateral position cannot be calculated from thismeasurement.Position of the car in relation to the road margins or some other definedroad part. The relative lateral position can be calculated from thismeasurement.Variation of the steering wheel angle. This measurement can be seen asthe derivate of the absolute steering wheel position.The root mean square error of the lateral vehicle position RMS(LP) is ameasure of how much the vehicle is away from a default (target) position(for example the centre of the lane).( X − X )0 t0∑a tRMS(LP)=n −1X a = actual lateral vehicle positionX t = target lateral vehicle positionn = number of measurement points2<strong>VTI</strong> meddel<strong>and</strong>e 922A
St<strong>and</strong>ard deviationof lateral position(SDLP)Appendix 4Page 2 (2)The st<strong>and</strong>ard deviation of lateral position is a measure of how much thedriver “keeps his track” [100], <strong>and</strong> is seen as a general performancemeasure.⎛ ∑ Xa− X∑⎜Xa− Xt−=⎝nSDLPn −1X a = actual lateral vehicle positionX t = target lateral vehicle positionn = number of measurement pointst⎞⎟⎠2Note: the definitions are taken from the American National St<strong>and</strong>ard forTelecommunications [101].<strong>VTI</strong> meddel<strong>and</strong>e 922A