Stress Strain Curves
Stress Strain Curves
Stress Strain Curves

Create successful ePaper yourself
Turn your PDF publications into a flip-book with our unique Google optimized e-Paper software.
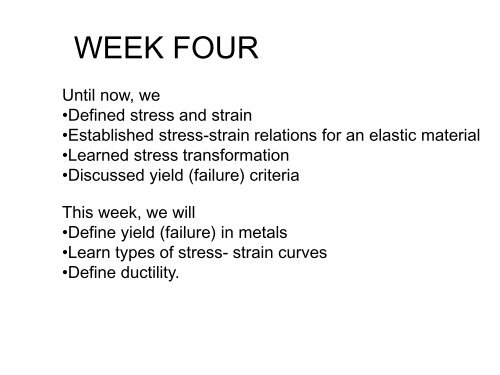
WEEK FOURUntil now, we•Defined stress and strain•Established stress-strain relations for an elastic material•Learned stress transformation•Discussed yield (failure) criteriaThis week, we will•Define yield (failure) in metals•Learn types of stress- strain curves•Define ductility.
Plastic Deformation
Typical yield behavior fornon-ferrous alloys.1: True elastic limit2 (A’): Proportionality limit3 (A): Elastic limit4 (B): Offset yield strength
<strong>Stress</strong> <strong>Strain</strong> diagramPoint A: Elastic limit. No permanentstrain. Depends on instruments.Point A’:Proportional limit. Thestress strain curve deviates fromlinearity.Point B: Yield strength. The stresswhich will produce a small amount ofpermanent deformation, usually0.002As the plastic deformation of the specimen increases, themetal becomes stronger (strain hardening).Eventually,the load reaches a maximum. The maximum loaddivided by the original area of the specimen is the ultimatetensile strength.
<strong>Stress</strong> strain diagram for low carbon steel• Note the critical status for strength specification‣ proportional limit‣ elastic limit‣ yield stress‣ ultimate stress‣ fracture stressCopyright © 2011 Pearson Education South Asia Pte Ltd
<strong>Stress</strong> <strong>Strain</strong> diagram comparisonhttp://www.tanaka-bondingwire.com
since in tension, fracture usually occurs before yield.Hard to measure,in ceramic matrix and epoxy matrix composites, sincein tension, fracture usually occurs before yield.Yield Strength : Comparison2 0 00Metals/AlloysSteel (4140) qtGraphite/Ceramics/SemicondPolymersComposites/fibersYield strength, s y (MPa)10 007006005004003 002 00100706050403020Ti (5Al-2.5Sn)W (pure)aCu (71500) cwMo (pure)Steel (4140) aSteel (1020) cdAl (6061) agSteel (1020) hrTi (pure) aTa (pure)Cu (71500) hrAl (6061) aHard to measure ,¨PCNylon 6,6PEThumidPVCPPH DPEdryRoom T valuesBased on data in Table B4,Callister 7e.a = annealedhr = hot rolledag = agedcd = cold drawncw = cold workedqt = quenched & tempered10Tin (pure)LDPE
Material Properties• Modulus of elasticity (Hooke’s Law)• Modulus of Resiliences Eur1 21splpls2 2 Epl• Modulus of Toughness– It measures the entire areaunder the stress-strain diagramCopyright © 2011 Pearson Education South Asia Pte Ltd
Plastic Deformation• Plastic deformation is a non reversibleprocess where Hooke’s law is nolonger valid.• One aspect of plasticity in theviewpoint of structural design isthat it is concerned with predictingthe maximum load, which can beapplied to a body without causingexcessive yielding.• Another aspect of plasticity is aboutthe plastic forming of metals wherelarge plastic deformation is requiredto change metals into desiredshapes.Elastic and plasticdeformation in uniaxialtension
The Flow Curve•When the load is released thetotal strain will immidiatelydecrease from 1 to 2 by anamount s/E (recoverable elasticstrain).•Time dependent elastikbehaviour from 2 to 3 (calledanelastik behaviour) isneglected.•The hysteresis behaviourresulting from unloading andloading from a plastic strainis generally neglected.•The yield stress onreloading in oppositedirection is lower (s b
<strong>Stress</strong> <strong>Strain</strong> <strong>Curves</strong>s= E s= E If HCP metals deform byslip and twinning(occurs in bursts).
<strong>Stress</strong> <strong>Strain</strong> <strong>Curves</strong>Type IV stress-strain behavior exhibiting a narrow heterogeneousdeformation region between initial elastic and final homogenous flowregions. On-set of local yielding occurs at upper yield point A withcorresponding load drop to B defined as the lower yield point. After passageof Lüders band throughout the gage section homogenous deformationcommences at C.
Deformation of Typical PolymersType V stress-strain behavior usually found in crystalline polymers.Minimum in curve reflects cold working and competition betweenbreakdown of initial structure and its subsequent reorganization intoa highly oriented strong material.
Example: The stress–strain diagram for an aluminum alloy that isused for making aircraft parts is shown in Fig. 3–19. If a specimenof this material is stressed to 600 MPa, determine the permanentstrain that remains in the specimen when the load is released.Also, find the modulus of resilience both before and after the loadapplication.Copyright © 2011 Pearson Education South Asia Pte Ltd
Solution• When the specimen is subjected to the load, the strain is approximately 0.023mm/mm.• The slope of line OA is the modulus of elasticity,• From triangle CBD,EBDCD CDE 450 0.00675.0 GPa610 75.010600 9CD 0.008 mm/mmCopyright © 2011 Pearson Education South Asia Pte Ltd
Solution• This strain represents the amount of recovered elastic strain.• The permanent strain is OC 0.0230.008 0.0150 mm/mm(Ans)• Computing the modulus of resilience,12121212u s 4500.006r1.35 MJ/m(Ans)3u s 6000.008 2.40 MJ/m (Ans)rinitialfinalplplplpl• Note that the SI system of units is measured in joules, where 1 J = 1 N • m.3Copyright © 2011 Pearson Education South Asia Pte Ltd
Idealized Flow <strong>Curves</strong>Rigid - ideal plastic Elastic - ideal plastic Piecewise linear
<strong>Stress</strong>Tension TestThe various engineering and true stress-strain properties obtainable from atension testTSNote that:<strong>Strain</strong>– the engineering fracture strain ε f and the % elongation are only differentways of stating the same quantity. Also, the %RA and ε f can be calculated fromeach other.
Measures of DuctilityDuctility is a qualitative, subjective property of a material. It usuallyindicates the extent to which a metal can be deformed without fracture.Two methods one can obtain ductility from tension test are:•the engineering strain at fracture, f , known aselongation•the reduction in area (R.A.) at fracture, qThe two properties are obtained by putting the fractured specimen backtogether, and taking measurements of L f and A f .Both elongation and reduction of area are usually expressed as apercentage.The value of f will depend on the gage length L o in necked specimens. Thereduction in area is a better method of reporting elongation, especially forductile materials.
• Plastic tensile strain at failure:EngineeringTexnsile stresssMeasures of Ductilitysmaller %ELlarger %EL% ELLfL oLoLoA ox 100A fL fAdapted from Fig. 6.13,Callister 7e.Engineering tensile strain,• Another ductility measure:% RA=Ao -AoAfx 10020
Elongation depends on the original gauge length L o .% elongation decreases as L o increases.% Elongation is chiefly influenced by uniform elongation,which is dependent on the strain-hardening capacity ofthe materialReduction of area is more a measure of the deformationrequired to produce failure and its chief contributionresults from the necking process.Because of the complicated state of stress state in the neck, values ofreduction of area are dependent on specimen geometry, and deformationbehaviour.% Elongation and Reduction of area should not be taken as true materialproperties.
True <strong>Stress</strong> - True <strong>Strain</strong> Curve•The annealed structure is ductile, but has low yield stress. Beyond the ultimatetensile stress, plastic deformation becomes localized (called necking), and theengineering stress drop because of the localized reduction in cross-sectional area.•Engineering stress-strain curve does not indicate that ductile materials continue tostrain-harden up to fracture.•Engineering stress-strain curve does not give the true nature of the deformation of ametal because it is based on the original dimensions of the specimen•However, the true stress continues to rise because the crosssectional areadecreases and the material work-hardens in the neck region.•The true-stress-true-strain curves are obtained by converting the tensile stress and itscorresponding strain into true values and extending the curve.•An assessment of the true stress-true strain curve provides a realistic characteristicof the material.
True <strong>Strain</strong> and Reduction of Area• According to the concept of unit linear strain• This satisfies for elastic strain where DL is very small, but not for plastic strain.• Definition: true strain or natural strain is the change in length referred to theinstantaneous gauge length.• Hence the relationship between the true strain and the engineering strain becomesAlso, the volume remains constantin plastic deformation:TWe can also show that
Example: A tensile specimen with a 12 mm initial diameter and 50 mm gauge length reachesmaximum load at 90 kN and fractures at 70 kN. The maximum diameter at fracture is 10 mm.Determine engineering stress at maximum load (the ultimate tensile strength), true fracturestress, true strain at fracture and engineering strain at fractureEngineering stress at maximum loadTrue fracture stressTrue strain at fractureEngineering strain at fracture
True <strong>Stress</strong> - True <strong>Strain</strong> CurveTrue stress calculation accounts for change in the cross-section of the sample.Necking begins at point M on engineering stress-strain curve and on M' ontrue stress –strain curveThe corrected line accounts for the complex state of stress within the neckregion
True <strong>Stress</strong> and True <strong>Strain</strong>For many metals, the region of uniformplastic deformation of the s T – T curve canbe approximated by the Ludwik-Hollomanpower law relationship:completely elastic : n= 1ideal plastic : n=0Sensitive to thermamecanical treatmentK( )Annealed specimens: Larger nCold worked :Smaller
True stress-strain and engineering stress-strain curves for AISI 4140 hot-rolled steel
HardnessIn general, hardness implies a resistance to deformationFor metals, it is a measure of their resistance to permanent or plastic deformationCommonly measured by resistance to indentation indentation hardnessScratch hardness is also used Moh’s scaleHardness tests are simple to make, and they can be made on production parts asquality control checks without destroying the part.The disadvantage is that although hardness of a material depends on the plasticproperties, the stress–strain relation cannot be obtained.
Hardness Testing Techniques
ConversionApproximate relation betweenseveral hardness scales.Relation between Vickers andMoh’s hardness scales
ConversionBoth tensile strength and hardness are indicatorsof a metal’s resistance to plastic deformation they are roughly proportional.For heat treated plain carbon steeland medium alloy steelsS UTS (MPa) = 3.45 (BHN)