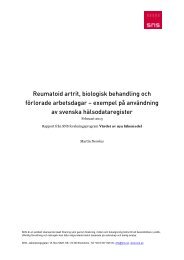
main group” level; there are 14 anatomical main groups. The 2 nd , 3 rd , 4 th , <strong>and</strong> 5 th levelsare “therapeutic subgroup,” “pharmacological subgroup,” “chemical subgroup,” <strong>and</strong>“chemical substance,” respectively. 3 The measure of pharmaceutical innovation we usedwas based on the number of drug classes (chemical subgroups) <strong>and</strong> number of drugs(chemical substances) previously introduced to treat a condition.We will investigate the effects of both new chemical substances <strong>and</strong> new chemicalsubgroups on longevity.We pooled data from several rich data sources. Longitudinaldisease-level measures of pharmaceutical innovation were constructed fromLäkemedelsverket (Sweden’s Medical Products Agency) 4 <strong>and</strong> from Thériaque. 5Longitudinal disease-level data on mortality was obtained from the WHO MortalityDatabase. 6 Longitudinal disease-level data on hospital utilization was obtained fromEurostat. 7 Longitudinal data on pharmaceutical expenditure <strong>and</strong> innovation, by drugclass, was obtained from the IMS Health MIDAS database. 8 Some additional data wasobtained from the OECD Health database.We used longitudinal, disease-level data to estimate difference-in-differences models ofthe effect of pharmaceutical innovation on longevity. In essence, we investigatedwhether the diseases that experienced more pharmaceutical innovation had largerincreases in longevity. Our models include year <strong>and</strong> disease fixed effects, so they willcontrol for the overall increase in Swedish longevity <strong>and</strong> for stable between-diseasedifferences in mortality. From 1997 to 2010, mean age at death increased by 1.88 years,from 78.40 to 80.28 years. We estimate that, if the number of chemical substancesmarketed up to six years earlier had not increased, mean age at death would have increasedby 1.29 years, from 78.40 to 79.69 years (Figure 1). Hence pharmaceuticalinnovation is estimated to have increased mean age at death in Sweden by 0.60 years(7.15 months) during the period 1997−2010 – almost 1/3 (31.6%) of the overall increasein mean age at death. It accounted for twice as large a fraction (63%) of the increase inthe fraction of deaths that occurred at an age greater than 75. We found that longevitydepends on the number of drugs to treat a disease, not the number of chemical subgroups(drug classes) developed to treat the disease.3 The complete classification of metformin illustrates the structure of the code:A Alimentary tract <strong>and</strong> metabolism (1st level, anatomical main group)A10A10BA10BADrugs used in diabetes (2nd level, therapeutic subgroup)Blood glucose lowering drugs, excl. Insulins (3rd level, pharmacological subgroup)Biguanides (4th level, chemical subgroup)A10BA02 Metformin (5th level, chemical substance)http://www.whocc.no/atc/structure_<strong>and</strong>_principles/4 http://www.lakemedelsverket.se/Sok-efter-lakemedel-och-mediciner-i-Lakemedelsfakta/5 Thériaque (http://www.theriaque.org/) is a database of official, regulatory <strong>and</strong> bibliographic informationon all drugs available in France, intended for health professionals. Funding is provided by the FrenchCentre National Hospitalier d'Information sur le Médicament.6 http://www.who.int/healthinfo/morttables/en/7 http://epp.eurostat.ec.europa.eu/portal/page/portal/statistics/search_database8 IMS describes MIDAS as “a unique data platform for assessing worldwide healthcare markets. Itintegrates IMS national audits into a globally consistent view of the pharmaceutical market, trackingvirtually every product in hundreds of therapeutic classes <strong>and</strong> providing estimated product volumes,trends <strong>and</strong> market share through retail <strong>and</strong> non-retail channels. MIDAS data is updated monthly <strong>and</strong>retains 12 years of history.” IMS Institute for Healthcare Informatics (2011), The Global Use ofMedicines: Outlook Through 2015, May.http://www.imshealth.com/deployedfiles/ims/Global/Content/Insights/IMS%20Institute%20for%20Healthcare%20Informatics/Global_Use_of_Medicines_Report.pdf16
Figure 1. Mean age at death: Actual vs. in absence of pharmaceutical innovation80,580,080,2879,579,6979,078,578,40In absence of…78,01996 1998 2000 2002 2004 2006 2008 2010 2012We examined the effect of pharmaceutical innovation on hospital use during the period2000−2009. The estimates indicate that an increase in the number of drugs marketed fora disease reduces the number of hospital days (number of discharges <strong>and</strong> length of stay),due to the disease eight years later, primarily due to its effect on the number of hospitaldischarges. We estimated that if no new drugs had been put on the market during theperiod 1992−2001, the number of hospital days would have been about 12% higher in2009 (Figure 2).17
- Page 5 and 6: undersöks är relaterat till över
- Page 7 and 8: Executive SummaryLife expectancy ar
- Page 9 and 10: 1. IntroductionLongevity has consta
- Page 11 and 12: 2. Background2.1. Determinants infl
- Page 13 and 14: 2.3. Access, uptake and use of (new
- Page 15: 3. Value of innovationIncreased lon
- Page 19 and 20: Table 1. Estimation of incremental
- Page 21 and 22: This could be explained by the fact
- Page 23 and 24: is not positively correlated with t
- Page 25 and 26: incremental innovation and on dynam
- Page 27 and 28: 18. Godman, B., Sakshaug, S., Berg,
- Page 29 and 30: 56. Bertrand, M., Duflo, E., Mullai