NMICS 2010 Report - Central Bureau of Statistics
NMICS 2010 Report - Central Bureau of Statistics NMICS 2010 Report - Central Bureau of Statistics
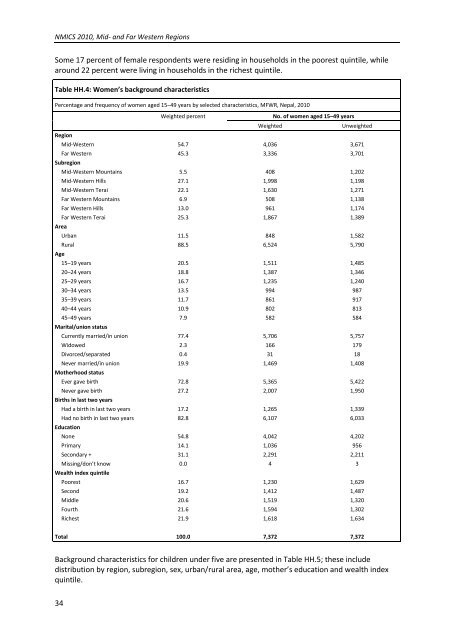
NMICS 2010, Mid- and Far Western RegionsSome 17 percent of female respondents were residing in households in the poorest quintile, whilearound 22 percent were living in households in the richest quintile.Table HH.4: Women’s background characteristicsPercentage and frequency of women aged 15–49 years by selected characteristics, MFWR, Nepal, 2010RegionWeighted percentWeightedNo. of women aged 15–49 yearsUnweightedMid-Western 54.7 4,036 3,671Far Western 45.3 3,336 3,701SubregionAreaAgeMid-Western Mountains 5.5 408 1,202Mid-Western Hills 27.1 1,998 1,198Mid-Western Terai 22.1 1,630 1,271Far Western Mountains 6.9 508 1,138Far Western Hills 13.0 961 1,174Far Western Terai 25.3 1,867 1,389Urban 11.5 848 1,582Rural 88.5 6,524 5,79015–19 years 20.5 1,511 1,48520–24 years 18.8 1,387 1,34625–29 years 16.7 1,235 1,24030–34 years 13.5 994 98735–39 years 11.7 861 91740–44 years 10.9 802 81345–49 years 7.9 582 584Marital/union statusCurrently married/in union 77.4 5,706 5,757Widowed 2.3 166 179Divorced/separated 0.4 31 18Never married/in union 19.9 1,469 1,408Motherhood statusEver gave birth 72.8 5,365 5,422Never gave birth 27.2 2,007 1,950Births in last two yearsHad a birth in last two years 17.2 1,265 1,339Had no birth in last two years 82.8 6,107 6,033EducationNone 54.8 4,042 4,202Primary 14.1 1,036 956Secondary + 31.1 2,291 2,211Missing/don’t know 0.0 4 3Wealth index quintilePoorest 16.7 1,230 1,629Second 19.2 1,412 1,487Middle 20.6 1,519 1,320Fourth 21.6 1,594 1,302Richest 21.9 1,618 1,634Total 100.0 7,372 7,372Background characteristics for children under five are presented in Table HH.5; these includedistribution by region, subregion, sex, urban/rural area, age, mother’s education and wealth indexquintile.34
NMICS 2010, Mid- and Far Western RegionsSome 56 percent of children under five were living in the Mid-Western Region and 44 percent wereliving in the Far Western Region. By subregion, almost one third (30 percent) were living in the Mid-Western Hills, 21 percent in the Far Western Terai, 17 percent in the Mid-Western Terai, 16 percentin the Far Western Hills, and eight percent each in the Mid-Western Mountains and Far WesternMountains. Slightly more than half (51 percent) were male and the remainder (49 percent) werefemale. Over 91 percent were living in rural areas, while nine percent were living in urban areas.By age group, 10 percent were younger than six months, 10 percent are aged 6–11 months, 18percent were aged 12–23 months, 20 percent were aged 24–35 months, 23 percent were aged 36–47 months and 21 percent were aged 48–59 months. Around two thirds (60 percent) ofmothers/caretakers of children under five had never received any formal education, 16 percent hadprimary education and 24 percent had at least secondary education.In terms of wealth quintile, slightly more than one fourth (26 percent) of children under five wereliving in the poorest households, while 15 percent were living in the richest households.35
- Page 1 and 2: NepalMonitoring the situationof chi
- Page 3: Nepal Multiple Indicator Cluster Su
- Page 6 and 7: NMICS 2010, Mid- and Far Western Re
- Page 10: ForewordIt is my great pleasure to
- Page 13 and 14: NMICS 2010, Mid- and Far Western Re
- Page 15 and 16: NMICS 2010, Mid- and Far Western Re
- Page 17 and 18: Executive SummarySummary of finding
- Page 19 and 20: NMICS 2010, Mid- and Far Western Re
- Page 21 and 22: NMICS 2010, Mid- and Far Western Re
- Page 23 and 24: I. IntroductionBackgroundThis repor
- Page 25 and 26: II.Sample and Survey MethodologySam
- Page 27 and 28: NMICS 2010, Mid- and Far Western Re
- Page 29 and 30: Mid-WesternFar WesternMid-WesternMo
- Page 31 and 32: Age groupNMICS 2010, Mid- and Far W
- Page 33: NMICS 2010, Mid- and Far Western Re
- Page 37 and 38: IV.NutritionNutritional statusChild
- Page 39 and 40: PercentNMICS 2010, Mid- and Far Wes
- Page 41 and 42: 0-12-34-56-78-910-1112-1314-1516-17
- Page 43 and 44: NMICS 2010, Mid- and Far Western Re
- Page 45 and 46: NMICS 2010, Mid- and Far Western Re
- Page 47 and 48: NMICS 2010, Mid- and Far Western Re
- Page 49 and 50: NMICS 2010, Mid- and Far Western Re
- Page 51 and 52: NMICS 2010, Mid- and Far Western Re
- Page 53 and 54: NMICS 2010, Mid- and Far Western Re
- Page 55 and 56: PercentNMICS 2010, Mid- and Far Wes
- Page 57 and 58: NMICS 2010, Mid- and Far Western Re
- Page 59 and 60: NMICS 2010, Mid- and Far Western Re
- Page 61 and 62: NMICS 2010, Mid- and Far Western Re
- Page 63 and 64: Table CH.6: Feeding practices durin
- Page 65 and 66: NMICS 2010, Mid- and Far Western Re
- Page 67 and 68: Cont’d Table CH.7: Oral rehydrati
- Page 69 and 70: Government hospitalPrimary healthca
- Page 71 and 72: NMICS 2010, Mid- and Far Western Re
- Page 73 and 74: Table CH.10: Solid fuel usePercenta
- Page 75 and 76: NMICS 2010, Mid- and Far Western Re
- Page 77 and 78: Cont’d Table CH.12: Anti-malarial
- Page 79 and 80: NMICS 2010, Mid- and Far Western Re
- Page 81 and 82: Table WS.1: Use of improved water s
- Page 83 and 84: Table WS.2: Household water treatme
<strong>NMICS</strong> <strong>2010</strong>, Mid- and Far Western RegionsSome 17 percent <strong>of</strong> female respondents were residing in households in the poorest quintile, whilearound 22 percent were living in households in the richest quintile.Table HH.4: Women’s background characteristicsPercentage and frequency <strong>of</strong> women aged 15–49 years by selected characteristics, MFWR, Nepal, <strong>2010</strong>RegionWeighted percentWeightedNo. <strong>of</strong> women aged 15–49 yearsUnweightedMid-Western 54.7 4,036 3,671Far Western 45.3 3,336 3,701SubregionAreaAgeMid-Western Mountains 5.5 408 1,202Mid-Western Hills 27.1 1,998 1,198Mid-Western Terai 22.1 1,630 1,271Far Western Mountains 6.9 508 1,138Far Western Hills 13.0 961 1,174Far Western Terai 25.3 1,867 1,389Urban 11.5 848 1,582Rural 88.5 6,524 5,79015–19 years 20.5 1,511 1,48520–24 years 18.8 1,387 1,34625–29 years 16.7 1,235 1,24030–34 years 13.5 994 98735–39 years 11.7 861 91740–44 years 10.9 802 81345–49 years 7.9 582 584Marital/union statusCurrently married/in union 77.4 5,706 5,757Widowed 2.3 166 179Divorced/separated 0.4 31 18Never married/in union 19.9 1,469 1,408Motherhood statusEver gave birth 72.8 5,365 5,422Never gave birth 27.2 2,007 1,950Births in last two yearsHad a birth in last two years 17.2 1,265 1,339Had no birth in last two years 82.8 6,107 6,033EducationNone 54.8 4,042 4,202Primary 14.1 1,036 956Secondary + 31.1 2,291 2,211Missing/don’t know 0.0 4 3Wealth index quintilePoorest 16.7 1,230 1,629Second 19.2 1,412 1,487Middle 20.6 1,519 1,320Fourth 21.6 1,594 1,302Richest 21.9 1,618 1,634Total 100.0 7,372 7,372Background characteristics for children under five are presented in Table HH.5; these includedistribution by region, subregion, sex, urban/rural area, age, mother’s education and wealth indexquintile.34


