Metrics of curves in shape optimization and analysis - Andrea Carlo ...
Metrics of curves in shape optimization and analysis - Andrea Carlo ...
Metrics of curves in shape optimization and analysis - Andrea Carlo ...

You also want an ePaper? Increase the reach of your titles
YUMPU automatically turns print PDFs into web optimized ePapers that Google loves.
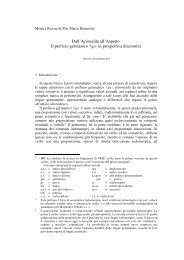
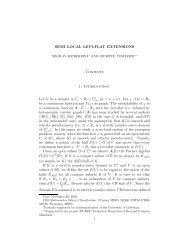
7.552.5-10 -7.5 -5 -2.5 2.5 5 7.5 10-2.5-5-7.5-10321-4 -3 -2 -1 1 2 3 4-1-2-3-47.552.5-10 -7.5 -5 -2.5 2.5 5 7.5 10-2.5-5-7.5-10321-4 -3 -2 -1 1 2 3 4-1-2-3-47.552.5-10 -7.5 -5 -2.5 2.5 5 7.5 10-2.5-5-7.5-10321-4 -3 -2 -1 1 2 3 4-1-2-3-47.552.5-10 -7.5 -5 -2.5 2.5 5 7.5 10-2.5-5-7.5-10321-4 -3 -2 -1 1 2 3 4-1-2-3-47.552.5-10 -7.5 -5 -2.5 2.5 5 7.5 10-2.5-5-7.5-10321-4 -3 -2 -1 1 2 3 4-1-2-3-47.552.5-10 -7.5 -5 -2.5 2.5 5 7.5 10-2.5-5-7.5-10321-4 -3 -2 -1 1 2 3 4-1-2-3-4321-4 -3 -2 -1 1 2 3 4-1-2-3-4321-4 -3 -2 -1 1 2 3 4-1-2-3-4321-4 -3 -2 -1 1 2 3 4-1-2-3-4321-4 -3 -2 -1 1 2 3 4-1-2-3-4C(0, θ) = c 0 (θ) = ( cos(θ), s<strong>in</strong>(θ)(1 + 2 cos(θ) 4 ) )t=-1.210t=-0.810t=-0.410t=04t=0.54t=1.4t=1.54t=2.4C(0, θ) = c 0 (θ) = ( cos(θ), 2 s<strong>in</strong>(θ) )t=-1.210t=-0.810t=-0.410t=04t=0.54t=1.4t=1.54t=2.4Two numerical simulation <strong>of</strong> the ˜H 1 gradient descent flow <strong>of</strong> the centroid energyE(c) = 1 |avg 2 c(c) − v| 2 , for two different <strong>in</strong>itial <strong>curves</strong> c 0. The constants were set toλ = 1/(4π 2 ), v = (2, 2). Steps for numerical discretization were set to ∆t = 1/30,∆θ = π/64 (on [0, 2π]). Note that plots for t < 0 are shown <strong>in</strong> a smaller scale.Figure 12: ˜H1 gradient descent flow <strong>of</strong> the centroid energy. See 10.20 <strong>and</strong> 10.29.78

![4. Ghost [Å] vowels in French - Laboratorio di Linguistica](https://img.yumpu.com/49999334/1/184x260/4-ghost-a-vowels-in-french-laboratorio-di-linguistica.jpg?quality=85)