Factors influencing the accuracy of biomechanical breast models
Factors influencing the accuracy of biomechanical breast models
Factors influencing the accuracy of biomechanical breast models

You also want an ePaper? Increase the reach of your titles
YUMPU automatically turns print PDFs into web optimized ePapers that Google loves.
This is an author produced version <strong>of</strong> an article that appears in:MEDICAL PHYSICSThe internet address for this paper is:https://publications.icr.ac.uk/2637/Copyright information:http://www.aip.org/pubservs/web_posting_guidelines.htmlPublished text:C Tanner, J A Schnabel, D L G Hill, D J Hawkes, M O Leach,D R Hose (2006) <strong>Factors</strong> <strong>influencing</strong> <strong>the</strong> <strong>accuracy</strong> <strong>of</strong><strong>biomechanical</strong> <strong>breast</strong> <strong>models</strong>, Medical Physics, Vol. 33(6),1758-1769Institute <strong>of</strong> Cancer Research Repositoryhttps://publications.icr.ac.ukPlease direct all emails to:publications@icr.ac.uk
<strong>Factors</strong> <strong>influencing</strong> <strong>the</strong> <strong>accuracy</strong> <strong>of</strong> <strong>biomechanical</strong> <strong>breast</strong> <strong>models</strong>Christine Tanner, Julia A. Schnabel, Derek L. G. Hill, and David J. HawkesCentre <strong>of</strong> Medical Image Computing at University College London, Gower Street, London,WC1E 6BT, United KingdomMartin O. LeachCancer Research UK Clinical MR Research Group, The Institute <strong>of</strong> Cancer Research and <strong>the</strong> RoyalMarsden NHS Foundation Trust, Sutton, Surrey SM2 5PT, United KingdomD. Rodney HoseClinical Sciences Division, Medical Physics and Clinical Engineering, Royal Hallamshire Hospital,University <strong>of</strong> Sheffield, Sheffield S10 2JF, United KingdomReceived 24 August 2005; revised 29 March 2006; accepted for publication 30 March 2006;published 19 May 2006Recently it has been suggested that finite element methods could be used to predict <strong>breast</strong> deformationsin a number <strong>of</strong> applications, including comparison <strong>of</strong> multimodality images, validation <strong>of</strong>image registration and image guided interventions. Unfortunately knowledge <strong>of</strong> <strong>the</strong> mechanicalproperties <strong>of</strong> <strong>breast</strong> tissues is limited. This study evaluated <strong>the</strong> <strong>accuracy</strong> with which <strong>biomechanical</strong><strong>breast</strong> <strong>models</strong> based on finite element methods can predict <strong>the</strong> displacements <strong>of</strong> tissue within <strong>the</strong><strong>breast</strong> in <strong>the</strong> practical clinical situation where <strong>the</strong> boundaries <strong>of</strong> <strong>the</strong> organ might be known reasonablyaccurately but <strong>the</strong>re is some uncertainty on <strong>the</strong> mechanical properties <strong>of</strong> <strong>the</strong> tissue. For twodatasets, we investigate <strong>the</strong> influence <strong>of</strong> tissue elasticity values, Poisson’s ratios, boundary conditions,finite element solvers and mesh resolutions. Magnetic resonance images were acquired beforeand after compressing each volunteer’s <strong>breast</strong> by about 20%. Surface displacement boundary conditionswere derived from a three-dimensional nonrigid image registration. Six linear and threenonlinear elastic material <strong>models</strong> with and without skin were tested. These were compared tohyperelastic <strong>models</strong>. The <strong>accuracy</strong> <strong>of</strong> <strong>the</strong> <strong>models</strong> was evaluated by assessing <strong>the</strong> ability <strong>of</strong> <strong>the</strong>model to predict <strong>the</strong> location <strong>of</strong> 12 corresponding anatomical landmarks. The <strong>accuracy</strong> was mostsensitive to <strong>the</strong> Poisson’s ratio and <strong>the</strong> boundary condition. Best results were achieved for accurateboundary conditions, appropriate Poisson’s ratios and <strong>models</strong> where fibroglandular tissue was atmost four times stiffer than fatty tissue. These configurations reduced <strong>the</strong> mean maximum distance<strong>of</strong> <strong>the</strong> landmarks from 6.6 mm 12.4 mm to 2.1 mm 3.4 mm averaged over allexperiments. © 2006 American Association <strong>of</strong> Physicists in Medicine. DOI: 10.1118/1.2198315Key words: Finite element analysis, <strong>breast</strong> imaging, imaged guided interventions, deformationI. INTRODUCTIONBiomechanical <strong>breast</strong> <strong>models</strong> employing finite elementmethods FEMs have been explored for predicting mechanicaldeformations during biopsy procedures, 1,2 for modelingcompressions similar to x-ray mammography, 3–5 for <strong>the</strong> registration<strong>of</strong> magnetic resonance MR and x-raymammograms, 6,7 for validating <strong>the</strong> nonrigid registration <strong>of</strong>dynamic contrast-enhanced DCE MR mammograms, 8 fortesting reconstruction algorithms in elastography, 9–11 and as aforward model for elastography. 12 The use <strong>of</strong> mechanical<strong>models</strong> in <strong>the</strong>se applications can be seen as providing priorinformation about <strong>the</strong> expected deformations. This prior informationhelps to constrain possible solutions and thus toprovide a physical basis for interpolation, reconstruction andprediction for those cases in which <strong>the</strong>re is insufficient informationin <strong>the</strong> image data. Previously described <strong>biomechanical</strong><strong>breast</strong> <strong>models</strong> have been assessed based on <strong>the</strong> predictedlocation <strong>of</strong> anatomical landmarks selected in <strong>breast</strong> imagesacquired before and after in-vivo compression, 1,2,6,7,13 by visualcomparison <strong>of</strong> <strong>the</strong> simulated compressed <strong>breast</strong> imagewith <strong>the</strong> uncompressed <strong>breast</strong>, 3 or not at all. 4,5 Evaluationsbased on landmarks were limited due to <strong>the</strong> use <strong>of</strong> only veryfew landmarks 1,2 or a single dataset. 6,7,13The first aim <strong>of</strong> this study was to determine a suitablemodel configuration, that can be employed for simulatingplausible <strong>breast</strong> deformations during DCE MR mammographyfor <strong>the</strong> validation <strong>of</strong> nonrigid registration. 8 The secondobjective was to determine <strong>the</strong> most important modellingaspects. Biomechanical <strong>breast</strong> <strong>models</strong> are commonly criticizedfor modelling <strong>the</strong> mechanical <strong>breast</strong> properties in a toosimplistic or unrealistic manner by using ra<strong>the</strong>r poor estimates<strong>of</strong> <strong>the</strong> <strong>biomechanical</strong> properties. Yet, <strong>the</strong> influence <strong>of</strong><strong>the</strong> mechanical <strong>breast</strong> properties on <strong>the</strong> model <strong>accuracy</strong> incomparison to o<strong>the</strong>r modelling factors has not been systematicallyinvestigated for <strong>the</strong> practical clinical situation where<strong>the</strong> boundary conditions may be known ra<strong>the</strong>r well from imagingsystems yet <strong>the</strong> mechanical properties are ra<strong>the</strong>r poorlycharacterized.Biomechanical <strong>breast</strong> <strong>models</strong> mainly vary with respect to<strong>the</strong> mesh generation, <strong>the</strong> boundary conditions employed, <strong>the</strong>tissue properties assumed and <strong>the</strong> solution strategies. This1758 Med. Phys. 33 „6…, June 2006 0094-2405/2006/33„6…/1758/12/$23.00 © 2006 Am. Assoc. Phys. Med. 1758
1759 Tanner et al.: <strong>Factors</strong> <strong>influencing</strong> <strong>the</strong> <strong>accuracy</strong> <strong>of</strong> <strong>biomechanical</strong> <strong>breast</strong> <strong>models</strong> 1759TABLE I. Preprocessing parameters and geometric FEM model configurations. All triangulations were smoo<strong>the</strong>dby 120 iterations. Elements that exceeded an aspect ratio <strong>of</strong> 20 or an angle <strong>of</strong> 165° were classified as “badlyshaped” by ANSYS.Volunteer oneVolunteer twoGM1 GM2 GM1 GM2Preprocessing Isotropic voxel size mm 8 8 10 7.5Number <strong>of</strong> decimation steps 120 2 1 1Mesh configuration Number <strong>of</strong> nodes 51 072 102 102 58 614 117 347Number <strong>of</strong> elements 34 873 72 756 40 636 81 633Badly shaped elements % 0.057 0.003 0.000 0.004study assessed <strong>the</strong> influence <strong>of</strong> all <strong>of</strong> <strong>the</strong>se aspects on <strong>the</strong><strong>accuracy</strong> with which <strong>the</strong> displacement <strong>of</strong> internal <strong>breast</strong>structures can be predicted. Results are presented for twodatasets. Experiments included a comparison <strong>of</strong> Mooney-Rivlin hyperelastic <strong>models</strong> and finite deformation formulationswith simpler approaches.The evaluation was based on obtaining 3D MR imagesbefore and after compressing <strong>the</strong> <strong>breast</strong> by approximately20% in thickness. Breast surface displacements were calculatedby applying a full 3D nonrigid registration 14 to <strong>the</strong>seMR images. A subset <strong>of</strong> <strong>the</strong>se surface displacements servedas boundary conditions for <strong>the</strong> FEM model. The results wereevaluated on <strong>the</strong> basis <strong>of</strong> <strong>the</strong> residual displacement error <strong>of</strong>12 manually identified point landmarks.II. MATERIALS AND METHODSA. DatasetsTwo volunteers were recruited for this study, a 37 year oldnulliparous pre-menopausal woman and a 65 year old multiparouspost-menopausal woman on hormone replacement<strong>the</strong>rapy. Tl weighted images <strong>of</strong> <strong>the</strong> volunteers were acquiredon a Philips 1.5T Intera using a 3D fast gradient echo sequencewith TR=16.9, TE=6.0, flip angle 35°, axial slicedirection, and a spatial resolution <strong>of</strong> 0.820.822 mm 3and 0.820.822.5 mm 3 , respectively. Each volunteer waspositioned in a fixation device for <strong>breast</strong> biopsies providedby Philips Medical Systems. The right <strong>breast</strong> was placedbetween two sagittal plates without any compression for <strong>the</strong>first image. For <strong>the</strong> second image, <strong>the</strong> plate on <strong>the</strong> <strong>breast</strong>’smedial side was kept immobile, while <strong>the</strong> plate on <strong>the</strong> lateralside was moved manually towards <strong>the</strong> immobile plate by asmuch as <strong>the</strong> volunteer could comfortably tolerate. The imagesshowed that this resulted in a compression <strong>of</strong> about20% in <strong>breast</strong> thickness for each volunteer from 75 mm to60 mm for volunteer one and from 78 mm to 63 mm forvolunteer two. Volunteers were asked not to move between<strong>the</strong>se two scans. Consent <strong>of</strong> volunteers was obtained in accordancewith Guy’s Hospital, London, UK, local researchethical approval 00/11/99. Figures 6a and 7a show exampleslices <strong>of</strong> <strong>the</strong>se images.B. Nonrigid registrationSurface displacements were derived from a full 3D nonrigidregistration, ra<strong>the</strong>r than a 3D surface registration, 15 toimprove <strong>accuracy</strong> by avoiding segmentation and decimationerrors. The nonrigid registration algorithm described inRueckert et al. 14 was employed to register <strong>the</strong> image <strong>of</strong> <strong>the</strong>compressed <strong>breast</strong> to <strong>the</strong> image <strong>of</strong> <strong>the</strong> uncompressed <strong>breast</strong>.The registration was not constrained to conserve volume becauseblood volume may have been reduced due to <strong>the</strong> compression.The images were nonrigidly registered using aregular grid <strong>of</strong> control points approximated by B-splines andnormalized mutual information 16 as a voxel based similaritymeasure. The registration algorithm was applied in a multiresolutionfashion, with an initial control point spacing <strong>of</strong>40 mm. At every resolution level this distance was halved.Based on a visual assessment <strong>of</strong> <strong>the</strong> registration <strong>accuracy</strong>, <strong>the</strong>process was terminated at a final control point spacing <strong>of</strong>10 mm for volunteer one and 2.5 mm for volunteer two. Acquisition<strong>of</strong> <strong>the</strong> images within 15 minutes, in <strong>the</strong> same setting,with a high spatial resolution and without <strong>the</strong> administration<strong>of</strong> contrast agent simplified <strong>the</strong> task <strong>of</strong> registration.Example slices <strong>of</strong> <strong>the</strong> registered images are shown in Figures6b and 7b.C. Biomechanical <strong>breast</strong> <strong>models</strong>1. Geometric FEM modelThe 3D MR images were first corrected for intensity nonuniformityusing <strong>the</strong> N3 program. 17 The images <strong>of</strong> <strong>the</strong> uncompressed<strong>breast</strong> were <strong>the</strong>n manually segmented into <strong>breast</strong>and background, using an interactive tool in ANALYZE. 18The <strong>breast</strong> regions were fur<strong>the</strong>r segmented into fatty andfibroglandular tissue using thresholding followed by manualediting if necessary. The <strong>breast</strong> segmentations were blurredusing an isotropic 3D Gaussian kernel with a standard deviation<strong>of</strong> 1 mm. The blurred segmentations were <strong>the</strong>n downsampledto an isotropic voxel size <strong>of</strong> 7.5 mm to 10 mmTable I such that different mesh resolutions could be testedand <strong>the</strong> limit <strong>of</strong> available elements was not exceeded during<strong>the</strong> meshing stage. A 3D triangulation <strong>of</strong> <strong>the</strong> outer surface <strong>of</strong><strong>the</strong> <strong>breast</strong> was obtained using marching cubes, smoothingand decimation techniques from The Visualization Toolkit. 19Medical Physics, Vol. 33, No. 6, June 2006
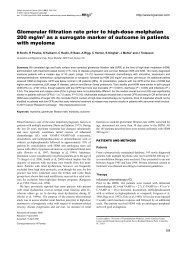
1760 Tanner et al.: <strong>Factors</strong> <strong>influencing</strong> <strong>the</strong> <strong>accuracy</strong> <strong>of</strong> <strong>biomechanical</strong> <strong>breast</strong> <strong>models</strong> 1760FIG. 1. Geometric <strong>models</strong> for volunteer one. a–d 2Daxial example slice <strong>of</strong> <strong>the</strong> 3D MR image or <strong>biomechanical</strong><strong>breast</strong> <strong>models</strong> at <strong>the</strong> same position showing aMR image <strong>of</strong> <strong>the</strong> uncompressed <strong>breast</strong>, b segmentation<strong>of</strong> a, c and d material assignment to <strong>the</strong> elements<strong>of</strong> c GM1 and d GM2. e and f surfacerendering <strong>of</strong> <strong>the</strong> undeformed 3D mesh <strong>of</strong> e GM1 andf GM2.The triangulated volumes were meshed into 10-noded tetrahedralelements with <strong>the</strong> ANSYS FEM package. 20 These elementshave an additional node on each edge, which allowsfor quadratic interpolation <strong>of</strong> <strong>the</strong> element properties. Theskin was modelled by adding 1 mm thick triangular prismswith additional nodes in <strong>the</strong> middle <strong>of</strong> each edge on <strong>the</strong>surface <strong>of</strong> <strong>the</strong> <strong>breast</strong>. Material properties were assigned to <strong>the</strong>elements according to <strong>the</strong> image segmentation.Two geometrical <strong>models</strong>, called GM1 and GM2, werecreated for each volunteer to investigate <strong>the</strong> combined influence<strong>of</strong> <strong>the</strong> element size and shape. The GM1 <strong>models</strong> hadabout one-half as many elements as <strong>the</strong> GM2 <strong>models</strong>, seeTable I. This was achieved ei<strong>the</strong>r by decimating <strong>the</strong> triangularsurface more volunteer one or by down-sampling <strong>the</strong>blurred segmentations more volunteer two. Figure 1 showsa 2D example slice <strong>of</strong> <strong>the</strong> <strong>breast</strong> image, <strong>the</strong> segmentation and<strong>the</strong> corresponding meshes for volunteer one.2. Material <strong>models</strong>Published values <strong>of</strong> <strong>the</strong> stress to strain relationshipYoung’s modulus <strong>of</strong> <strong>breast</strong> tissue types varyconsiderably. 21–23 Models were constructed that covered <strong>the</strong>range <strong>of</strong> values and complexity <strong>of</strong> published stress-strain relationshipsin order to determine <strong>the</strong>ir influence on predicteddeformations in a systematic and quantitative way.a Linear and piecewise-linear <strong>models</strong>: The individualtissue types were modelled as isotropic and homogeneous.Only displacement boundary conditions were applied, andhence only <strong>the</strong> ratios <strong>of</strong> <strong>the</strong> Young’s modulus <strong>of</strong> <strong>the</strong> differenttissue types were required. Six linear <strong>models</strong> were constructedwhere fibroglandular tissue was 1, 1.5, 5, 10, 15 or20 times stiffer than fatty tissue. These values cover andincrease <strong>the</strong> range <strong>of</strong> reported ex-vivo ratios 1.5 to 5.0 forup to 5% prestraining 21–23 and in-vivo ratios 1.3 toTABLE II. Young’s modulus E <strong>of</strong> fatty and fibroglandular tissue for linear and piecewise-linear material <strong>models</strong>.The same Young’s modulus was used for compression as for tension, i.e., Ee=E−e. The last column listsmeanE g /E f for strain e−0.25,0.Young’s modulus E in kPa for strain e0Name Fatty tissue E f FibroglandulartissueE g E gE fLinear MM1 1 1 1.0MM2 1 1.5 1.5MM3 1 5 5.0MM4 1 10 10.0MM5 1 15 15.0MM6 1 20 20.0Nonlinear MM7 718.16e+4.46 if 0e0.2515.1 exp10.0e 0.8184 if e0.25MM8 18.5 1001.3e 2 −272.7e+86.1 4.0MM9 519.7e 2 +2.4e+4.9 123 888.9e 3 −11 766.7e 2 +696.9e+12.1 15.1Medical Physics, Vol. 33, No. 6, June 2006
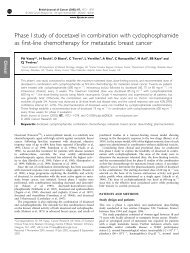
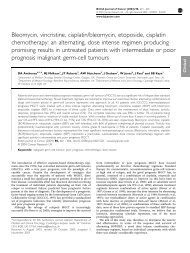
1761 Tanner et al.: <strong>Factors</strong> <strong>influencing</strong> <strong>the</strong> <strong>accuracy</strong> <strong>of</strong> <strong>biomechanical</strong> <strong>breast</strong> <strong>models</strong> 1761FIG. 2. Relative stress-strain relationships<strong>of</strong> fibroglandular to fatty tissuefor MM1–MM9. The right-hand figureshows details <strong>of</strong> <strong>the</strong> relationships withlow stress ratios.5.7. 24–27 Three nonlinear <strong>models</strong> were created in accordanceto previously reported values. 1,3,22 These nine <strong>models</strong> weretested without skin MM1-MM9 and with skin that was 10times stiffer than <strong>the</strong> fatty tissue in <strong>the</strong> linear <strong>models</strong>MM1S-MM9S. The nonlinear stress-strain functions wereapproximated by piecewise-linear functions. The materialproperties <strong>of</strong> <strong>the</strong>se <strong>models</strong> are summarized in Table II. Theirrelative stress-strain functions are depicted in Figure 2.b Hyperelastic <strong>models</strong>: Hyperelastic materials can experiencelarge elastic strain that is recoverable and have generallyvery small compressibility. 28 The stress-strain relation <strong>of</strong>hyperelastic materials is, by definition, completely definedby a strain-energy function . We assessed <strong>the</strong> neo-Hookeanmodel nH = 10 I 1 −3 and <strong>the</strong> five-parameter Mooney-Rivlin model MR = 10 I 1 −3+ 11 I 1 −3I 2 −3+ 01 I 2−3+ 20 I 1 −3 2 + 02 I 2 −3 2 , where ik are <strong>the</strong> model constants,I 1 = 1 2 + 2 2 + 3 2 , I 2 = 1 2 2 2 + 1 2 3 2 + 2 2 3 2 , and i are <strong>the</strong>eigenvalues <strong>of</strong> <strong>the</strong> stretch tensor. 28 These <strong>models</strong> were fittedin <strong>the</strong> least squares sense to <strong>the</strong> strain-stress relationship <strong>of</strong>MM1-MM9 for strains within ±25%. Parameter fitting withANSYS led to unstable materials for <strong>the</strong> Mooney-Rivlin<strong>models</strong>. A constrained parameter fitting was developed instead.The constraints ensured that <strong>the</strong> work required for anarbitrary change in deformation is always positive. No convergenceproblems were experienced for <strong>models</strong> derived inthis way. The parameters <strong>of</strong> <strong>the</strong>se <strong>models</strong> are listed in TableIII. Figure 3 shows <strong>the</strong>ir relative stress-strain relationships incomparison to <strong>the</strong> original functions. Neo-Hookean <strong>models</strong>approximated linear <strong>models</strong> well. Mooney-Rivlin <strong>models</strong>achieved better fits for nonlinear <strong>models</strong> due to <strong>the</strong>ir greaternumber <strong>of</strong> free parameters.c Poisson’s ratios: The influence <strong>of</strong> <strong>the</strong> Poisson’s ratiowas assessed for values 0.499, 0.495, 0.45, 0.4, 0.3, 0.2, and0.1 for <strong>the</strong> linear and piecewise-linear material <strong>models</strong>.3. Boundary conditionsThe influence <strong>of</strong> boundary conditions was assessed forthree different setups, called BC1, BC2, and BC3. Displacementswere prescribed for <strong>the</strong> surface nodes on <strong>the</strong> lateral,medial and posterior side <strong>of</strong> <strong>the</strong> <strong>breast</strong> as illustrated in TableIV. BC1 and BC2 constrained 51% 54% <strong>of</strong> <strong>the</strong> surfacenodes for volunteer one two, while BC3 constrained 24%46%. BC3 constrained no posterior, but more lateral andTABLE III. Parameters <strong>of</strong> strain energy function for hyperelastic material <strong>models</strong>. The last column states meanE g /E f for strain e−0.25,0.Parameters <strong>of</strong> strain energy function in kPa forName Fatty tissue Fibroglandular tissueE gE fNeo-Hookean 10 10MM1nH 0.1289 0.1289 1.0MM2nH 0.1289 0.1933 1.5MM3nH 0.1289 0.6443 5.0MM4nH 0.1289 1.2887 10.0MM5nH 0.1289 1.9330 15.0MM6nH 0.1289 2.5774 20.0MM7nH 19.8360 17.3002 0.9MM8nH 2.4134 11.2613 4.6MM9nH 3.5714 105.0993 29.4Mooney–Rivlin 10 01 20 11 02 10 01 20 11 02MM7MR 46.42 −31.77 37.07 1.96 1.51 42.83 −36.54 51.83 7.33 0.52 0.6MM8MR 5.83 −3.14 0.90 0.64 0.08 26.07 −15.56 8.10 1.71 0.31 3.9MM9MR 10.00 −7.14 3.12 1.82 2.07 263.15 −231.32 387.50 55.81 −0.02 19.9Medical Physics, Vol. 33, No. 6, June 2006
1762 Tanner et al.: <strong>Factors</strong> <strong>influencing</strong> <strong>the</strong> <strong>accuracy</strong> <strong>of</strong> <strong>biomechanical</strong> <strong>breast</strong> <strong>models</strong> 1762FIG. 3. Relative stress-strain relationships<strong>of</strong> fibroglandular to fatty tissuefor hyperelastic <strong>models</strong>. MMinH denotes<strong>the</strong> approximation <strong>of</strong> MMi by aneo-Hookean model and MMiMR represents<strong>the</strong> five-parameter Mooney-Rivlin model <strong>of</strong> MMi.medial nodes than BC1 and BC2. The mean displacementmagnitude <strong>of</strong> <strong>the</strong> posterior medial nodes for BC1 was5.7 mm 1.5 mm for volunteer one and 5.9 mm 2.3 mmfor volunteer two. BC2 assumed zero displacements <strong>of</strong> <strong>the</strong>senodes.The volume change introduced by a boundary conditionwas estimated from <strong>the</strong> volume <strong>of</strong> <strong>the</strong> original and <strong>the</strong>warped surface triangulation. For BC1, <strong>the</strong> triangulation waswarped by <strong>the</strong> 3D nonrigid image registration, because alldisplacements prescribed by BC1 were defined by <strong>the</strong> outcome<strong>of</strong> <strong>the</strong> image registration. This resulted in a volumechange <strong>of</strong> 0.1% −5.9% for volunteer one two and hencewe concluded that <strong>the</strong> deformation <strong>of</strong> <strong>the</strong> <strong>breast</strong> <strong>of</strong> volunteerone did not change volume. For BC2 and BC3, <strong>the</strong> triangulationwas warped by <strong>the</strong> FEM model which provided <strong>the</strong>best mean displacement error for <strong>the</strong> boundary condition,resulting in an estimated volume change <strong>of</strong> −6.4%−6.5% for BC2 and −1.0% −9.45% for BC3.4. FEM model solutionAll FEM model solutions were obtained using a static orsteady state analysis, i.e., <strong>the</strong> <strong>models</strong> were assumed to haverelaxed to <strong>the</strong>ir lowest energy solution. The general approachwas to use <strong>the</strong> preconditioned conjugate gradient PCGsolver; to employ ANSYS’s automatic load step adjustmentwith initially one step linear <strong>models</strong> or four steps nonlinear<strong>models</strong> and maximally 500 steps; and to use an infinitesimaldeformation formulation. This strategy was testedagainst <strong>the</strong> frontal and <strong>the</strong> sparse direct solver 32 and a finitedeformation formulation, i.e., taking account <strong>of</strong> <strong>the</strong> geometricnonlinearity.For pure displacement approaches, nearly incompressiblematerial can lead to predicted displacements that are muchsmaller than <strong>the</strong>y should be, i.e., locking, or to no convergence.The mixed u-p formulation, where pressure is ano<strong>the</strong>rsolution variable, and hyperelastic <strong>models</strong> were employed toovercome <strong>the</strong>se problems for <strong>the</strong> finite deformationformulation. 28A continuous displacement field was derived from <strong>the</strong>node displacements by interpolation with <strong>the</strong> quadratic shapefunction for 10-noded tetrahedral elements. 29D. Thin plate spline interpolationThe FEM solutions were compared to <strong>the</strong> result <strong>of</strong> interpolating<strong>the</strong> prescribed surface displacements by 3D thinplate spline basis functions 30 using The VisualizationToolkit. 19 The 3D thin plate spline basis functions are definedby h p x=x−x p , where x p denotes <strong>the</strong> 3D coordinate<strong>of</strong> <strong>the</strong> pth constrained node.TABLE IV. Configurations <strong>of</strong> three displacement boundary conditions BC1, BC2, and BC3. The surface nodes<strong>of</strong> <strong>the</strong> FE model were classified as posterior, medial and lateral as illustrated by <strong>the</strong> black areas on <strong>the</strong> leftfigures. Surface nodes were ei<strong>the</strong>r free to relax free, displaced using <strong>the</strong> result <strong>of</strong> <strong>the</strong> 3D nonrigid registrationnreg or fixed to remain at <strong>the</strong>ir initial position fixed. BC3 contained additional nodes on <strong>the</strong> lateral andmedial side towards <strong>the</strong> posterior side to compensate for <strong>the</strong> completely unconstrained posterior side.Medical Physics, Vol. 33, No. 6, June 2006
1763 Tanner et al.: <strong>Factors</strong> <strong>influencing</strong> <strong>the</strong> <strong>accuracy</strong> <strong>of</strong> <strong>biomechanical</strong> <strong>breast</strong> <strong>models</strong> 1763FIG. 4. Examples <strong>of</strong> corresponding landmarks <strong>of</strong> <strong>the</strong>deformed and undeformed <strong>breast</strong>. The images show orthogonal2D slices <strong>of</strong> <strong>the</strong> undeformed <strong>breast</strong> left-handside and <strong>the</strong> deformed <strong>breast</strong> right-hand side for volunteerand top and volunteer two bottom. The landmarksare located at <strong>the</strong> center <strong>of</strong> each circle.E. Landmark selectionThe <strong>accuracy</strong> <strong>of</strong> each model was assessed by manuallyidentifying for each <strong>breast</strong> 12 corresponding point landmarksin <strong>the</strong> set <strong>of</strong> images.Reference landmarks were selected in <strong>the</strong> image <strong>of</strong> <strong>the</strong>deformed <strong>breast</strong>. Landmarks were generally placed at bifurcations,centers <strong>of</strong> small tissue regions or tips <strong>of</strong> spiculatedbranches, as illustrated in Figure 4. Two landmarks wereusually picked in every tenth slice for volunteer one and inevery seventh slice for volunteer two. Figure 5 shows <strong>the</strong>distribution <strong>of</strong> <strong>the</strong> landmarks.The corresponding landmarks were <strong>the</strong>n identified in <strong>the</strong>image showing <strong>the</strong> undeformed <strong>breast</strong>. This was repeatedtwo more times by a single observer on different days. Theaverage position <strong>of</strong> <strong>the</strong>se three measurements was assignedto each landmark.Figure 5 shows <strong>the</strong> displacement pattern <strong>of</strong> <strong>the</strong> landmarksfor both volunteers. These differ mainly in <strong>the</strong> inferior tosuperior direction. This was caused by <strong>the</strong> inferior part volunteerone or <strong>the</strong> superior part volunteer two <strong>of</strong> <strong>the</strong> undeformed<strong>breast</strong> being closer to <strong>the</strong> lateral plate.F. Error measuresThe intraobserver variability <strong>of</strong> selecting a landmark wasmeasured by <strong>the</strong> mean Euclidean distance <strong>of</strong> <strong>the</strong> three measurementsto <strong>the</strong>ir average position. The intraobserver variabilityfor <strong>the</strong> 24 landmarks ranged from 0.05 mm to0.77 mm with a mean <strong>of</strong> 0.24 mm and a 90th percentile <strong>of</strong>0.50 mm.The performance <strong>of</strong> a model was quantified by <strong>the</strong> Euclideandistance between <strong>the</strong> position <strong>of</strong> <strong>the</strong> reference landmarkand <strong>the</strong> predicted position <strong>of</strong> <strong>the</strong> corresponding landmark byFIG. 5. Distribution and displacement<strong>of</strong> landmarks in <strong>the</strong> deformed <strong>breast</strong>.The images show <strong>the</strong> orthogonal meanintensity projections <strong>of</strong> <strong>the</strong> <strong>breast</strong> segmentation.The projected landmark positionsare marked by . Lines show<strong>the</strong> projected displacements <strong>of</strong> <strong>the</strong>landmarks. The minimum, mean andmaximum displacement <strong>of</strong> <strong>the</strong> 12landmarks <strong>of</strong> each volunteer are listedin mm for each direction u 1 , lateral tomedial; u 2 , posterior to anterior; u 3 ,inferiorto superior. u denotes <strong>the</strong>length <strong>of</strong> <strong>the</strong> displacements.Medical Physics, Vol. 33, No. 6, June 2006
1764 Tanner et al.: <strong>Factors</strong> <strong>influencing</strong> <strong>the</strong> <strong>accuracy</strong> <strong>of</strong> <strong>biomechanical</strong> <strong>breast</strong> <strong>models</strong> 1764<strong>the</strong> model. This distance is called <strong>the</strong> displacement error. Thedistribution <strong>of</strong> <strong>the</strong> displacement errors from <strong>the</strong> 12 landmarks<strong>of</strong> each volunteer was summarized by its mean and itsmaximum.Statistical significance was not assessed because <strong>of</strong> <strong>the</strong>small number <strong>of</strong> datasets. By definition <strong>the</strong> best <strong>models</strong>hould be that which minimizes <strong>the</strong> displacement error measure.Any model that produced a mean maximum displacementerror that exceeded <strong>the</strong> overall best results by less than<strong>the</strong> mean 90th percentile intraobserver variability <strong>of</strong>0.24 mm 0.50 mm was also classified as best.The sensitivity <strong>of</strong> <strong>the</strong> displacement errors was assessedwith respect to four factors, namely <strong>the</strong> mean Young’smoduli ratio <strong>of</strong> fibroglandular and fatty tissue, <strong>the</strong> Poisson’sratio, <strong>the</strong> boundary condition, and <strong>the</strong> addition <strong>of</strong> skin. Theanalysis was based on <strong>the</strong> model-free sensitivity index S i ,which measures <strong>the</strong> average reduction in variance <strong>of</strong> <strong>the</strong> displacementerror for sample quantity Y when fixing individualfactors F i . S i is given by 1−1/N Nj=1 varY F i = f j /varYwhere N is <strong>the</strong> number <strong>of</strong> possible values for factor F i andvarY F i = f j is <strong>the</strong> variance <strong>of</strong> Y after fixing factor F i tovalue f j . 31G. Overview <strong>of</strong> testsTest 1 — Direct solvers: Results obtained with <strong>the</strong> PCGsolver were compared to results obtained by two direct solvers,namely <strong>the</strong> frontal and <strong>the</strong> sparse direct solver. Testswere conducted for <strong>the</strong> coarser mesh GM1, nine <strong>models</strong>without skin MM1–MM9, a Poisson’s ratio <strong>of</strong> 0.495 0.2for volunteer one two, <strong>the</strong> accurate boundary conditionBC1 and an infinitesimal deformation formulation.Test 2 — Mesh density: This test assessed whe<strong>the</strong>r doubling<strong>the</strong> number <strong>of</strong> mesh elements provided different resultsGM1 versus GM2. The test configurations were o<strong>the</strong>rwiseas in Test 1 when employing <strong>the</strong> PCG solver.Test 3 — Finite deformation formulation: An infinitesimaland a finite deformation formulation were compared in Test3. MM1–MM9, a Poisson’s ratio <strong>of</strong> 0.499 and <strong>the</strong> PCGsolver were employed for <strong>the</strong> infinitesimal deformation formulation.Incompressible hyperelastic <strong>models</strong> fitted toMM1–MM9, a mixed u-p approach and <strong>the</strong> sparse directsolver were used for <strong>the</strong> finite deformation formulation. Testswere only conducted for volunteer one and BC1, since thiswas <strong>the</strong> only deformation that preserved volume.Test 4 — Linear and piecewise-linear <strong>models</strong>, skin, Poisson’sratios, boundary conditions: Six linear and threepiecewise-linear <strong>models</strong> with and without skin MM1–MM9,MM1S–MM9S were compared for three boundary conditionsBC1, BC2, BC3 and Poisson’s ratios 0.499, 0.495,0.45, 0.4, 0.3, 0.2, and 0.1. All <strong>models</strong> were solved using <strong>the</strong>coarser mesh GM1, <strong>the</strong> PCG solver and an infinitesimaldeformation formulation.III. RESULTSThis study assessed <strong>the</strong> influence <strong>of</strong> different tissue propertiesand Poisson’s ratios, boundary conditions, finite elementsolvers and mesh resolutions on <strong>the</strong> <strong>accuracy</strong> withwhich <strong>biomechanical</strong> <strong>breast</strong> <strong>models</strong> can predict <strong>the</strong> displacements<strong>of</strong> internal <strong>breast</strong> structures.A. Visualization <strong>of</strong> resultsFigures 6a and 7a show 2D orthogonal example slices<strong>of</strong> <strong>the</strong> MR <strong>breast</strong> images before and after compressing <strong>the</strong><strong>breast</strong> between two plates for volunteers one and two, respectively.The misalignment due to <strong>the</strong> compression isclearly visible on <strong>the</strong> difference images. Motion artifacts in<strong>the</strong> difference images were greatly reduced after 3D nonrigidregistration Figures 6b and 7b with <strong>the</strong> mean maximumdisplacement error dropping from 6.41 mm12.98 mm to 0.92 mm 1.67 mm for volunteer one andfrom 6.80 mm 11.85 mm to 1.03 mm 2.74 mm for volunteertwo. Less artifact reduction was achieved by <strong>the</strong> <strong>biomechanical</strong><strong>breast</strong> <strong>models</strong>, with <strong>the</strong> mean displacement errorranging from 1.88 mm to 4.58 mm for volunteer one Figures6c–6h and from 2.12 mm to 4.01 mm for volunteertwo Figures 7c–7h.B. Test 1: Direct solversEmploying <strong>the</strong> direct solvers frontal or sparse direct instead<strong>of</strong> an iterative solver changed <strong>the</strong> mean maximumdisplacement errors <strong>of</strong> <strong>the</strong> material <strong>models</strong> from MM1 toMM9 by less than 0.0007 mm 0.0012 mm for both volunteers.In conclusion, employing a direct solver did not influence<strong>the</strong> <strong>accuracy</strong> <strong>of</strong> <strong>the</strong> <strong>models</strong> at <strong>the</strong> precision <strong>of</strong> <strong>the</strong> landmarkselection.C. Test 2: Mesh densityA denser mesh GM2 changed <strong>the</strong> mean maximum displacementerror on average by 0.003 mm 0.004 mm forvolunteer one and by −0.088 mm −0.059 mm for volunteertwo. The mean maximum displacement error <strong>of</strong> <strong>the</strong> individual<strong>models</strong> changed by less than 0.097 mm 0.196 mmfor both volunteers. The <strong>accuracy</strong> <strong>of</strong> <strong>the</strong> <strong>models</strong> were <strong>the</strong>reforenot substantially changed by a finer mesh.D. Test 3: Finite deformation formulation „volunteerone, BC1 only…Finite deformation solutions were obtained for incompressiblehyperelastic <strong>models</strong> using a mixed u-p solutionstrategy for <strong>the</strong> volume preserving deformation, i.e., volunteerone and boundary condition BC1. These were comparedto linear and piecewise-linear <strong>models</strong> that used an infinitesimaldeformation formulation and a Poisson’s ratio <strong>of</strong> 0.499.None <strong>of</strong> <strong>the</strong> finite deformation formulations improved <strong>the</strong>result <strong>of</strong> <strong>the</strong>ir infinitesimal counterpart. Neo-Hookean <strong>models</strong>increased, <strong>the</strong> mean maximum displacement errors onaverage by 0.07 mm 0.15 mm when compared to <strong>the</strong> linear<strong>models</strong> and by 0.28 mm 0.34 mm for MM7–MM9. Approximating<strong>the</strong> nonlinear material <strong>models</strong> by Mooney-Rivlin <strong>models</strong> increased <strong>the</strong> mean maximum displacementerror by 0.14 mm 0.25 mm on average. The volumeMedical Physics, Vol. 33, No. 6, June 2006
1765 Tanner et al.: <strong>Factors</strong> <strong>influencing</strong> <strong>the</strong> <strong>accuracy</strong> <strong>of</strong> <strong>biomechanical</strong> <strong>breast</strong> <strong>models</strong> 1765FIG. 6. Axial, sagittal and coronal 2D example slices <strong>of</strong> volunteer one showing a original images with top compressed <strong>breast</strong>, middle uncompressed<strong>breast</strong>, bottom difference image <strong>of</strong> uncompressed and compressed <strong>breast</strong>; b difference image after 3D nonrigid registration; c–h difference image <strong>of</strong> <strong>the</strong>FEM deformed image and <strong>the</strong> original image <strong>of</strong> <strong>the</strong> compressed <strong>breast</strong> for results with c, e, g smallest mean displacement error and d, f, h largestmean displacement error for BC1-3. The mean displacement error DE are listed for each case.changes introduced by <strong>the</strong> hyperelastic <strong>models</strong> 0.0% to0.1% resembled <strong>the</strong> volume change <strong>of</strong> <strong>the</strong> 3D image registration.The linear and piecewise-linear <strong>models</strong> reduced <strong>the</strong>mesh volume by 0.7%.The mean maximum displacement error changed bymore than 0.24 mm 0.50 mm only when approximatingMM9 by a neo-Hookean model. This worse performance islikely to have been caused by <strong>the</strong> poor approximation <strong>of</strong> <strong>the</strong>stress-strain relationship as is apparent in Figure 3. The neo-Hookean <strong>models</strong> matched <strong>the</strong> linear <strong>models</strong> very well, butstill did not improve <strong>the</strong> results. It must <strong>the</strong>refore be concludedthat incompressible hyperelastic <strong>models</strong> and <strong>the</strong> use<strong>of</strong> a finite deformation formulation results in a similar <strong>accuracy</strong>to linear and piecewise-linear <strong>models</strong> with a Poisson’sratio <strong>of</strong> 0.499 and an infinitesimal deformation formulationfor a volume preserving deformation.FIG. 7. Axial, sagittal and coronal 2D example slices <strong>of</strong> volunteer two a <strong>of</strong> <strong>the</strong> original image with top compressed <strong>breast</strong>, middle uncompressed <strong>breast</strong>,bottom difference image <strong>of</strong> uncompressed and compressed <strong>breast</strong>; b difference image after 3D nonrigid registration; c–h difference image <strong>of</strong> <strong>the</strong> FEMdeformed image and <strong>the</strong> original image <strong>of</strong> <strong>the</strong> compressed <strong>breast</strong> for results with c, e, g smallest mean displacement error and d, f, h largest meandisplacement error for BC1-3. The mean displacement error DE are listed for each case.Medical Physics, Vol. 33, No. 6, June 2006
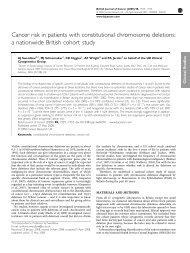
1766 Tanner et al.: <strong>Factors</strong> <strong>influencing</strong> <strong>the</strong> <strong>accuracy</strong> <strong>of</strong> <strong>biomechanical</strong> <strong>breast</strong> <strong>models</strong> 1766FIG. 8. Results for volunteer one, boundary condition BC1 and material <strong>models</strong> without skin. The mean and maximum displacement errors are displayed ascontour plots with respect to <strong>the</strong> meanE g /E f <strong>of</strong> nine material <strong>models</strong> x axis, see Table II and seven Poisson’s ratios y axis, 0.499, 0.495, 0.45, 0.4, 0.3,0.2, 0.1. The contour interval is 0.1 mm. Only <strong>the</strong> five lowest contours <strong>of</strong> each graph are labelled. The largest value <strong>of</strong> each graph is shown by <strong>the</strong> boxednumber. Best results, i.e., result within <strong>the</strong> mean 90th percentile intraobserver variability <strong>of</strong> 0.24 mm 0.50 mm from <strong>the</strong> smallest mean maximumdisplacement error <strong>of</strong> 1.88 mm 3.33 mm, are marked by stars. Dots represent <strong>the</strong> remaining experiments.E. Test 4: Linear and piecewise-linear <strong>models</strong>, skin,Poisson’s ratios, boundary conditionsThe effects <strong>of</strong> <strong>the</strong> average elastic ratio <strong>of</strong> fibroglandularand fatty tissue, and <strong>the</strong> Poisson’s ratio on <strong>the</strong> displacementerror are illustrated for BC1 and <strong>models</strong> without skin in Figures8 and 9. Table V provides an overview <strong>of</strong> <strong>the</strong> mainresults:iiiFor volunteer one and boundary condition BC1, <strong>the</strong>best results were achieved by material <strong>models</strong> wherefibroglandular tissue was at most 4 times stiffer thanfatty tissue and by MM3S while keeping Poisson’sratios high v0.499,0.495, see Figure 8. These<strong>models</strong> reduced <strong>the</strong> mean maximum displacementerror to 1.96 mm 3.43 mm. Assuming that no motionhad occurred at <strong>the</strong> posterior and medial sideBC2 caused substantially higher errors, see TableV. Best results for BC2 required low Poisson’s ratiosv0.1,0.2,0.3, due to <strong>the</strong> introduction <strong>of</strong>volume changes. Keeping <strong>the</strong> posterior side unconstrainedBC3 was better than assuming no motionat <strong>the</strong> posterior side BC2 but was worse than BC1.Best <strong>models</strong> for BC3 had low Young’s moduli ratiosand high Poisson’s ratios. Very similar contour plotswere achieved when adding skin with a Young’smodulus <strong>of</strong> 10 kPa, with <strong>the</strong> mean maximum displacementerror <strong>of</strong> any model changing by less than0.21 mm 0.36 mm. The mean and maximum displacementerror was most sensitive to <strong>the</strong> boundarycondition, see Table VI. The most important factorafter fixing <strong>the</strong> boundary condition was ei<strong>the</strong>r <strong>the</strong>Poisson’s ratio for BC1 apart from <strong>the</strong> mean error<strong>of</strong> MM1–MM6, for BC2 and for <strong>the</strong> maximum error<strong>of</strong> MM7–MM9 for BC3 or <strong>the</strong> Young’s moduli ratio.Thin plate spline interpolation <strong>of</strong> <strong>the</strong> prescribedsurface displacements provided only for BC1 amean and a maximum displacement error that wassimilar to <strong>the</strong> best FE <strong>models</strong>, see Table V.For volunteer two, <strong>the</strong> nonrigid registration introduceda volume change <strong>of</strong> −5.9%. Substantiallyworse results were <strong>the</strong>refore obtained at high Poisson’sratios, see Figure 9 and Table V. Best resultsfor BC1 were achieved by all <strong>models</strong> but MM6,MM9, MM9S while keeping Poisson’s ratios lowv0.1,0.2,0.3. Assuming no motion at <strong>the</strong> posteriorand medial side BC2 introduced lower errorsthan for volunteer one Table V. Not constraining<strong>the</strong> posterior side BC3 provided similar results asBC2. Best results for BC3 were achieved by linear<strong>models</strong> with skin and a low Poisson’s ratio. Addingskin had a bigger impact on <strong>the</strong> results than for volunteerone, with <strong>the</strong> mean maximum displacementerror changing on average, by −0.09 mm−0.42 mm and up to 0.31 mm 2.21 mm. Themean and maximum displacement error was mostMedical Physics, Vol. 33, No. 6, June 2006
1767 Tanner et al.: <strong>Factors</strong> <strong>influencing</strong> <strong>the</strong> <strong>accuracy</strong> <strong>of</strong> <strong>biomechanical</strong> <strong>breast</strong> <strong>models</strong> 1767FIG. 9. Results for volunteer two, boundary condition BC1 and material <strong>models</strong> without skin. The smallest mean maximum displacement error for BC1 was2.12 mm 3.15 mm.sensitive to <strong>the</strong> Poisson’s ratio, see Table VI. Themost important factor after fixing <strong>the</strong> Poisson’s ratiowas <strong>the</strong> boundary condition apart from one casemean error <strong>of</strong> MM7–MM9 for v=0.1 where <strong>the</strong>results were more sensitive to <strong>the</strong> Young’s moduliratio. Thin plate spline interpolation <strong>of</strong> <strong>the</strong> boundaryconstraints Table V provided worse results than<strong>the</strong> best FE <strong>models</strong>.In conclusion, nine material <strong>models</strong> achieved for BC1 andappropriate Poisson’s ratios best results for both volunteers,namely all material <strong>models</strong> where fibroglandular tissue wasat most 4 times stiffer than fatty tissue and MM3S. Theirmean maximum displacement error was on average2.11 mm 3.37 mm. Less accurate or less constrainedboundary conditions BC2, BC3 led to higher errors. Keeping<strong>the</strong> posterior side unconstrained BC3 was better forvolunteer one than assuming no motion at this side BC2.The boundary condition and <strong>the</strong> Poisson’s ratio had <strong>the</strong> highestinfluence on <strong>the</strong> displacement error.IV. CONCLUSIONSThis study evaluated <strong>the</strong> <strong>accuracy</strong> with which <strong>biomechanical</strong><strong>breast</strong> <strong>models</strong> were able to predict <strong>the</strong> in-vivo displacements<strong>of</strong> internal <strong>breast</strong> structures for a pre- and a postmenopausalvolunteer. The first objective <strong>of</strong> this study was t<strong>of</strong>ind a suitable FEM configuration that can produce plausibledeformations during DCE MR mammography acquisition.For this purpose, any model which achieved, for accurateboundary conditions, a mean maximum displacement errorthat exceeded <strong>the</strong> best result by less than 0.24 mm0.50 mm for both volunteers was regarded as suitable. Thesecond aim was to investigate what modelling aspects aremost important.Biomechanical <strong>breast</strong> <strong>models</strong> were able to predict <strong>the</strong> displacements<strong>of</strong> internal <strong>breast</strong> structures i.e., 12 correspondinganatomical landmarks for accurate boundary conditionsBC1, appropriate Poisson’s ratios and suitable elastic propertiesfibroglandular tissue is at most 4 times stiffer thanfatty tissue to a mean <strong>accuracy</strong> <strong>of</strong> 2.0 mm volunteer oneand 2.2 mm volunteer two for a deformation that introduceda mean displacement <strong>of</strong> 6.4 mm and 6.8 mm, respectively.Maximum errors reduced from 13 mm volunteer oneand 11.8 mm volunteer two to 3.4 mm and 3.3 mm, respectively.These suitable elastic properties are within <strong>the</strong>range <strong>of</strong> values reported by in-vivo elastography studies. 24–27The <strong>models</strong> were generally more sensitive to <strong>the</strong> choice <strong>of</strong>Poisson’s ratio or boundary condition than to <strong>the</strong> elasticityproperties. Lower Poisson’s ratios improved <strong>the</strong> predictionwhen volume changes needed to be modelled. Assuming nomotion at <strong>the</strong> posterior and medial nodes, as <strong>of</strong>ten done whenmodelling <strong>breast</strong> compressions, 1–7 led to worse results forvolunteer one than keeping <strong>the</strong> posterior nodes unconstrained.Employing direct solvers or a finer mesh <strong>of</strong> improvedquality did not influence <strong>the</strong> <strong>accuracy</strong>. Using hyperelasticmaterial <strong>models</strong> and a finite deformation formulation did notimprove <strong>the</strong> <strong>accuracy</strong>.The robustness <strong>of</strong> <strong>the</strong> results to <strong>the</strong> elastic properties wereprobably caused by modelling only a few tissue types and byMedical Physics, Vol. 33, No. 6, June 2006
1768 Tanner et al.: <strong>Factors</strong> <strong>influencing</strong> <strong>the</strong> <strong>accuracy</strong> <strong>of</strong> <strong>biomechanical</strong> <strong>breast</strong> <strong>models</strong> 1768TABLE V. Configuration and mean results <strong>of</strong> <strong>the</strong> best FE <strong>models</strong> for Test 4, in comparison to <strong>the</strong> smallest displacement errors <strong>of</strong> <strong>the</strong> FE <strong>models</strong> and <strong>the</strong> resultsfrom a thin plate spline TPS interpolation. Interpolation results within 0.24 mm 0.50 mm from <strong>the</strong> smallest mean maximum displacement error aremarked by stars.Smallesterror mmBest FE <strong>models</strong>Error mmTPS interp.Error mmMeanMaxMaterialmodelPoisson’sratio Mean Max Mean MaxVolunteer oneBC1 1.88 3.33 meanE g /E f 5, MM3S 0.495, 0.499 1.96 3.43* 1.69BC2 2.75 7.12 meanE g /E f 4, MM9S 0.1–0.3 2.85 7.33 3.32BC3 2.25 4.76 meanE g /E f 4, MM8S 0.495, 0.499 2.38 4.90 2.54* 3.46* 7.21* 4.61Volunteer twoBC1 2.12 3.15 all but MM6, MM9S 0.1–0.3 2.25 3.34* 2.20 4.29BC2 2.36 3.85 all but MM5, MM6 0.1–0.4 2.47 3.97 3.57 4.98BC3 2.52 3.80 MM1S–MM6S 0.1–0.3 2.66 3.90 2.83* 4.30<strong>the</strong> FEMs being greatly constrained by surface displacementsand hence acting as interpolants. A similar robustness wasreported by Ruiter et al.. 6,7 The results <strong>of</strong> this study comparefavorably with <strong>the</strong> performance reported by Azar et al. 1 andRuiter et al. 6,7 most likely because <strong>of</strong> improved boundaryconditions and much finer meshes. The 3D image registrationachieved mean errors <strong>of</strong> about 1.0 mm using just <strong>the</strong>information provided by <strong>the</strong> images and a mechanical unconstrainedtransformation model. Whe<strong>the</strong>r such an <strong>accuracy</strong>could be obtained prospectively with a patient specific, heterogeneous<strong>biomechanical</strong> model and matching boundaryconditions, remains to be seen.Predicting <strong>breast</strong> deformations with <strong>the</strong> reported <strong>accuracy</strong>would improve <strong>the</strong> surgical precision for nonpalpable lesions,support <strong>the</strong> registration <strong>of</strong> x-ray and DCE MR mammogramsand provide plausible <strong>breast</strong> deformations for validationand teaching purposes. The main challenge in <strong>the</strong>seapplications is, <strong>the</strong>refore, to establish accurate boundary conditions.When registering, for example, a preoperative MRmammogram to <strong>the</strong> patient for surgical planning, this couldrequire image-visible surface markers, surface extraction <strong>of</strong><strong>the</strong> patient’s <strong>breast</strong> using a stereo camera system, surfaceregistration and ultrasound based registration <strong>of</strong> <strong>the</strong> posteriorside and we are developing a system to do just that.The applied forces in <strong>the</strong>se experiments have not beenmeasured and hence it is not known whe<strong>the</strong>r <strong>the</strong>se wouldjustify <strong>the</strong> 6% volume change observed for volunteer two on<strong>the</strong> basis that venous blood pressure values were exceeded.During DCE MR mammography acquisition, however, nosignificant change in external force is applied.Our investigation <strong>of</strong> <strong>the</strong> most important modelling aspectsis limited because only two volunteers were assessed, onlyone deformation scenario was evaluated and <strong>the</strong> appliedcompressions were much lower than during x-ray mammography.Never<strong>the</strong>less, we have no evidence to suggest that <strong>the</strong>properties <strong>of</strong> <strong>the</strong> <strong>breast</strong> tissue examined are anything buttypical and <strong>the</strong> results <strong>of</strong> this study provide already valuableinformation for <strong>the</strong> practical clinical situation where <strong>the</strong>boundaries <strong>of</strong> <strong>the</strong> <strong>breast</strong> are known ra<strong>the</strong>r accurately.In conclusion, first all material <strong>models</strong> where fibroglandulartissue was no greater than 4 times stiffer than fattytissue provided <strong>the</strong> best results for both volunteers and canbe recommended in conjunction with a high Poisson’s rati<strong>of</strong>or <strong>the</strong> simulation <strong>of</strong> plausible <strong>breast</strong> deformations duringDCE MR mammography. Second, <strong>the</strong> <strong>accuracy</strong> <strong>of</strong> <strong>the</strong> modelwas more affected by <strong>the</strong> choice <strong>of</strong> boundary condition orPoisson’s ratio than by <strong>the</strong> choice <strong>of</strong> elastic material proper-TABLE VI. Sensitivity analysis <strong>of</strong> <strong>the</strong> displacement error. The sensitivity index S i measures <strong>the</strong> average variance reduction <strong>of</strong> <strong>the</strong> mean or maximumdisplacement error when fixing <strong>the</strong> listed factor. Influential factors are indicated by large S i values.Sensitivity index S i in %Volunteer oneVolunteer twoMM1–MM6 MM7–MM9 MM1–MM6 MM7–MM9Fixed factor Mean Max Mean Max Mean Max Mean MaxYoung’s moduli ratio E g /E f 15 3 3 0 0 1 16 3Poisson’s ratio v 5 1 5 0 51 77 39 56Boundary condition 52 92 59 93 35 10 31 31Skin 0 0 0 0 3 4 0 0Medical Physics, Vol. 33, No. 6, June 2006
1769 Tanner et al.: <strong>Factors</strong> <strong>influencing</strong> <strong>the</strong> <strong>accuracy</strong> <strong>of</strong> <strong>biomechanical</strong> <strong>breast</strong> <strong>models</strong> 1769ties. Fur<strong>the</strong>r studies are required to reconfirm <strong>the</strong> importance<strong>of</strong> <strong>the</strong>se modelling factors for o<strong>the</strong>r applications.ACKNOWLEDGMENTSThe authors would like to thank Kate McLeish, DavidAtkinson, Philipp Batchelor, and Andy D. Castellano-Smithfor <strong>the</strong>ir help in image acquisition or model construction.One <strong>of</strong> <strong>the</strong> authors C.T. was supported by EPSRC GR/M52779 and MIAS-IRC EPSRC GR/N14248/01, UK MRCD2025/31. One <strong>of</strong> <strong>the</strong> authors J.A.S. has received fundingfrom Easy Vision Medical IT, Philips Medical Systems, Best,The Ne<strong>the</strong>rlands.1 F. S. Azar, D. N. Metaxas, and M. D. Schnall, “A finite model <strong>of</strong> <strong>the</strong><strong>breast</strong> <strong>of</strong> predicting mechanical deformations during biopsy procedure,”IEEE Workshop on Ma<strong>the</strong>matical Methods in Biomedical Image Analysis,South Carolina, USA, 2000, pp. 38–45.2 F. S. Azar, D. N. Metaxas, and M. D. Schnall, “Methods for modeling andpredicting mechanical deformations <strong>of</strong> <strong>the</strong> <strong>breast</strong> under external pertubation,”Med. Image Anal 6, 1–272002.3 A. Samani, J. Bishop, M. J. Yaffe, and D. B. Plewes, “Biomechanical 3Dfinite element modeling <strong>of</strong> <strong>the</strong> human <strong>breast</strong> using MRI data,” IEEETrans. Med. Imaging 20, 271–279 2001.4 H. M. Yin, L. Z. Sun, G. Wang, T. Yamada, J. Wang, and M. W. Vannier,“ImageParser: A tool for finite element generation from three-dimensionalmedical images,” BioMedical Engineering OnLine, 331 2004.5 P. Pathmanathan, D. Gavaghan, J. Whiteley, M. Brady, M. Nash, P.Nielsen, and V. Rajagopal, “Predicting tumour location by simulatinglarge deformations <strong>of</strong> <strong>the</strong> <strong>breast</strong> using a 3D finite element model andnonlinear elasticity,” Proceedings <strong>of</strong> MICCAI’04, Lecture Notes in ComputerScience 3216 and 3217 Springer-Verlag, Berlin, 2004, pp. 217–224.6 N. V. Ruiter, T. O. Müller, R. Stotzka, H. Gemmeke, J. R. Reichenbach,and W. A. Kaiser, “Finite element simulation <strong>of</strong> <strong>the</strong> <strong>breast</strong>’s deformationduring mammography to generate a deformation model <strong>of</strong> registration,”Proceedings <strong>of</strong> <strong>the</strong> Workshop on Bildverarbeitung fuer die Medizin, InformatikAktuell, 2003, pp. 86–90.7 N. V. Ruiter, Registration <strong>of</strong> x-ray mammograms and MR-volumes <strong>of</strong> <strong>the</strong>female <strong>breast</strong> based on simulated mammographic deformation, Ph.D. <strong>the</strong>sis,Universität Mannheim, 2003.8 J. A. Schnabel, C. Tanner, A. D. Castellano-Smith, A. Degenhard, M. O.Leach, D. R. Hose, D. L. G. Hill, and D. J. Hawkes, “Validation <strong>of</strong>non-rigid image registration using finite element methods: Application to<strong>breast</strong> MR images,” IEEE Trans. Med. Imaging 22, 238–247 2003.9 R. Sinkus, J. Lorenzen, D. Schrader, M. Lorenzen, M. Dargatz, and D.Holz, “High-resolution tensor MR elastography for <strong>breast</strong> tumour detection,”Phys. Med. Biol. 45, 1649–1664 2000.10 E. E. W. van Houten, M. I. Miga, J. B. Weaver, F. E. Kennedy, and K. D.Paulsen, “Three-dimensional subzone-based reconstruction algorithm forMR elastography,” Magn. Reson. Med. 45, 827–837 2001.11 A. Samani, J. Bishop, and D. B. Plewes, “A constrained modulus reconstructiontechnique for <strong>breast</strong> cancer assessment,” IEEE Trans. Med. Imaging20, 877–885 2001.12 C. W. Washington and M. I. Miga, “Modality independent elastographyMIE: A new approach to elasticity imaging,” IEEE Trans. Med. Imaging23, 1117–1128 2004.13 C. Tanner, A. Degenhard, J. A. Schnabel, A. Castellano-Smith, C. Hayes,L. I. Sonoda, M. O. Leach, D. R. Hose, D. L. G. Hill, and D. J. Hawkes,“A method for <strong>the</strong> comparison <strong>of</strong> <strong>biomechanical</strong> <strong>breast</strong> <strong>models</strong>,” IEEEWorkshop on Ma<strong>the</strong>matical Methods in Biomedical Image Analysis,Kauai, USA, 2001, pp. 11–18.14 D. Rueckert, L. I. Sonoda, C. Hayes, D. L. Hill, M. O. Leach, and D. J.Hawkes, “Non-rigid registration using free-form deformations: Applicationto <strong>breast</strong> MR images,” IEEE Trans. Med. Imaging 18, 712–7211999.15 M. Ferrant, S. K. Warfield, C. R. G. Guttmann, R. V. Mulkern, F. A.Jolesz, and R. Kikinis, “3D image matching using a finite element basedelastic deformation model,” Proceedings <strong>of</strong> MICCAI’99, Lecture Notes inComputer Science 1679 Springer-Verlag, Berlin, 1999, pp. 202–209.16 C. Studholme, D. L. G. Hill, and D. J. Hawkes, “An overlap invariantentropy measure <strong>of</strong> 3D medical image alignment,” Pattern Recogn. 32,71–86 1999.17 J. G. Sled, A. P. Zijdenbos, and A. C. Evans, “A nonparametric methodfor automatic correction <strong>of</strong> intensity nonuniformity in MRI data,” IEEETrans. Med. Imaging 17, 87–97 1998.18 AnalyzeDirect Inc. AnalyzeDirect Inc., 11425 Strang Line Road Lenexa,KS 66215, USA. http://www.analyzedirect.com, 2005.19 W. Schroeder, K. Martin, and B. Lorensen, The Visualization Toolkit, 2nded. Prentice-Hall, New Jersey, 1998.20 ANSYS Inc., “Commercial Finite Element Package from ANSYS Inc.,275 Technology Drive, Canonsburg, PA 15317, USA, Version 5.7 and7.1.” http://www.ansys.com, 2000.21 A. Sarvazyan, D. Goukassian, E. Maevsky, and G. Oranskaja, “Elasticimaging as a new modality <strong>of</strong> medical imaging for cancer detection,”Proceedings <strong>of</strong> <strong>the</strong> International Workshop on Interaction <strong>of</strong> Ultrasoundwith Biological Media, Valenciennes, France, 1994, pp. 69–81.22 T. A. Krouskop, T. M. Wheeler, F. Kallel, B. S. Garra, and T. Hall,“Elastic moduli <strong>of</strong> <strong>breast</strong> and prostate tissues under compression,” Ultrason.Imaging 20, 260–274 1998.23 P. S. Wellman, Tactile imaging, Ph.D. <strong>the</strong>sis, Harvard University, 1999.24 A. J. Lawrence, R. Muthupillai, P. J. Rossman, J. A. Smith, A. Manduca,and R. L. Ehman, “MR elastography <strong>of</strong> <strong>the</strong> <strong>breast</strong>: Preliminary results,”Proceedings <strong>of</strong> <strong>the</strong> 6th Scientific Meeting <strong>of</strong> ISMRM, Sydney, Australia,1998, p. 233.25 A. J. Lawrence, P. J. Rossman, J. L. Mahowald, A. Manduca, L. C.Hartmann, and R. L. Ehman, “Assessment <strong>of</strong> <strong>breast</strong> cancer by magneticresonance elastography,” Proceedings <strong>of</strong> <strong>the</strong> 7th Scientific Meeting <strong>of</strong>ISMRM, Philadelphia, USA, 1999, p. 525.26 A. L. McKnight, J. L. Kugel, P. J. Rossman, A. Manduca, L. C. Hartmann,and R. L. Ehman, “MR elastography <strong>of</strong> <strong>breast</strong> cancer: Preliminaryresults,” Am. J. Roentgenol. 178, 1411–1417 2001.27 E. E. W. van Houten, M. M. Doyley, F. E. Kennedy, J. B. Weaver, and K.D. Paulsen, “Initial in vivo experience with steady-state subzone-basedMR elastography <strong>of</strong> <strong>the</strong> human <strong>breast</strong>,” J. Magn. Reson Imaging 17,72–85 2003.28 G. A. Holzapfel, Nonlinear Solid Mechanics, 2nd ed. Wiley, Chichester,UK, 2001.29 A. J. Davis, The Finite Element Method: A First Approach, 1st ed. OxfordUniversity Press, Oxford, 1980.30 F. L. Bookstein, “Principle warps: thin-plate splines and <strong>the</strong> decomposition<strong>of</strong> deformations,” IEEE Trans. Pattern Anal. Mach. Intell. 11, 567–585 1989.31 A. Saltelli, S. Tarantola, and F. C. M. Ratto, Sensitivity Analysis in PracticeWiley, Chichester, UK, 2004.32 Direct solvers use a direct elimination process to solve a system <strong>of</strong> linearequations. Iterative solvers e.g., PCG solver start from an initial estimate<strong>of</strong> <strong>the</strong> solution and <strong>the</strong>n improve it until convergence. Direct solversare generally more robust, but require more memory and are slower.Medical Physics, Vol. 33, No. 6, June 2006