Letno poroÄilo 2009.pdf - UniCredit Banka Slovenija dd
Letno poroÄilo 2009.pdf - UniCredit Banka Slovenija dd
Letno poroÄilo 2009.pdf - UniCredit Banka Slovenija dd
- No tags were found...

You also want an ePaper? Increase the reach of your titles
YUMPU automatically turns print PDFs into web optimized ePapers that Google loves.
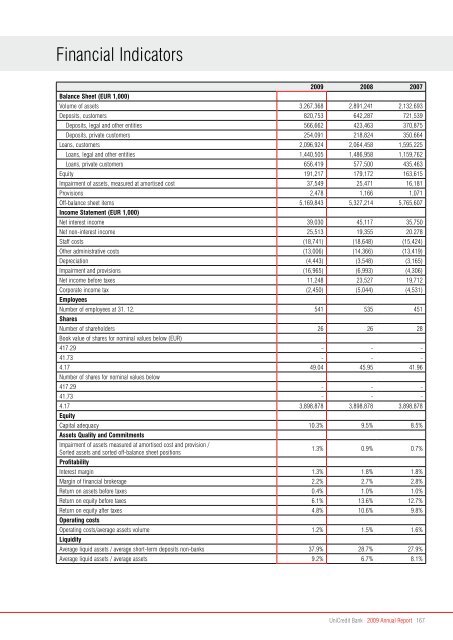
Financial IndicatorsBalance Sheet (EUR 1,000)2009 2008 2007Volume of assets 3,267,368 2,891,241 2,132,693Deposits, customers 820,753 642,287 721,539Deposits, legal and other entities 566,662 423,463 370,875Deposits, private customers 254,091 218,824 350,664Loans, customers 2,096,924 2,064,458 1,595,225Loans, legal and other entities 1,440,505 1,486,958 1,159,762Loans, private customers 656,419 577,500 435,463Equity 191,217 179,172 163,615Impairment of assets, measured at amortised cost 37,549 25,471 16,181Provisions 2,478 1,166 1,071Off-balance sheet items 5,169,843 5,327,214 5,765,607Income Statement (EUR 1,000)Net interest income 39,030 45,117 35,750Net non-interest income 25,513 19,355 20.278Staff costs (18,741) (18,648) (15,424)Other administrative costs (13,006) (14,366) (13,419)Depreciation (4,443) (3,548) (3,165)Impairment and provisions (16,965) (6,993) (4,306)Net income before taxes 11,248 23,527 19,712Corporate income tax (2,450) (5,044) (4,531)EmployeesNumber of employees at 31. 12. 541 535 451SharesNumber of shareholders 26 26 28Book value of shares for nominal values below (EUR)417.29 - - -41.73 - - -4.17 49.04 45.95 41.96Number of shares for nominal values below417.29 - - -41.73 - - -4.17 3,898,878 3,898,878 3,898,878EquityCapital adequacy 10.3% 9.5% 8.5%Assets Quality and CommitmentsImpairment of assets measured at amortised cost and provision /Sorted assets and sorted off-balance sheet positionsProfitability1.3% 0.9% 0.7%Interest margin 1.3% 1.8% 1.8%Margin of financial brokerage 2.2% 2.7% 2.8%Return on assets before taxes 0.4% 1.0% 1.0%Return on equity before taxes 6.1% 13.6% 12.7%Return on equity after taxes 4.8% 10.6% 9.8%Operating costsOperating costs/average assets volume 1.2% 1.5% 1.6%LiquidityAverage liquid assets / average short-term deposits non-banks 37.9% 28.7% 27.9%Average liquid assets / average assets 9.2% 6.7% 8.1%<strong>UniCredit</strong> Bank · 2009 Annual Report 167