Introduction to Statistics, Lecture 11 - Regression Analysis (Chapter ...
Introduction to Statistics, Lecture 11 - Regression Analysis (Chapter ... Introduction to Statistics, Lecture 11 - Regression Analysis (Chapter ...
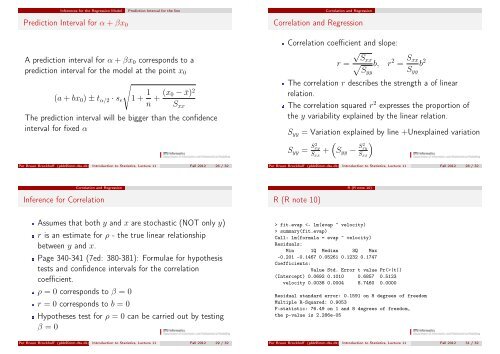
Inferences for the Regression ModelPrediction Interval for α + βx 0Prediction Interval for the lineCorrelation and RegressionCorrelation and RegressionCorrelation coefficient and slope:A prediction interval for α + βx 0 corresponds to aprediction interval for the model at the point x 0(a + bx 0 ) ± t α/2 · s e√1 + 1 n + (x 0 − ¯x) 2S xxThe prediction interval will be bigger than the confidenceinterval for fixed αPer Bruun Brockhoff (pbb@imm.dtu.dk) Introduction to Statistics, Lecture 11 Fall 2012 26 / 32r =√Sxx√Syyb,r 2 = S xxS yyb 2The correlation r describes the strength a of linearrelation.The correlation squared r 2 expresses the proportion ofthe y variability explained by the linear relation.S yy = Variation explained by line +Unexplained variation( )S yy = S2 xyS xx+ S yy − S2 xyS xxPer Bruun Brockhoff (pbb@imm.dtu.dk) Introduction to Statistics, Lecture 11 Fall 2012 28 / 32Correlation and RegressionInference for CorrelationR (R note 10)R (R note 10)Assumes that both y and x are stochastic (NOT only y)r is an estimate for ρ - the true linear relationshipbetween y and x.Page 340-341 (7ed: 380-381): Formulae for hypothesistests and confidence intervals for the correlationcoefficient.ρ = 0 corresponds to β = 0r = 0 corresponds to b = 0Hypotheses test for ρ = 0 can be carried out by testingβ = 0> fit.evap summary(fit.evap)Call: lm(formula = evap ~ velocity)Residuals:Min 1Q Median 3Q Max-0.201 -0.1467 0.05261 0.1232 0.1747Coefficients:Value Std. Error t value Pr(>|t|)(Intercept) 0.0692 0.1010 0.6857 0.5123velocity 0.0038 0.0004 8.7460 0.0000Residual standard error: 0.1591 on 8 degrees of freedomMultiple R-Squared: 0.9053F-statistic: 76.49 on 1 and 8 degrees of freedom,the p-value is 2.286e-05Per Bruun Brockhoff (pbb@imm.dtu.dk) Introduction to Statistics, Lecture 11 Fall 2012 29 / 32Per Bruun Brockhoff (pbb@imm.dtu.dk) Introduction to Statistics, Lecture 11 Fall 2012 31 / 32
R (R note 10)Oversigt1 Running example: Height and weight2 Correlation3 Regression Analysis (kap 11)4 The Method of Least Squares5 Inferences for the Regression ModelInference for intercept and slopeConfidence interval for the linePrediction Interval for the line6 Correlation and Regression7 R (R note 10)Per Bruun Brockhoff (pbb@imm.dtu.dk) Introduction to Statistics, Lecture 11 Fall 2012 32 / 32
- Page 1 and 2: Course 02402Introduction to Statist
- Page 4 and 5: The Method of Least SquaresThe Meth
Inferences for the <strong>Regression</strong> ModelPrediction Interval for α + βx 0Prediction Interval for the lineCorrelation and <strong>Regression</strong>Correlation and <strong>Regression</strong>Correlation coefficient and slope:A prediction interval for α + βx 0 corresponds <strong>to</strong> aprediction interval for the model at the point x 0(a + bx 0 ) ± t α/2 · s e√1 + 1 n + (x 0 − ¯x) 2S xxThe prediction interval will be bigger than the confidenceinterval for fixed αPer Bruun Brockhoff (pbb@imm.dtu.dk) <strong>Introduction</strong> <strong>to</strong> <strong>Statistics</strong>, <strong>Lecture</strong> <strong>11</strong> Fall 2012 26 / 32r =√Sxx√Syyb,r 2 = S xxS yyb 2The correlation r describes the strength a of linearrelation.The correlation squared r 2 expresses the proportion ofthe y variability explained by the linear relation.S yy = Variation explained by line +Unexplained variation( )S yy = S2 xyS xx+ S yy − S2 xyS xxPer Bruun Brockhoff (pbb@imm.dtu.dk) <strong>Introduction</strong> <strong>to</strong> <strong>Statistics</strong>, <strong>Lecture</strong> <strong>11</strong> Fall 2012 28 / 32Correlation and <strong>Regression</strong>Inference for CorrelationR (R note 10)R (R note 10)Assumes that both y and x are s<strong>to</strong>chastic (NOT only y)r is an estimate for ρ - the true linear relationshipbetween y and x.Page 340-341 (7ed: 380-381): Formulae for hypothesistests and confidence intervals for the correlationcoefficient.ρ = 0 corresponds <strong>to</strong> β = 0r = 0 corresponds <strong>to</strong> b = 0Hypotheses test for ρ = 0 can be carried out by testingβ = 0> fit.evap summary(fit.evap)Call: lm(formula = evap ~ velocity)Residuals:Min 1Q Median 3Q Max-0.201 -0.1467 0.05261 0.1232 0.1747Coefficients:Value Std. Error t value Pr(>|t|)(Intercept) 0.0692 0.1010 0.6857 0.5123velocity 0.0038 0.0004 8.7460 0.0000Residual standard error: 0.1591 on 8 degrees of freedomMultiple R-Squared: 0.9053F-statistic: 76.49 on 1 and 8 degrees of freedom,the p-value is 2.286e-05Per Bruun Brockhoff (pbb@imm.dtu.dk) <strong>Introduction</strong> <strong>to</strong> <strong>Statistics</strong>, <strong>Lecture</strong> <strong>11</strong> Fall 2012 29 / 32Per Bruun Brockhoff (pbb@imm.dtu.dk) <strong>Introduction</strong> <strong>to</strong> <strong>Statistics</strong>, <strong>Lecture</strong> <strong>11</strong> Fall 2012 31 / 32


