Complete Census Summary Report 2001 - Antigua & Barbuda
Complete Census Summary Report 2001 - Antigua & Barbuda
Complete Census Summary Report 2001 - Antigua & Barbuda
- No tags were found...

You also want an ePaper? Increase the reach of your titles
YUMPU automatically turns print PDFs into web optimized ePapers that Google loves.
ANTIGUA & BARBUDA SUMMARY: <strong>2001</strong> Issued July 2004<strong>Summary</strong> Social, Economic, Demographic, and Housing CharacteristicsVolume I<strong>2001</strong> <strong>Census</strong> of Population and HousingStatistics Division of the Ministry of Finance and TheEconomy;Joan Moses,Sr. StatisticianRohan Anthony,Sr. Statistician (Ag)Franck M. Jacobs,Chief StatisticianSTATISTICS DIVISION(MINISTRY OF FINANCE & THE ECONOMY)1 st FLOOR A.C.T. BUILDING, CHURCH & MARKET ST.ST. JOHN’S, ANTIGUA
LIST OF TABLESTABLE NO.PAGE NO.1. Population in Institutions, by Age Group, Sex and Type of Institution. 212. Population by Sex and Parish. 223. Population Density by Parish. 234. Population by 5-Year Age Groups and Sex 245. Population by Single Years of Age and Sex. 256. Population by Age Group and Parish. 267. Population by Age Group, Sex and Parish. 278. Population by Enumeration District and Sex. 289. Population by Broad Age Groups. 3410. Population by Broad Age Groups and Sex. 3511. Population by Age Group, Sex and Relationship to Head of Household. 3612. Population by Ethnic Group and Sex. 3813. Population by Age Group, Sex and Ethnic Group. 3914. Population by Religion and Sex. 4015. Population by Age Group, Sex and Religion. 4216. Population by Country of Birth and Sex. 4417. Population by Country of Birth and 10 Year Age Group. 4618. Foreign Born Population by Country of Birth and Year of Last Arrival. 4819. Population 15 Years and Over by Age Group, Sex and Marital Status. 5020. Females 15 Years and Over by Age Group and Union Status. 5121. Population 15 Years and Over by Age of First Union and Sex. 5222. Population by Age Group, Sex and Highest Level of Education. 5323. Population Under 15 Years, Attending School by Type Of School. 5424. Population by Age Group, Sex and Highest Level of Examination Passed. 5525. Population 15 Years and Over by Age Group, Sex and Occupation for which Trained. 5726. Population 15 Years and Over by Main Economic Activity and Sex for(a) Past Week, (b) Past Year. 5827. Employed Persons for (a) Past Week (b) Past Year, by Occupational Group and Sex 5928. Employed Persons for (a) Past Week (b) Past Year, by Industry Group and Sex. 6029. Population 15 Years and Over by Age Group, Sex and Main Economic Activity for Past Week. 6130. Employed Persons for Past Week by Age Group, Sex and Industrial Group. 6231. Population 15 Years and Over, Categorized by their Gross Salary and Pay Period(Including <strong>2001</strong> Income Flash Card) 6432. Employed Persons for Past Week by Employment Type and Sex. 6533. Population 15 Years and Over by Type of Employment and Mode of Travel 6634. Population 15 Years and Over by Main Economic Activity for Past Year and Age Group. 67Table of ContentsNational Statistics Office, <strong>Census</strong> <strong>2001</strong>vi
35. Population 15 Years and Over by Main Economic Activity for Past Year andNumber of Months Worked. 6836. Employed Persons for Past Year by Number of Months Worked and Industry Group. 6937. Females 15-64 by Age Group and Age at First Live Born Child. 7038. Females 15-64 by Age Group and Number of Live Births Ever Had. 7139. Females 15-64 by Union Status, Age Group and Number of Live Births Ever Had. 7240. Females 15-64 by Age Group and Number of Live Births in the Past 12 Months. 7741. Females 15-64 by Union Status, Age Group and Number of Live Births for the Past 12 Months. 7842. Head of Household by Age, Sex of Head, and Size of Household. 8243. Non-Institutional Households: Population by Size of Household and Parish. 8344. Non-Institutional Households: Households by Number of Persons andNumber of Rooms Occupied. 8445. All Households: Dwelling Units by Type and Parish. 8546. Non-Institutional Households: Dwelling Units by Type of Ownership and Parish. 8647. Non-Institutional Households: Dwelling Units by Parish and Year Built. 8748. Non-Institutional Households: Dwelling Units by Construction Material ofOuter Walls and Parish. 8849. Non-Institutional Households: Dwelling Units by Construction Material of Roof and Parish. 8950. Non-Institutional Households: Households by Number of Rooms and Parish. 9051. Non-Institutional Households: Dwelling Units by Number of Bedrooms and Parish. 9152. Non-Institutional Households: Households by Main Source of Water Supply. 9253. Non-Institutional Households by Type of Toilet Facility and Parish. 9354. Non-Institutional Households by Type of Cooking Fuel Used and Parish. 9555. Non-Institutional Households: Households by Number of Radios and Parish. 9756. Non-Institutional Households: Households by Number of Television and Parish. 9857. Non-Institutional Households: Households by Number of Video Recorders and Parish. 9958. Non-Institutional Households: Number of Households With/Without Telephones. 100LIST OF CHARTSCHART NO.PAGE NO.1. Population by Sex and Parish. 222. Population by Ethnic Group and Sex. 383. Population by Religion and Sex. 414. Non-Institutional Households: Dwelling Units by Type of Ownership and Parish. 865. Non-Institutional Households: Dwelling Units by Parish and Year Built. 876. Non-Institutional Households: Dwelling Units by Construction Material of Outer Walls and Parish. 887. Non-Institutional Households by Type of Toilet Facility and Parish. 948. Non-Institutional Households by Type of Cooking Fuel Used and Parish. 96Table of ContentsNational Statistics Office, <strong>Census</strong> <strong>2001</strong>vii
SUMMARY REPORT:POPULATION AND HOUSING CENSUS – <strong>2001</strong>INTRODUCTIONAll data from <strong>Census</strong> <strong>2001</strong> are compiled and presented in three printed report series:1. <strong>Summary</strong> <strong>Report</strong>2. Administrative <strong>Report</strong>3. Analytical <strong>Report</strong>The <strong>Summary</strong> <strong>Report</strong>—provides data based on the <strong>Census</strong> Questionnaire (100-percent questions),Institutional Questionnaires (Open/Restricted Institutions), Hotels/Guest Houses Questionnaires (Longterm);Tourists/Visitors, Crews onboard Ships in harbour on census day, and VagrantsThe Administrative <strong>Report</strong>—details all the procedures used in the census (administrativearrangements, Forms/Documents, Manuals, used, Staffing, Budgets, etc...); covers Planning for the<strong>Census</strong>, Field Enumeration and Post-census activities. This is a two volume series in which Volume Icovers the foregoing and Volume II covers mainly the descriptions of the Enumeration District (ED)boundaries. The report series constitutes a Log/Handbook of censal activities and would thereforeserve to inform future census takers accordingly.The Analytical <strong>Report</strong>—provides detailed analyses of the findings/data from the <strong>2001</strong> census and datacomparisons with previous censuses. Data from each Section of census questionnaire undergorigorous analyses. This report put faces on the facts and figures; highlighting patterns, trends,anomalies, stating projections—providing explanatory narratives to data matrices.Further census data and/or information— not provided/presented in the foregoing literature may beobtained from the National Statistics Office (Statistics Division of the Ministry of Finance and theEconomy) upon request.It is worthy to note that a preliminary report—<strong>Antigua</strong> and <strong>Barbuda</strong> Preliminary <strong>Census</strong> <strong>Report</strong> <strong>2001</strong>was issued in December <strong>2001</strong>. This is a customary/traditional best practice precursor to the <strong>Summary</strong><strong>Report</strong>. This preliminary <strong>Report</strong> provided preliminary data on the population of each EnumerationDistrict, based on a manual count of the data/characteristics captured in the Visitation Recordscompiled by the enumerators.The following notes presented herein constitute only an outline of the conduct of the census for thebenefit of data users (see the Administrative <strong>Report</strong> for detailed coverage).CENSUS DATE<strong>Census</strong> Day was May 28, <strong>2001</strong>, with census moment being midnight on this date!No census was conducted in 1980/1981 due to non-optimal prevailing conditions at that time, andalthough a census was conducted in 1970, little is known /recorded about its allied methodology andprocedures. There is evidence of an Administrative <strong>Report</strong> or Analytical <strong>Report</strong>, only a <strong>Summary</strong>—Three Volume Series of results in tabular form is available. What is known /gleaned from the morass isthat the few tables presented in the Volumes were based on analyses of a twenty per centum—20%sample of completed <strong>Census</strong> Questionnaires.<strong>Antigua</strong> and <strong>Barbuda</strong> <strong>Summary</strong>1National Statistics Office: <strong>Census</strong> <strong>2001</strong>
POPULATION COVEREDThe primary aim of the <strong>2001</strong> census was to determine the number (and characteristics) of all personspresent in the State/country on <strong>Census</strong> Day. This mode of enumeration defines the de facto populationwhich enumerates not only the usual residents of the country but also all non-resident Tourists/Visitors,Businessmen temporarily in the country. Usual residents of the country abroad/absent on <strong>Census</strong> Daywere excluded.There were however, some limitations to the enumeration method cited above, in respect of thetreatment of Tourists/Visitors and Businessmen, Crews on board ships in harbour/port, inmates ofcertain types of institutions, and Vagrants. Only very limited data were collected on these subpopulationsand although they are included in the enumerated Totals, they are in most cases, excludedform the Tabulations. Institutions were divided into three (3) groups:-• Open Institutions— where occupants were free to come and go (free mobility status) and/orengage in normal economic activity.• Restricted Institutions—where occupants were not free to come and go (restricted mobilitystatus) and/or can not engage in normal economic activity.• Hotels/Guest Houses (accommodating six (6) or more persons).Institutions included in Tabulations (Open Institutions):i. Hostels for Nurses, Teachers, Students, and Othersii. Police Barracks and Police Stationsiii. Defence Forceiv. US Navy Basev. US Air Force Base.Institutions excluded from Tabulations (Restricted Institutions):i. Holberton Hospital and Adelin Clinicii. Mental Hospitaliii. Fiennes Institute and other Homes for the Agediv. Her Majesty’s Prison and Boys’ Training Schoolv. Lepers’ Home.Hotels/Guest Houses (accommodation six (6) or more persons):• Long-term residents (residing for six (6) months or more) are included in the Tabulations.It should be noted that only occupants of Restricted Institutions for a period of six (6) months or morewere recorded as residents therein. Occupants resident for fewer than six (6) months should have beenrecorded as Residents at their usual place of residence.If an Institution (including Hotels/Guest Houses) contained separate Quarters for Staff, Care-takers,etc., these were treated as Private Households.REGIONAL CO-ORDINATIONAs with previous censuses in the Region, there was a significant degree of coordination among theanglophone Member States/countries. Regular meetings were convened among the respective censusofficials/experts of the Region under the auspices of the Regional <strong>Census</strong> Coordinating Committee(RCCC) established by the CARICOM Council of Ministers; all <strong>Census</strong> Offices were represented.<strong>Antigua</strong> and <strong>Barbuda</strong> <strong>Summary</strong>2National Statistics Office: <strong>Census</strong> <strong>2001</strong>
The regionally coordinated approach ensured:a) A uniform approach to the overall planning of the censusb) Consistency/standardization of the <strong>Census</strong> Questionnaire as far as the core questions areconcerned; customization along the lines of country-specific requirements could beaccommodated.c) A common approach/standardization to the terms and definitions usedd) Uniform/common/standardized guidelines and materials for training at all levels of the censusoperations.e) A uniform approach to the methods employed in Data Processing.MAIN PROCEDURES OF THE CENSUSFor the purposes of the <strong>Census</strong> (<strong>Census</strong> <strong>2001</strong>), <strong>Antigua</strong> and <strong>Barbuda</strong> was divided into two hundredand eighty eight (288) Enumeration Districts (EDs). These were areas so defined to enclose acomfortably enumerable number of households—about eighty to one hundred (80–100) and to fallwithin the boundaries a given Parish; those EDs at extreme points of the Parish would have theirboundaries coincide with the Parish boundaries accordingly. There were a few EDs whose boundariesoverlapped the Parish boundary.One enumerator was allocated/assigned to one such ED and was required to list all buildings in the EDand to interview every household to obtain the required information. Data on each building, DwellingUnit and household—including the number of persons residing in the household, were entered in theVisitation Record.The enumerator was instructed to interview the Head of the household in order to obtain the censusinformation in respect of all persons within the household and to enter all such data onto the <strong>Census</strong>Questionnaire. They were specifically instructed further, to ask/pose questions to the respondentexactly as written on the Questionnaire.Since it was not possible to interview all households on <strong>Census</strong> Day, EDs were therefore enumeratedduring the two (2) weeks prior to <strong>Census</strong> Day in order to obtain the detailed information, then in the two(2) days after <strong>Census</strong> Day each household was revisited to verify the status of the household size—number of household occupants, and to make any necessary adjustments of count accordingly—newbirths would be added and deaths would be subtracted to update the household data.DATA PROCESSINGThe <strong>Census</strong> Questionnaire was a mark-sensing document on which most of the questions pre-codedthereby requiring enumerators simply to shade the appropriate bubbles completely—using a specificgraphite grade pencil.<strong>Complete</strong>d Questionnaires underwent a manual first-edit, and those questions requiring writtenresponses were coded onto the Questionnaire at this stage, so that all manually recorded/captured onquestionnaires could now be easily transformed into electronic format by means of data capture via anOptical Mark Reader—(OMR) machine simply by passing the appropriately prepared documentsthrough the Reader attached to a computer; the scanned data were then captured and stored on thecomputer for further processing.<strong>Antigua</strong> and <strong>Barbuda</strong> <strong>Summary</strong>3National Statistics Office: <strong>Census</strong> <strong>2001</strong>
This Office used the Integrated Microcomputer Processing System (IMPS) and CSPro 1packages for the data processing aspect of the <strong>2001</strong> census.softwareThe scanned data were subjected to rigorous and exhaustive processes of editing, verification andconsistency checks to ensure optimal quality control and data output. The clean—error free andconsistent data produced were then tabulated accordingly. The core tables produced—using IMPS’sQUICKTAB and CENTS modules, were in accordance with a Regional Tabulation Plan.In addition to the core sets of tables presented in the various <strong>Census</strong> <strong>Report</strong>s/Series, data users mayaccess more detailed/user-specific data directly from the <strong>Census</strong>/Statistics Office. These “extra” Tableswould then be extracted by the application of CENTS—CENsus Tabulation System where TablespecificProcedures/subroutines would have to be developed, compiled and run/executed.This is the second time in the history of <strong>Antigua</strong> and <strong>Barbuda</strong>—the first being the 1991 <strong>Census</strong> ofPopulation and Housing, that population census data have been in its entirety, electronically processedhere/in the State.THE CENSUS QUESTIONNAIREThe <strong>Census</strong> Questionnaire comprises thirteen (13) main Sections. viz.,SECTION 1—MIGRATIONSECTION 2—HOUSINGSECTION 3—CRIMESECTION 4—CHARACTERISTICS (FOR ALL PERSONS)SECTION 5—DISABILITY (FOR ALL PERSONS)SECTION 6—HEALTH (FOR ALL PERSONS)SECTION 7—BIRTHPLACE AND RESIDENCE (FOR ALL PERSONS)SECTION 8—EDUCATION (FOR ALL PERSONS)SECTION 9—PROFESSIONAL, TECHNICAL AND VOCATIONAL TRAINING (FOR ALL PERSONS 15 YEARS AND OVER)SECTION 10—MARITAL STATUS, UNION STATUS (FOR ALL PERSONS 15 YEARS AND OVER)SECTION 11—FERTILITY (FOR ALL PERSONS 15 YEARS AND OVER)SECTION 12—ECONOMIC ACTIVITY (FOR ALL PERSONS 15 YEARS AND OVER)SECTION 13—WHERE SPENT CENSUS NIGHT.Some of these Sections, as shown above are directed to specific “universes”/sub-populations viz.,Heads of Households, persons aged fifteen (15) years and over, females aged 15 – 64, etc….Tablesrelating to each of the questions in the Questionnaire may not appear in this particular <strong>Report</strong>, hencereference should be made to other Volumes/Series. A copy of the <strong>Census</strong> Questionnaire is included inAppendix B.IDENTIFICATIONThis Section of the Questionnaire—HOUSEHOLD MEMBERS, recorded the names (Surnameand First Name) of all members of the household but this information was not entered into thecomputer nor was it read/scanned by the Optical Mark Reader (OMR).This information wasrecorded for official purpose—not accessible by unauthorized persons.1 freely distributable software packages designed and developed by the US Bureau of the <strong>Census</strong> specifically for dataprocessing of <strong>Census</strong>es and Surveys<strong>Antigua</strong> and <strong>Barbuda</strong> <strong>Summary</strong>4National Statistics Office: <strong>Census</strong> <strong>2001</strong>
The seventeen (17) digit identification number, together with the Person Number with respect to thehousehold uniquely identifies the individual. This number also serves to identify Country, Parish, MajorDivision, Constituency, Urban/Rural, ED and Household in that order—the first two digits represent theCountry, the third and fourth digits represent the Parish, the fifth and sixth digits represent the MajorDivision, seventh and eighth digits represent the Constituency, the ninth represents Urban/Rural areas,the tenth to fourteenth digits represent the ED and the last three (fifteenth to seventeenth) digitsrepresent the household.QUESTIONS SEGMENT:SECTION 1—MIGRATIONThese questions sought information on the external migration of any household member or membersduring the period 1991 – <strong>2001</strong>; by Year Moved (1991 – <strong>2001</strong>), Educational Level when Moved,Gender/Sex, Age when Moved, Occupation when Moved, and Name of Country of Migration.These questions were directed to the Head of the Household and requested of each migrant householdmember.SECTION 2—HOUSINGThese questions were primarily directed at the Head of the Household and the categories used wererelatively self-explanatory (see <strong>Census</strong> Questionnaire in Appendix B).Type of DwellingThe concepts of Townhouse and Double House/Duplex are not well known in <strong>Antigua</strong> and <strong>Barbuda</strong>since there are few of these types of Dwelling Units.Construction Material of Outer WallThe term Makeshift is used to include unconventional materials viz., Galvanized Sheets, Cardboard,etc.Construction Material of RoofAs in the case of Material of Outer Wall, the Construction Material of Roof includes unconventionalmaterials viz., Cardboard, Roofs of Cars/Vehicles, etc.Type of Toilet FacilitiesAt the time on enumeration there were no Sewer systems connected to Households in <strong>Antigua</strong> and<strong>Barbuda</strong>.Number of RoomsThe Number of Rooms actually used for living is recorded here and is defined as areas permanentlyseparated /partitioned from other parts of the Dwelling Unit by means of walls, and excludesVerandahs, Toilets, Pantries, Corridors, and Kitchens. A room curtained off by a temporary partition isnot considered to be a separate room.Number of BedroomsAs in the case of Number of Rooms above, makeshift arrangements with Curtains or Blinds may not beregarded as Bedrooms. A Bedroom must be used mainly for sleeping purposes.<strong>Antigua</strong> and <strong>Barbuda</strong> <strong>Summary</strong>5National Statistics Office: <strong>Census</strong> <strong>2001</strong>
SECTION 3—CRIMEThese questions sought to solicit data on:o Whether any member of the Household had been a victim of crime during the five year period(1996 – <strong>2001</strong>)o Whether any member of the Household had bee a victim of crime during the twelve (12) monthperiod( May 200 – May <strong>2001</strong>)o The Nature of the crime, ando Whether or not it was reported to the Police.SECTION 4—CHARACTERISTICS (FOR ALL PERSONS)This section asked of all persons, and covers the basic social, demographic and economiccharacteristics of household personnel, viz., Age, Gender/Sex, Ethnic /Racial/National Group, Religion,and Relationship to Head of Household.Relationship to Head of HouseholdThe Head of the Household was simply defined, for the purposes of the census, as the personacknowledged as such by members of the Household or a person self designated; the Head of theHousehold is merely the reference person to whom the all questions asked of each member of theHousehold, are directed.The eight (8) categories used in the classification are:1 Head 5 Grandchild2 Spouse/Partner 6 Parent/Parent-in-Law3 Child 7 Other Relative4 Son/Daughter-in-Law 8 Non-RelativeThese categories are interpreted broadly to include the Spouse/Partner of the HeadThus, the category 3—Child means a child of either the Head of the Household or of theSpouse/Partner of the Head of the Household. Similarly, for categories 4, 5, 6, and 7.Non-Relative may include a household Helper (living within the Household), a Friend, A Guest, or anyother person not related to either the Head of the Household or to the Spouse/Partner of the Head ofthe Household.Some misconceptions of the term Son/Daughter-in-Law did occur and were detected during the editingphase. Several instances did arise where a person was recorded as Son/Daughter-in-Law but was tooyoung for this category. Most appeared to be the Child or Grandchild of the Spouse/Partner of the Headof the Household; the necessary corrections were made accordingly.Gender/SexGender/Sex was recorded as either Male or Female.It was stipulated that during the editing of the data that Gender/Sex was recorded for each person;there are therefore no record of persons having the value for Gender/Sex as Not Stated (NS).AgeAge was recorded/defined as, “age last birthday”. Enumerators were also instructed not to leave thisvariable with a Blank value; if Age was not known (by the respondent), then enumerators were advisedto make estimates based on references to times of occurrences of outstanding/historical/epic eventsviz., Fires, Floods, Hurricanes or Earthquakes. The data was scrutinized in detail during the editing<strong>Antigua</strong> and <strong>Barbuda</strong> <strong>Summary</strong>6National Statistics Office: <strong>Census</strong> <strong>2001</strong>
process and any remaining Blanks for the variable, Age were replaced with imputations based onfamilial relationships, and in some instances, on further probing and/or enquiries; there are therefore norecords of persons having the value of the variable for Age as Blank or Not Stated (NS).Ethnic/Racial/National GroupAs it pertains to all questions on the <strong>Census</strong> Questionnaire, Enumerators were instructed to as thequestion verbatim—as printed on the Questionnaire: To what Ethnic, Racial or National Group doyou think……belongs ? The category selected/recorded was according to the respondent’s responseand not according to the enumerator’s opinion gleaned from observation or other.The categories/options were:1 African/Negro/Black 6 Syrian/Lebanese2 Amerindian/Carib 7 Caucasian/White3 East Indian 8 Mixed4 Chinese 9 Other(please specify)5 Portuguese 10 Don’t Know/Not StatedIn those cases where the respondents indicated the category Other (please specify), there was spaceon the Questionnaire to record the responses accordingly.ReligionThe Religion recorded was that to which the respondents said they adhered/belonged. There weretwenty one (21) categories.In those cases where the respondents indicated the category Other (please specify), there was spaceon the Questionnaire to record the responses accordingly.The categories/options were:1 Anglican 12 Pentecostal2 Baptist 13 Presbyterian3 Bahai Faith 14 Rastafarian4 Brethren 15 Roman Catholic5 Church of God 16 Salvation Army6 Evangelical 17 Seventh Day Adventist7 Hinduism 18 Spiritual Baptist8 Jehovah Witness 19 None9 Methodist 20 Not Stated10 Moravian 21 Other (specify)11 IslamSECTION 5—DISABILITY (FOR ALL PERSONS)LONGSTANDING DISABILITY:This subsection sought to obtain responses on: (i) Whether or not the respondent suffered from anylong-standing disability; (ii) the origin of the disability, and (iii) the age at which the disability began.<strong>Antigua</strong> and <strong>Barbuda</strong> <strong>Summary</strong>7National Statistics Office: <strong>Census</strong> <strong>2001</strong>
TYPE OF DISABILITY:The Enumerator was not expected to make any judgment as to the nature or correctness of theresponse given to this question, but simply to record the actual response(s) by shading the appropriateoption(s). Individuals may suffer from more than one of the disabilities in the category list, hencemultiple selections is possible.In those cases where the respondents indicated the category Other (please specify), there was spaceon the Questionnaire to record the responses accordingly.The categories/options were:1 Sight(even with glasses, if worn) 6 Gripping2 Hearing (even with hearing aid, if worn) 7 Learning3 Speech (talking) 8 Behavioural4 Mobility (walking, standing, climbing stairs) 9 Other (specify)5 Body Movements (reaching, crouching, kneeling) 10 Not StatedThe remaining questions sought:• Whether the disability/major impairment ever diagnosed by a medical doctor• Whether the impaired/disabled person had any difficulty doing the following:a. Learning, remembering, or concentratingb. Dressing, bathing, or getting around inside the homec. Going outside the home alone to shop or to visit a Doctor’s officed. Working at a job or business (for persons 15 YEARS OLD OR OVER)The last question for this section sought to find out whether the disabled/impaired person had to useany of the following aids; the categories were:1 Wheelchair 6 Cane2 Walker 7 Prosthesis3 Crutches 8 Orthopedic Shoes4 Brailler 9 Other (specify)5 Adapted Car 10 NoneIn those cases where the respondents indicated the category Other (please specify), there was spaceon the Questionnaire to record the responses accordingly.SECTION 6—HEALTH (FOR ALL PERSONS)CHRONIC ILLNESS: ILLNES:This subsection sought to obtain responses on: (i) Whether or not the respondent suffered from any ofthe following illnesses (more than one oval may be shaded/selected).In those cases where the respondents indicated the category Other (please specify), there was spaceon the Questionnaire to record the responses accordingly.<strong>Antigua</strong> and <strong>Barbuda</strong> <strong>Summary</strong>8National Statistics Office: <strong>Census</strong> <strong>2001</strong>
The categories were:1 Sickle Cell Anæmia 9 Cancer2 Arthritis 10 HIV3 Asthma 11 AIDS4 Diabetes 12 Lupus5 Hypertension 13 Carpal Tunnel Syndrome6 Heart Disease 14 Other (please specify)7 Stroke 15 None8 Kidney Disease 16 Not StatedUTILIZATION OF MEDICAL FACILITY:This subsection sought to obtain responses on:(i)Whether or not the respondent utilized a medical facility in the pastmonth.If the response was positive, then the respondent was required to select a category—main facility fromthe list below:In those cases where the respondents indicated the category Other (please specify), there was spaceon the Questionnaire to record the responses accordingly.The categories were:1 Public Health2 Family Planning Clinic3 Public Health Centre Medical Visiting Stations4 Private Clinic / Hospital5 Private Doctor’s Office6 Pharmacy7 Other (specify)8 Not Stated(ii)Whether the respondent was covered by an Insurance (Health, Life, etc.)and/or Employee Medical Plan(iii) What type of Insurance does the respondent have?(More than one oval may be marked) ; In those cases where therespondents indicated the category Other (please specify), there was space on the Questionnaire torecord the responses accordingly.The categories were:1 NIS/Social Security2 Group Health Insurance3 Individual Health4 Life with Health5 Endowment with Health6 Life7 Other (specify)<strong>Antigua</strong> and <strong>Barbuda</strong> <strong>Summary</strong>9National Statistics Office: <strong>Census</strong> <strong>2001</strong>
SECTION 7—BIRTHPLACE AND RESIDENCE (FOR ALL PERSONS)BirthplaceEnumerators were instructed to record the place of normal/usual residence of the mother, rather thanthe location of the hospital or home where the birth actually occurred.For locally born population, the location—Major Division and District/Parish was recorded.International MigrationFor the locally born population, additional questions were asked as to whether the person/respondenthad ever lived in another country, and if so What Country? No questions were asked of therespondent as to what time period the respondent returned to this Country.However, persons born abroad were asked, in what year did you/he/she last come to live in thiscountry?NOTE: A further question was asked concerning International Migration, under SECTION 1—MIGRATION where the emphasis/information sought was on permanent migration so that persons whohad left for purposes of Study, Medical Treatment or Extended Vacation were not included.Internal MigrationThese questions were asked of all persons whether or not locally born or foreign born—born abroad,and attempted to identify movement of persons within the country. The questions identified, for personswho had moved, where they last lived and what time they came to live in the Village, Town or Citywhere they presently reside—on <strong>Census</strong> Day/time of enumeration.SECTION 8—EDUCATION (FOR ALL PERSONS)The questions on Education were asked of persons between ages three (3) and forty-nine (49), andwhether or not they were still attending school.Attending School or Educational InstitutionThis includes both full-time and part-time attendance. Enumerators were instructed not to ask this ofInfants under one (1) year of age. Hence there should be no record persons under one year of ageattending school or Educational Institution.Full-time/Part-timeThis enables data extraction by either category.Type of School or Educational Institution AttendedIn those cases where the respondents indicated the category Other (please specify), there was spaceon the Questionnaire to record the responses accordingly.The categories were:1 Day Care/ Nursery 8 Sixth Form (‘A’ Level )2 Pre-School 9 Technical/ Vocational School3 Infant/Kindergarten 10 University4 Special Education 11 Adult Education5 Primary 12 Other (please specify)6 Senior Primary/Junior Secondary/ Post Primary 13 Not Stated7 Secondary<strong>Antigua</strong> and <strong>Barbuda</strong> <strong>Summary</strong>10National Statistics Office: <strong>Census</strong> <strong>2001</strong>
Address of School / InstitutionThe location of each School/Institution was identified with the Enumeration District (ED) within which itfell. This was achieved by accessing the Visitation Records for the Master List of Schools/Institutionswith their respective ED numbers, and also cross-checked with a list of a Schools/Institutions providedby the Ministry of Education.Mode of Travel to School/InstitutionIn addition to the data obtained from previous questions, a more detailed pictured can be obtained inrespect of travel patterns and distances traveled to school/Institution.The question here was: What is your/his/her main mode of travel to the School or Institution?The categories were:1 Walk2 Bicycle3 Private Car or Vehicle4 Government School Bus5 Public Transport (mini-bus)6 Hired Transport7 Don’t Know/Not StatedNote: The question asked for the main mode of travel to School or Institution.Educational AttainmentThis was measured via two main inputs:(i) Highest level of formal education acquired, and(ii) Highest certification obtainedThe actual questions were:• What is the highest level of formal education…..has reached?And the categories were:1 Day Care/ Nursery2 Pre-School3 Infant/Kindergarten4 Primary Grade/Standard (1-3) years)5 Primary Grade/Standard (4-6 years)6 Secondary7 Pre-university/Post Secondary/College8 University9 Other (specify)10 None11 Not Stated• What is the highest certificate, diploma or degreethat you/he/she have earned?And the categories were:1 School leaving (e.g. Standard Six or Seven school leaving exam)2 Cambridge School Certificate<strong>Antigua</strong> and <strong>Barbuda</strong> <strong>Summary</strong>11National Statistics Office: <strong>Census</strong> <strong>2001</strong>
3 GCE ‘O’ Levels or CXC:Number of subjects0 1 2 3 4 5 6 7 8 9 or more Not Stated4 High School Diploma/Certificate5 GCE ‘A’ Levels:Number of subjects1 2 3 4 or more Not Stated6 Under-graduate Diploma7 Other Diploma/Certificate8 Associate Degree9 Professional Certificate10 Bachelors Degree11 Post Graduate Diploma (Bachelors & half content required for Masters)12 Higher Degree (Masters or Doctoral Degree)13 Other (specify)14 None15 Not StatedSECTION 9—PROFESSIONAL, TECHNICAL ANDVOCATIONAL TRAINING (FOR ALL PERSONS YEARS AND OVER)The questions here sought to find out:(a) whether the respondent was ever trained/is being trained for any occupation or profession(Training can be formal or non-formal), and(b) the occupation(s)/profession(s) for which trained (the most recent one first); the appropriateISCO or ISIC codes are inserted in the spaces/boxes provided;(c) whether present job is related to most recent training(d) In what year or period respondent completed the training or is still being trained?1 <strong>2001</strong> 7 1980 – ‘892 2000 8 Before 19803 1999 9 Did not complete training4 1998 10 Still being trained5 1994 -‘97 11 Not Stated6 1990 -‘93(e) What was the main educational method of training used in respondent’s field of highesttraining?1 On the job 8 Technical Institution2 Apprenticeship 9 Other Institutional Training3 Private study/ Correspondence 10 University (on campus)4 Secondary School 11 Distance Learning5 Vocational/Trade 12 Virtual Learning6 Commercial/Secretarial 13 Other (specify)7 Business/Computer School 14 Not Stated<strong>Antigua</strong> and <strong>Barbuda</strong> <strong>Summary</strong>12National Statistics Office: <strong>Census</strong> <strong>2001</strong>
(f) What is/was the duration of training programmes for the highest level of training whichrespondent completed/attempted or is undergoing?1 Under 3 months 6 2 years and less than 3 years2 3 months and less than 6 months 7 3 years and less than 4 years3 6 months and less than 1 year 8 4 years and over4 1 year and less than 1.5 years 9 Not Stated5 1.5 years and less than 2 yearsSECTION 10—MARITAL STATUS, UNION STATUS(FOR PERSONS 15 YEARS AND OVER)The questions asked hereunder were asfollows:79. What is your/…..’s present union status?1 Legally married (Go to Q. 81)2 Common-law union (Go to Q.80 and Q.82)3 Visiting partner4 Married but not in a union (Go to Q.81)5 Legally separated and not in a union (Go to Q.81)6 Widowed and not in a union (Go to Q.81)7 Divorced and not in a union (Go to Q.81)8 Not in a union9 Don’t Know/Not Stated80. Have you ever been married?1 Yes 3 Don’t know/Not Stated2 No81. Have you/has … ever lived together with apartner in a common-law relationship?1 Yes 3 Don’t know/Not Stated2 No82. How old were you/he/she when you/he/shewere/was first married or lived with apartner?Age0 1 2 3 4 5 6 7 8 90 1 2 3 4 5 6 7 8 9Not ApplicableSECTION 11—FERTILITY (FOR ALL PERSONS YEARS AND OVER)The questions asked hereunder were asfollows:83. How many live-births/children has …ever had/fathered? (if ZERO, enter 00 &Go to Q. 80)Live 0 1 2 3 4 5 6 7 8 9Births 0 1 2 3 4 5 6 7 8 984. How old were you/he/she whenyou/he/she fathered/had the first livebornchild?Age 0 1 2 3 4 5 6 7 8 90 1 2 3 4 5 6 7 8 9<strong>Antigua</strong> and <strong>Barbuda</strong> <strong>Summary</strong>13National Statistics Office: <strong>Census</strong> <strong>2001</strong>
SECTION 11—FERTILITY (FOR ALL PERSONS YEARS AND OVER)CONTINUED85. How old were you/she/he at the birth ofyour/her/his last live-born child?Age 0 1 2 3 4 5 6 7 8 90 1 2 3 4 5 6 7 8 9Q.86 TO Q. 89 TO APPLY TO FEMALESUNDER 50. OTHERS GO TO Q.9086. How many living babies/live-births didyou/she have in the last 12 months?1 None (Go to Q.90) 4 Twins2 One 5 Three or more3 Two separate births87. What is/are the sex (es) of this child/thesechildren (Born within the last 12 months?)Number of Boys 0 1 2 3 4 5Number of Girls 0 1 2 3 4 588. Have any of these babies died?1 Yes2 No (Go to Q.90 )89. How many died?Within the first month of life 0 1 3 4 5After 1 month but before one 0 1 2 3 4 5yearSECTION 12—ECONOMIC ACTIVITY (FOR PERSONS 15 YEARS AND OVER)The questions were asked of all persons 15 years and over. Note that two reference periods were usedin respect of economic activity:(i) The past twelve (12 ) months (Q. 90 – Q. 93)(ii) The past week ( Q. 94 )Also questions were asked in respect of job seeking/looking for work during the past two (2) months(Q. 95, Q.96), and whether any other kind of work at all was done for any length of time—including:helping in a family business/farm, street vending, or work at home.Worked— a person was classified as worked if he/she were engaged in the production of Goodsand/or Services for sale during most of the reference period; this would include Employers, Employees,Own-Account Workers, Self-Employed, and others receiving a wage or salary. It also includesTrainees, and Apprentices whether or not paid, as well as Unpaid Helpers/Hans and family workers oncommercial Farms and other Enterprises. The duration of work referred to here was not necessarilycontinuous but should take up “most”/a greater portion of the reference period compared with theduration of work done under any other category [of work/economic activity].Had a job but did not work—applied to persons who had a job but spent most of the reference periodaway from the job mainly owing to illness, injury, vacation or some other cause(s).Also included arepersons on Temporary Lay Off, or Industrial Dispute.Looked for work—means that a person spent some time/most of the reference period actively lookingfor work/job hunting.Wanted work and available—includes persons who are ready, willing and able to work but who didnot actively look for work.The preceding four categories thus defined—Worked, Had a job but did not work, Looked for workWanted work and available constitute the economically active population.<strong>Antigua</strong> and <strong>Barbuda</strong> <strong>Summary</strong>14National Statistics Office: <strong>Census</strong> <strong>2001</strong>
The economically inactive population comprises: those engaged in Home Duties (e.g., housewivesand others engaged in cooking, cleaning, child rearing, etc. but who did not receive monetary pay forsuch activities;Attended School—applies to those who for most of the reference period were full-time students atschool or university; these persons could/may have entered the labour force for a minor part of thereference hence they would still be categorized as Attended School. The remaining categories of theeconomically inactive population were, Retired, and Disabled. Other and Not Stated completed thecategory.Question 90 sought to find out what the respondent did most during the past 12 months (relative to<strong>Census</strong> Date)—the categories are in bold type face above. This response set would provide data thatwould determine the Usually Employed Population, level of unemployment, underemployment withrespect to this reference period.Question 91 sought to find out whether any form of work at all (including work at home, e.g. piece work,decorative stitching, smocking, etc.) was done during the past 12 months (relative to <strong>Census</strong> Date)Question 92 asked whether or not the respondent ever worked or had a job.Question 93 sought to find out how many months the respondent worked during the past 12 months(relative to <strong>Census</strong> Date).Question 94 sought to find out what the respondent did most during the past week—the categories arein bold type face above. This response set would provide data that would determine the CurrentlyEmployed Population—a snapshot of the employment status that would provide data on, level ofunemployment, underemployment with respect to this reference period.Question 95 sought to find out whether the respondent took any steps to look for a job during the pasttwo months (relative to <strong>Census</strong> Date). Question 96 sought the reason for not looking for work if theresponse for Question 95 was, “No/Did Nothing”. The respondent would then make the appropriateselection from the categories provided.Question 97 sought to find out whether the respondent did any other kind of work at all last week(relative to <strong>Census</strong> Date) for any length of time; including helping in a family business/farm, streetvending or work at home, and if so—Question 98, how many hours worked during this reference periodQuestion 99 sought to find out what sort of work the respondent did/performed/carried out in his/hermain occupation. The enumerator was advised to list the details of the work described/reported in orderto enable/facilitate optimal coding according to the (International Standard Classification ofOccupations) ISCO at the 4-digit level, in the boxes provided. Tabulations herein reflect the MajorGroup levels which are:1—Legislators, Senior Officials and Managers2—Professionals3—Technicians and Associate Professionals4—Clerks5—Service workers and Shop Sales Workers6—Agricultural, Forestry and Fishery workers7—Craft and Related Workers8—Plant and Machine Operators and Assemblers9—Elementary Occupations0—Defence Force<strong>Antigua</strong> and <strong>Barbuda</strong> <strong>Summary</strong>15National Statistics Office: <strong>Census</strong> <strong>2001</strong>
Question 100 sought to find out what type of business is/was carried on at respondent’s workplace. Theenumerator was advised to list the details of the type of business described/reported in order toenable/facilitate optimal coding according to the (International Standard Industrial Classification) ISIC atthe 4-digit level, in the boxes provided. Tabulations herein reflect the Industrial Categories which are:A—Agriculture, Hunting and ForestryB—FishingC—Mining and QuarryingD—ManufacturingE—Electricity, Gas, and Water SupplyF—ConstructionG—Wholesale and Retail Trade…H—Hotels and RestaurantsI—Transport, Storage, and CommunicationJ—Financial IntermediationK—Real Estate, Renting, and Business ActivitiesL—Public Administration and Defence..M—EducationN—Health and Social WorkO—Other Community, Social and Personal Service ActivitiesP—Private Households with Employed PersonsQ—Extra-Territorial Organizations and BodiesQuestion 101 sought to find out the name and address of the respondents present workplace. Theenumerators were instructed to record the details accordingly in the space provided, thus facilitatingappropriate coding. Each workplace was identified according to the Enumeration district (ED) in which itfell based on a master list of buildings and business places drawn up by the <strong>Census</strong> Office from theVisitation Records, previously completed by enumerators. These EDs were grouped into MajorDivisions within Parishes identifying each village in the “rural” areas and the main locations within thecity; each workplace was coded according to its appropriate Major Division/Community- Parish— acomposite four digit code where the first two digits represent the Major Division/Community and the lasttwo digits represent the Parish.Question 102 sought to find out means of travel to workplace, and Question 103 sought the time (inminutes) taken to arrive at the workplace.(N.B. that Questions 102 – 108 were asked only of persons who gave a name and address of presentworkplace; persons who reported “No present workplace” were asked Question 109 and following).Question 104 sought to find out whether the respondent carried on his/her business, worked for a wageor salary or as an unpaid worker in a family business. The categories were:(1) Paid Employee-[Government]—persons working for Government and receiving payment inthe form of wages or salaries.(2) Paid Employee-[Private]—persons working for private organizations and receivingpayments in the form of wages, salaries, commissions, tips, piece rates, or in kind.(3) Paid Employee-[Statutory Body]—persons working for a Statutory Body and receivingpayments in the form of wages or salaries.<strong>Antigua</strong> and <strong>Barbuda</strong> <strong>Summary</strong>16National Statistics Office: <strong>Census</strong> <strong>2001</strong>
(4) Unpaid Worker—persons working in a business, (e.g. a Farm), which is run for profit, butwho receives no remuneration/payment in cash. Such persons may be a family members,apprentices/ trainees who actually contribute to the production of Goods and Services.(5) Own Business-[with paid Help]—persons who operate their own businesses orenterprises with hired employees receiving wages or salaries.(6) Own Business-[without paid Help]—persons who operate their own businesses orenterprises without paid employees.(7) Apprentice—trainee receiving wage or salary during period of apprenticeship/probation.(8) Don’t Know/Not StatedQuestion 105 was asked of respondents for whom category 5—Own Business-[with paid Help] wasselected and sought to find out the quantum/number of paid Help/employees.Question 106 dealt with Movement of Goods. This question sought to find out whether the respondentmoved all his/her Goods (e.g. fruits, nuts, lottery tickets, clothing/shoes, etc...) every night. This is anindirect way of identifying Informal Traders. Informal Traders have no fixed business addresses whereGoods may be safely stored overnight; their stock is usually relatively small and portable.Question 107 dealt with Last Pay/Income Period. This sought to identify the income/pay period from alist/categories given below:1 Weekly 5 Annually2 Fortnightly 6 Other (please specify)3 Monthly 7 None4 Quarterly 8 Not StatedThis was a lead-in question to facilitate the following question, Question 108, on Income.Question 108 sought to find out the respondent’s gross pay/income (i.e. before Income Tax, SocialSecurity, Medical Benefits or other deductions are made) during the last pay period. For Self-employedpersons enumerators were instructed to obtain the “net income”, i.e., Receipts less Business Expenses.At this juncture respondents were asked to identify their income level categories by reference to anIncome Flash Card shown to them. The enumerators would then code the appropriate income group inthe boxes provided (on the questionnaire).ANTIGUA AND BARBUDA POPULATION & HOUSING CENSUS <strong>2001</strong> INCOME FLASH CARDLast Pay/Income PeriodIncome/Level Weekly ($) Fortnightly($) Monthly($) Quarterly($) Annually($)1
Question 109 sought to find out the respondents sources of livelihood. This question required one ormultiple selections.Question 110 dealt with Remittances from Abroad and hence sought to find out how much money therespondent received last year (2000), from family and/or friends abroad. The Income Flash Card wasthen shown to the respondent for income level/category selection. The enumerators would then codethe appropriate income group in the boxes provided (on the questionnaire).Question 111 sought to find out on an average, how many hours did the respondent spend per week onhousework (includes cleaning the house, laundering, care of children, care of the elderly, etc….). Theenumerators would then code the number of hours spent in the boxes provided (on the questionnaire).SECTION 13—WHERE SPENT CENSUS NIGHTWhere spent census night—owing to the fact that members of the household were initiallyenumerated prior to census night, this question aimed at checking the members of the householdactually present on census night.Persons who were no longer members of the household owing to death, permanent migration,institutionalization, or ceased to belong to the household for other reasons, were deleted from thequestionnaire by drawing a line across the appropriate pages. Additions to the household, such as dueto births, temporary visitors and new members of the household (e.g. from marriage, or returningresidents) were enumerated at this time and added to the questionnaire.The categories for question 112—Where did…spend census night? Were:1—At this address (end interview)2—Elsewhere in this country (Go to Q. 113)3—Abroad (end interview)Question 113—the last question on the questionnaire, was asked if the answer to question 112 was“Elsewhere in this country”, and asked,”What part of the country was that? If known, pleasespecify. The interviewer/enumerator was instructed to write as full an address as possible.<strong>Antigua</strong> and <strong>Barbuda</strong> <strong>Summary</strong>18National Statistics Office: <strong>Census</strong> <strong>2001</strong>
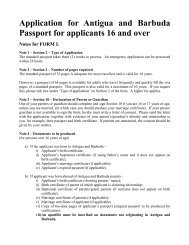
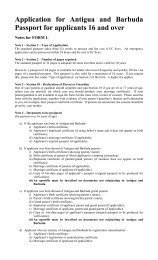
<strong>Antigua</strong> and <strong>Barbuda</strong>: 1991Population by Age and SexMaleFemale<strong>Summary</strong> Social, Economic, Demographic, and Housing CharacteristicsNational Statistics Office, <strong>Census</strong> <strong>2001</strong>19
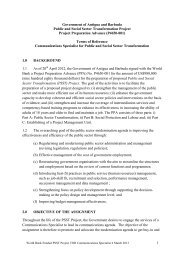
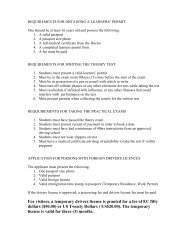
<strong>Antigua</strong> and <strong>Barbuda</strong>: <strong>2001</strong>Population by Age and SexMaleFemale<strong>Summary</strong> Social, Economic, Demographic, and Housing CharacteristicsNational Statistics Office, <strong>Census</strong> <strong>2001</strong>20
TABLE 1. POPULATION IN INSTITUTIONS, BY AGE GROUP, SEX AND TYPE OF INSTITUTIONAGE GROUPRestricted Institutions 1 Open Institutions 2 Hotels & Guest Houses 3 TotalMale Female Total Male Female Total Male Female Total Male Female TotalUnder 15 24 14 38 1 15 16 4 4 8 29 33 6215 -19 25 4 29 42 4 46 0 5 5 67 13 8020 -24 19 14 33 123 33 156 0 11 11 142 58 20025 - 29 27 5 32 62 19 81 4 21 25 93 45 13830 - 34 16 7 23 28 9 37 12 32 44 56 48 10435 - 39 18 10 28 13 8 21 9 7 16 40 25 6540 - 44 33 6 39 12 3 15 4 9 13 49 18 6745 - 49 11 6 17 8 1 9 9 0 9 28 7 3550 - 54 12 7 19 8 0 8 9 4 13 29 11 4055 - 59 9 10 19 13 0 13 4 0 4 26 10 3660 - 64 3 1 4 3 0 3 0 2 2 6 3 965 - 69 16 9 25 1 0 1 4 0 4 21 9 3070 - 74 17 5 22 0 0 0 0 4 4 17 9 2675 and Over 29 35 64 0 0 0 0 0 0 29 35 64Not Stated 60 42 102 0 0 0 0 0 0 60 42 102TOTAL 319 175 494 314 92 406 59 99 158 692 366 10581 Prison, hospital, mental hospital, retirement homes etc- excluded from the tables that follow.2 Barracks, hostels, etc- included in the tables that follow.3 Long-term (hotels/ guest houses) included in the tables that follow.<strong>Summary</strong> Social, Economic, Demographic, and Housing CharacteristicsNational Statistics Office, <strong>Census</strong> <strong>2001</strong>21
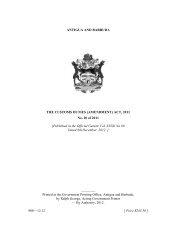
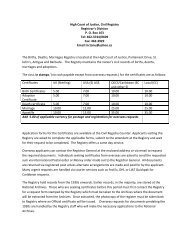
Table 2. POPULATION BY SEX AND PARISHPARISH Total Male Female76,886 36,109 40,777ST. JOHN'S CITY 24,451 11,400 13,051ST. JOHN'S RURAL 20,895 9,754 11,141ST. GEORGE'S 6673 3,166 3,507ST. PETER'S 5,439 2,595 2,844ST. PHILLIP'S 3,462 1,643 1,819ST. PAUL'S 7,848 3,652 4,196ST. MARY'S 6,793 3,212 3,581BARBUDA 1,325 687 63825,000Chart 1: Population by Parish20,000Population15,00010,000TotalMaleFemale5,0000ST. JOHN'S CITYST. JOHN'S RURALST. GEORGE'SST. PETER'SST. PHILLIP'SST. PAUL'SParishST. MARY'SBARBUDA<strong>Summary</strong> Social, Economic, Demographic, and Housing CharacteristicsNational Statistics Office, <strong>Census</strong> <strong>2001</strong>22
Table 3.Population Density by ParishParish Land Area (sq. ml) Population DensitySt. John's City 2.90 24,451 8431St. John's Rural 25.60 20,895 816St. John's Total 28.50 45,346 1591St. George 9.25 6,673 721St. Peter 12.75 5,439 427St. Phillip 17.00 3,462 203St. Paul 18.50 7,848 424St. Mary 22.80 6,793 298Total <strong>Antigua</strong> 108.00 75561 700<strong>Barbuda</strong> 62.00 1,325 21<strong>Summary</strong> Social, Economic, Demographic, and Housing CharacteristicsNational Statistics Office, <strong>Census</strong> <strong>2001</strong>23
Table 4. POPULATION BY 5 - YR AGE GROUP AND SEXAge Group Total Male Female76,886 36,109 40,77700 to 04 7,239 3,703 3,53605 to 09 7,382 3,682 3,70010 to 14 7,084 3,432 3,65215 to 19 6,317 2,996 3,32120 to 24 6,055 2,893 3,16225 to 29 6,393 2,941 3,45230 to 34 6,983 3,108 3,87535 to 39 6,686 3,022 3,66440 to 44 5,551 2,505 3,04645 to 49 4,325 2,019 2,30650 to 54 3,265 1,540 1,72555 to 59 2,388 1,078 1,31060 to 64 1,881 860 1,02165 to 69 1,577 721 85670 to 74 1,338 587 75175 to 79 1,021 471 55080 to 84 726 308 41885 to 89 406 148 25890 to 94 183 60 123OVER 94 YEARS 30 8 22NOT STATED 56 27 29<strong>Summary</strong> Social, Economic, Demographic, and Housing CharacteristicsNational Statistics Office, <strong>Census</strong> <strong>2001</strong>24
Table 5. POPULATION BY SINGLE YEARS OF AGE AND SEXAGE Total Male Female AGE Total Male Female AGE Total Male Female0 1,427 710 716 35 1,457 647 810 70 296 124 1721 1,425 737 689 36 1,522 722 799 71 303 130 1732 1,452 752 699 37 1,291 596 695 72 271 120 1503 1,469 775 693 38 1,277 539 738 73 278 124 1544 1,470 731 739 39 1,134 513 621 74 190 89 1015 1,580 793 786 40 1,200 530 671 75 249 128 1226 1,549 783 767 41 1,158 495 663 76 200 89 1117 1,399 673 726 42 1,204 556 648 77 197 83 1148 1,490 744 746 43 1,049 500 549 78 187 84 1029 1,363 687 675 44 938 424 514 79 188 87 10110 1,522 721 801 45 939 438 501 80 171 72 9911 1,423 709 714 46 882 409 473 81 167 70 9812 1,326 648 678 47 825 372 453 82 136 59 7713 1,366 660 707 48 714 307 407 83 141 57 8414 1,448 695 754 49 963 492 471 84 112 51 6115 1,269 596 673 50 815 378 437 85 83 24 5916 1,345 640 704 51 705 347 359 86 105 43 6117 1,246 619 627 52 556 254 302 87 85 31 5418 1,288 601 687 53 610 277 333 88 73 28 4619 1,174 542 632 54 578 284 294 89 59 22 3720 1,234 625 609 55 625 265 360 90 57 23 3421 1,210 590 620 56 482 219 262 91 47 12 3522 1,214 573 640 57 450 225 225 92 28 13 1423 1,099 508 591 58 441 199 242 93 18 5 1324 1,300 598 702 59 391 171 220 94 34 7 2625 1,261 577 684 60 430 188 242 95 6 1 526 1,289 580 709 61 368 167 201 96 8 2 627 1,200 575 625 62 388 171 217 97 10 2 728 1,202 562 639 63 324 161 163 98 6 2 429 1,441 647 795 64 372 175 197 N/STATED 57 28 2930 1,445 655 790 65 362 165 197 Total 76,886 36,109 40,77731 1,448 634 814 66 360 158 20232 1,324 566 758 67 307 147 16033 1,409 639 769 68 312 150 16134 1,351 609 742 69 237 102 135<strong>Summary</strong> Social, Economic, Demographic, and Housing CharacteristicsNational Statistics Office, <strong>Census</strong> <strong>2001</strong>25
TABLE 6. POPULATION BY AGE GROUP AND PARISHTOTALST. JOHN'SCITYST. JOHN'SRURALST.GEORGE'SST.PETER'SST.PHILLIP'SST. PAUL'S ST. MARY'S BARBUDAAge Group 76,886 24,451 20,895 6,673 5,439 3,462 7,848 6,793 1,32500 to 04 7,239 2,337 1,986 623 528 285 704 634 14205 to 09 7,382 2,322 1,962 640 555 323 790 666 12410 to 14 7,084 2,168 1,968 596 570 296 744 613 12915 to 19 6,317 2,030 1,631 516 501 290 619 596 13420 to 24 6,055 2,007 1,601 465 433 306 605 523 11525 to 29 6,393 2,076 1,779 523 422 272 655 551 11530 to 34 6,983 2,285 1,971 636 466 275 690 569 9135 to 39 6,686 2,268 1,853 613 476 234 609 546 8740 to 44 5,551 1,733 1,544 535 393 244 510 507 8545 to 49 4,325 1,277 1,164 408 269 207 561 370 6950 to 54 3,265 946 994 292 207 173 348 250 5555 to 59 2,388 683 708 230 153 120 231 220 4360 to 64 1,881 590 500 157 111 110 207 169 3765 to 69 1,577 470 406 140 105 108 157 156 3570 to 74 1,338 424 325 123 81 66 134 162 2375 to 79 1,021 354 238 81 70 43 110 109 1680 to 84 726 256 136 53 54 53 77 81 1685 to 89 406 135 78 24 22 40 46 56 590 to 94 183 68 39 11 21 11 21 11 1OVER 94YEARS 30 15 6 2 1 2 2 2 0NOTSTATED 56 7 6 5 1 4 28 2 3<strong>Summary</strong> Social, Economic, Demographic, and Housing CharacteristicsNational Statistics Office, <strong>Census</strong> <strong>2001</strong>26
TOTALST. JOHN'SCITYTABLE 7. POPULATION BY AGE GROUP, SEX AND PARISHST. JOHN'SRURAL ST. GEORGE'S ST. PETER'S ST. PHILLIP'S ST. PAUL'S ST. MARY'S BARBUDABoth Sexes 76,886 24,451 20,895 6,673 5,439 3,462 7,848 6,793 1,32500 to 04 7,239 2,337 1,986 623 528 285 704 634 14205 to 09 7,382 2,322 1,962 640 555 323 790 666 12410 to 14 7,084 2,168 1,968 596 570 296 744 613 12915 to 19 6,317 2,030 1,631 516 501 290 619 596 13420 to 24 6,055 2,007 1,601 465 433 306 605 523 11525 to 29 6,393 2,076 1,779 523 422 272 655 551 11530 to 34 6,983 2,285 1,971 636 466 275 690 569 9135 to 39 6,686 2,268 1,853 613 476 234 609 546 8740 to 44 5,551 1,733 1,544 535 393 244 510 507 8545 to 49 4,325 1,277 1,164 408 269 207 561 370 6950 to 54 3,265 946 994 292 207 173 348 250 5555 to 59 2,388 683 708 230 153 120 231 220 4360 to 64 1,881 590 500 157 111 110 207 169 3765 to 69 1,577 470 406 140 105 108 157 156 3570 to 74 1,338 424 325 123 81 66 134 162 2375 to 79 1,021 354 238 81 70 43 110 109 1680 to 84 726 256 136 53 54 53 77 81 1685 to 89 406 135 78 24 22 40 46 56 590 to 94 183 68 39 11 21 11 21 11 1OVER 94 YEARS 30 15 6 2 1 2 2 2 0NOT STATED 56 7 6 5 1 4 28 2 3Male 36,109 11,400 9,754 3,166 2,595 1,643 3,652 3,212 68700 to 04 3,703 1,202 970 323 278 151 367 329 8305 to 09 3,682 1,113 986 331 295 179 393 326 5910 to 14 3,432 1,064 991 280 289 134 327 283 6415 to 19 2,996 960 769 239 240 127 315 279 6720 to 24 2,893 953 735 222 216 150 289 265 6325 to 29 2,941 957 815 232 182 149 288 259 5930 to 34 3,108 1,012 846 278 220 117 317 275 4335 to 39 3,022 1,023 851 278 217 117 255 243 3840 to 44 2,505 804 668 250 170 114 221 234 4445 to 49 2,019 611 528 213 124 91 256 157 3950 to 54 1,540 455 440 144 91 74 174 134 2855 to 59 1,078 279 337 106 76 50 105 103 2260 to 64 860 244 229 74 58 57 95 79 2465 to 69 721 216 209 58 43 37 75 63 2070 to 74 587 168 160 63 28 30 59 65 1475 to 79 471 152 118 34 29 21 58 53 680 to 84 308 120 57 28 18 24 21 33 785 to 89 148 42 22 7 11 18 17 28 390 to 94 60 19 16 4 10 2 6 2 1OVER 94 YEARS 8 4 2 0 0 1 0 1 0NOT STATED 27 2 5 2 0 0 14 1 3Female 40,777 13,051 11,141 3,507 2,844 1,819 4,196 3,581 63800 to 04 3,536 1,135 1,016 300 250 134 337 305 5905 to 09 3,700 1,209 976 309 260 144 397 340 6510 to 14 3,652 1,104 977 316 281 162 417 330 6515 to 19 3,321 1,070 862 277 261 163 304 317 6720 to 24 3,162 1,054 866 243 217 156 316 258 5225 to 29 3,452 1,119 964 291 240 123 367 292 5630 to 34 3,875 1,273 1,125 358 246 158 373 294 4835 to 39 3,664 1,245 1,002 335 259 117 354 303 4940 to 44 3,046 929 876 285 223 130 289 273 4145 to 49 2,306 666 636 195 145 116 305 213 3050 to 54 1,725 491 554 148 116 99 174 116 2755 to 59 1,310 404 371 124 77 70 126 117 2160 to 64 1,021 346 271 83 53 53 112 90 1365 to 69 856 254 197 82 62 71 82 93 1570 to 74 751 256 165 60 53 36 75 97 975 to 79 550 202 120 47 41 22 52 56 1080 to 84 418 136 79 25 36 29 56 48 985 to 89 258 93 56 17 11 22 29 28 290 to 94 123 49 23 7 11 9 15 9 0OVER 94 YEARS 22 11 4 2 1 1 2 1 0NOT STATED 29 5 1 3 1 4 14 1 0<strong>Summary</strong> Social, Economic, Demographic, and Housing CharacteristicsNational Statistics Office, <strong>Census</strong> <strong>2001</strong>27
TABLE 8.POPULATION BY ENUMERATION DISTRICT AND SEXE.D. NAME TOTAL MALE FEMALE1 ST. JOHN'S CITY 24,451 11,400 13,05110100 Buckley’s St. (Harbour) 243 105 13810200 Buckley’s St. (Central) 209 108 10110300 Buckley’s St. (South) 296 159 13710400 Federation Rd. (North) 379 176 20310500 Cooks Hill Rd 320 169 15110600 Federation Rd. (South) 261 123 13810700 Grays Hill 375 193 18110800 Green Bay Ext 233 111 12210900 George St. (South) 239 105 13411000 Central St. (North) 138 81 5711100 Green Bay School 274 133 14111200 Green Bay Canal 118 62 5711300 Warnford Rd. 179 81 9811400 Lower Grey Hill 246 123 12311500 Matthew St. 424 207 21711600 White Road 302 162 14011700 Grays Farm Rd. 279 132 14711800 Kentish (North) 221 88 13311900 Station Rd. (North) 245 116 12912000 Grays Crescent 303 147 15612100 Kentish Road 256 126 13012200 Tindale Rd. (North) 295 134 16112300 Tindale Rd. (Central) 332 144 18812400 Tindale Rd. (South) 245 116 12912500 Grey Hill Reservoir 338 169 16912600 Grey Hill East 278 127 15112700 Nut Grove 267 124 14312800 CMC 199 88 11112900 Malone St. 278 120 15813000 Warren Road 243 94 14913100 Baxter Street 192 88 10413200 Craven Road 309 141 16813300 Golden Grove School 219 93 12613400 Golden Grove 355 161 19513500 Edward St. 269 112 15713600 Stetson Avenue 301 138 16313700 Desouza Road (Central) 298 140 15813800 Paige Road (West) 344 173 17213900 Fiennes St. 292 137 15614000 Ottos School 259 121 13814100 Ottos (West) 220 93 12714200 Martins Road (East) 103 54 4814300 Whenner Road (North) 216 101 11514400 Browne's Ave. 238 105 13314500 Brams Hamlet Rd (West) 324 151 17314600 A.B.S. (Old) 288 158 12914700 Radio Range 226 110 11614800 Holberton 263 118 14514900 Nelson St. (East) 216 105 11115000 Nelson St. (West) 226 92 13415100 New St. (West) 155 74 8115200 Tanner St. 150 70 8015300 Down Town 76 33 4315400 Country Pond 141 66 7515500 Sutherlands (West) 278 106 17215600 Sutherlands (Central) 283 120 16315700 St. Johnson’s Vill. Rd 323 169 15315800 St. Johnson’s (East) 289 133 15615900 Skerrett’s Pa. (South) 172 70 101<strong>Summary</strong> Social, Economic, Demographic, and Housing CharacteristicsNational Statistics Office, <strong>Census</strong> <strong>2001</strong>28
TABLE 8. CONTINUEDE.D. NAME TOTAL MALE FEMALE16000 Skerrett’s Pa. (North) 311 145 16616100 Simon Bolivar Park 446 213 23316200 Sutherlands (North) 308 124 18416300 Christ The King 285 133 15216400 Clare Hall (West) 262 103 15916500 Upper Gambles 400 193 20716600 Cortsland 216 105 11116700 Deanery 164 65 9916800 <strong>Census</strong> Off. (North St.) 253 122 13016900 Lower North St. 227 103 12417000 Point Waterfront (East) 88 39 5017100 Point Wharf 302 147 15517200 Wilkenson Cross (West) 227 121 10617300 Wapping Lane (South) 201 92 10917400 Wappping Lane (Central) 197 92 10517500 Pelle St. (East) 219 115 10417600 Dickenson Bay St. (West) 214 91 12317700 Villa School 217 104 11417800 Bennett St. (West) 295 129 16617900 Pigott St. 268 138 13018000 Athill St. (East) 230 104 12618100 P.M. School 187 87 10018200 Gambles 295 129 16618300 Cemetery 284 115 16918400 Upper Fort Rd (East) 153 72 8118500 Friars Hill (West) 265 122 14318600 Upper Fort Rd (North) 359 174 18518700 Upper Fort Rd (Central) 408 198 21018800 Cotton Lane 290 139 15118900 Fort Rd. (West) 187 86 10119000 Villa (East) 265 112 15219100 Villa (Central) 211 93 11819200 Bay Street 295 137 15819300 Blackburn Park 343 162 18119400 Fort James 220 101 11819500 Barrymore 317 134 1823 ST.JOHN'S RURAL 20,895 9,754 11,14130100 Hodges Bay-Benaire 352 167 18530200 Hodges Bay-Royals 266 129 13730300 Cedar Grove-East 269 111 15830400 Cedar Grove-St. James 243 104 13930500 Cedar Grove-South 396 198 19830600 Blue Waters 290 105 18530700 Crosbies-Sandpiper 205 106 9930800 Crosbies-Mill Tower 269 129 14030900 Crosbies-W.I.O.C. 332 173 15931000 Marble Hill 170 87 8331100 Trade Winds 147 76 7131200 Paradise View 196 97 9931300 McKinnon’s 393 203 19031401 McKinnon’s-S.P._1 333 157 17631402 McKinnon’s-S.P._2 292 138 15531500 Adelin 337 161 17631600 Prison Farm 529 228 30131701 Cedar Valley-Longford 226 97 12931702 Cedar Valley 164 83 8131800 Piggott's Ville-Woods 100 35 6531900 Upper Clare Hall 457 179 278<strong>Summary</strong> Social, Economic, Demographic, and Housing CharacteristicsNational Statistics Office, <strong>Census</strong> <strong>2001</strong>29
TABLE 8. CONTINUEDE.D. NAME TOTAL MALE FEMALE32000 Clare Hall-Central 285 135 15032100 Clare Hall-Christian Union 289 139 15032200 Clare Hall School 228 85 14432301 Skyline_1 311 145 16632302 Skyline_2 256 103 15332400 Skerritts-East 342 158 18432500 Obeez 158 83 7532600 Scotts Hill 220 99 12132700 Upper Potters 344 147 19732800 Potters-North 321 147 17432900 Potters-Central 313 143 17033000 Potters-East 280 121 15933100 Potters-South 261 139 12233200 Potters-Cemetery 389 198 19133301 Tomlinsons_1 304 145 15933302 Tomlinsons_2 378 178 20133401 Belmont_1 234 109 12633402 Belmont_2 275 133 14333501 St. Claire_1 159 74 8633502 St. Claire_2 306 123 18233600 Buckleys-West 237 117 12033701 Buckleys-East_1 243 111 13233702 Buckleys-East_2 175 80 9533800 Clarkes Hill 343 164 17933901 AllSaints-N_1 255 121 13433902 AllSaints-N_2 359 161 19834000 AllSaints-PoliceStation 266 127 13934100 Bendals 144 79 6534201 Emmanuel_1 335 153 18134202 Emmanuel_2 174 86 8834300 Green Castle-Agriculture 236 104 13234400 Bendals Quar-Sch 335 164 17034501 Bendals Rd-Bathlodge 201 95 10534502 Bendals Rd-BendalsRd 356 168 18834600 Bellevue Heights 330 159 17034700 Moravian ConfHall 348 166 18234800 Branns Hamlet-North 257 127 13034900 Branns Hamlet-South 430 201 23035001 State College_1 244 117 12735002 State College_2 219 98 12135100 Golden Grove-South 315 146 16935200 Creekside 389 191 19835301 Montclear_1 552 261 29135302 Montclear_2 441 207 23435400 Grays Hill 273 129 14435500 Jacks Hill 260 111 14935600 Union Road 286 132 15535700 Union Road-East 188 88 10035800 Union Road-North 320 163 15735900 Hatton Hill 246 124 12236000 Five Islands 395 176 21936100 Yepton’s 114 54 594 ST.GEORGES 6,673 3,166 3,50740100 NewWinthorpes-North 210 104 10640200 NewWinthorpes-South 400 180 22040300 NewWinthorpes-East 272 121 15140400 BarnesHill-School 431 207 22540500 BarnesHill-East 367 168 19940600 Piggotts-School 219 91 12840700 Pigotts Hill 404 172 232<strong>Summary</strong> Social, Economic, Demographic, and Housing CharacteristicsNational Statistics Office, <strong>Census</strong> <strong>2001</strong>30
TABLE 8. CONTINUEDE.D. NAME TOTAL MALE FEMALE70400 Swetes-North 320 150 17070500 Swetes-Central 358 179 17970600 Swetes-SouthWest 302 133 16970700 Swetes-East 406 195 21170800 Liberta 325 145 18070901 Liberta-West_1 416 195 22170902 Liberta-West_2 352 161 19171000 Liberta-North Central 423 193 23071100 Liberta-South Central 266 117 14971200 Liberta-SouthWest 298 146 15271300 GreenHill 295 135 15971400 Bethesda-East 387 191 19671500 Bethesda-West 101 45 5771600 Falmouth 326 161 16671700 CobbsCross 296 132 16471800 EnglishHarb-Town 203 88 11571900 EnglishHarb-OrdnanceBay 185 83 10172000 EnglishHarb-MiddleGround 112 54 5872100 MarshVillage 278 123 15572200 DowHill 128 65 6372300 CooksHill \Christian Hill 243 130 11272400 TableHillGardens 216 109 10872500 Tyrells 361 155 20772600 Pattersons 185 74 11172700 DieppeBay 72 41 318 ST. MARY'S 6,793 3,212 3,58180100 Bolans-JollyBeach 296 158 13880200 Bolans-Tottenham 143 66 7680300 BolansHill 255 127 12880401 Bolans-JollyH_1 243 115 12880402 Bolans-JollyH_2 308 130 17880500 Bolans-CentralWest 224 106 11780600 Bolans-CentralEast 104 45 5980700 BolansClinic 315 143 17380800 OldRoad-North 214 92 12280900 OldRoad-ClareMont 158 72 8681000 OldRoad-Central 157 72 8581100 OldRoad-MorrisBay 195 93 10181201 OldRoad-West_1 228 101 12781202 OldRoad-West_2 141 69 7281300 Urlings-StMarysChurch 199 89 11081400 Urlings-Central 236 117 11881500 Urlings-West 210 111 9981600 UrlingsSchool 268 117 15181700 JohnsonsPoint 155 76 7981800 CrabbHill 174 76 9881900 Jennings-Central 376 175 20182000 Jennings-South 303 155 14982101 Jennings-Yorks_1 145 70 7582102 Jennings-Yorks_2 262 129 13382200 Jennings-CedarHall 324 158 16682300 EbenezerHall 222 108 11582400 Ebenezer-GreenHill 304 144 16182500 JohnHughes-B_Neck 233 111 12282600 JohnHughes-Bishops 190 85 10582700 BoggyPeak 178 85 93<strong>Summary</strong> Social, Economic, Demographic, and Housing CharacteristicsNational Statistics Office, <strong>Census</strong> <strong>2001</strong>32
TABLE 8. CONTINUEDE.D. NAME TOTAL MALE FEMALE9 BARBUDA 1,325 687 63890100 Codrington-North 442 235 20790200 Codrington-Central 239 138 10190300 Codrington-South 233 112 12190400 <strong>Barbuda</strong>-North 248 132 11690500 <strong>Barbuda</strong>-South 163 70 93<strong>Summary</strong> Social, Economic, Demographic, and Housing CharacteristicsNational Statistics Office, <strong>Census</strong> <strong>2001</strong>33
Table 9. POPULATION BY BROAD AGE GROUPSAGE-GROUP Total Percent00 to 04 7,239 9.405 to 14 14,466 18.815 to 44 37,985 49.445 to 64 11,859 15.4OVER-64 5,281 6.9NOT-STATED 56 0.1TOTAL 76,886 100<strong>Summary</strong> Social, Economic, Demographic, and Housing CharacteristicsNational Statistics Office, <strong>Census</strong> <strong>2001</strong>34
Table 10. POPULATION BY BROAD AGE GROUP AND SEXAGE-GROUP Total Male Female00 to 04 7,239 3,703 3,53605 to 14 14,466 7,113 7,35315 to 44 37,985 17,458 20,52745 to 64 11,859 5,500 6,359OVER-64 5,281 2,306 2,975NOT-STATED 56 28 29Total 76,886 36,109 40,777<strong>Summary</strong> Social, Economic, Demographic, and Housing CharacteristicsNational Statistics Office, <strong>Census</strong> <strong>2001</strong>35
Table 11. Population by Age Group, Sex and Relationship to head of HouseholdSEX / RELATIONSHIPTotal00 to0405 to0910 to1415 to1920 to2425 to2930 to3435 to3940 to4445 to49Both Sexes 76,886 7,239 7,382 7,084 6,317 6,055 6,393 6,983 6,686 5,551 4,325Head 24,538 0 0 0 111 831 1,946 3,139 3,558 3,323 2,708Spouse/partner 9,802 0 0 1 84 476 1,123 1,664 1,752 1,374 987Child 27,191 4,771 5,154 5,162 4,404 3,027 2,001 1,249 716 346 186Son/daughter-in-law 590 57 78 84 81 84 87 46 36 18 13Grandchild 5,247 1,748 1,401 947 600 341 124 55 17 7 5Parent/parent-in-law 838 0 0 0 1 0 0 16 16 26 34Other relative 6,236 480 548 665 777 885 772 554 413 341 303Non-relative 2,444 183 201 225 259 417 342 260 178 116 89Male 36,109 3,702 3,681 3,431 2,994 2,892 2,942 3,110 3,022 2,506 2,021Head 13,872 0 0 0 56 433 1,106 1,764 2,101 1,930 1,557Spouse/partner 1,378 0 0 0 5 37 165 216 260 177 160Child 13,490 2,459 2,585 2,519 2,119 1,556 982 633 327 149 86Son/daughter-in-law 332 35 49 52 41 45 46 22 17 11 9Grandchild 2,644 888 693 448 298 198 72 30 9 2 5Parent/parent-in-law 188 0 0 0 0 0 0 11 6 9 6Other relative 3,031 226 259 309 360 444 410 288 206 170 150Non-relative 1,174 94 95 103 115 185 163 146 96 58 48Female 40,777 3,537 3,701 3,653 3,323 3,163 3,451 3,873 3,664 3,045 2,304Head 10,666 0 0 0 55 398 840 1,375 1,457 1,393 1,151Spouse/partner 8,424 0 0 1 79 439 958 1,448 1,492 1,197 827Child 13,701 2,312 2,569 2,643 2,285 1,471 1,019 616 389 197 100Son/daughter-in-law 258 22 29 32 40 39 41 24 19 7 4Grandchild 2,603 860 708 499 302 143 52 25 8 5 0Parent/parent-in-law 650 0 0 0 1 0 0 5 10 17 28Other relative 3,205 254 289 356 417 441 362 266 207 171 153Non-relative 1,270 89 106 122 144 232 179 114 82 58 41<strong>Summary</strong> Social, Economic, Demographic, and Housing CharacteristicsNational Statistics Office, <strong>Census</strong> <strong>2001</strong>36
Table 11. ContinuedSEX /RELATIONSHIP50 to5455 to5960 to6465 to6970 to7475 to7980 to8485 to8990 to94OVER94YEARSNOTSTATEDBoth Sexes 3,265 2,388 1,881 1,577 1,338 1,021 726 406 183 30 56Head 2,218 1,642 1,300 1,146 970 738 518 261 104 11 13Spouse/partner 714 515 395 282 222 116 66 24 6 2 0Child 101 48 23 6 2 1 1 0 0 0 0Son/daughter-in-law 4 1 0 1 0 0 0 0 0 0 0Grandchild 1 0 0 0 0 0 0 0 0 0 0Parent/parent-in-law 64 73 93 77 87 114 88 82 49 11 7Other relative 99 81 48 49 49 36 43 31 20 5 36Non-relative 64 28 22 16 10 14 12 6 2 1 0Male 1,540 1,078 861 721 587 471 307 148 60 8 27Head 1,295 895 748 643 521 400 268 111 39 1 3Spouse/partner 102 83 59 40 34 20 9 10 1 1 0Child 47 22 9 1 2 0 1 0 0 0 0Son/daughter-in-law 4 1 0 0 0 0 0 0 0 0 0Grandchild 0 0 0 0 0 0 0 0 0 0 0Parent/parent-in-law 15 13 14 13 15 32 18 17 15 3 1Other relative 47 52 23 19 13 8 9 8 3 3 23Non-relative 30 12 8 5 4 9 4 0 0 0 0Female 1,725 1,310 1,020 856 751 550 419 258 123 22 29Head 923 747 552 503 449 338 250 150 65 10 10Spouse/partner 612 432 336 242 188 96 57 14 5 1 0Child 54 26 14 5 0 1 0 0 0 0 0Son/daughter-in-law 0 0 0 1 0 0 0 0 0 0 0Grandchild 1 0 0 0 0 0 0 0 0 0 0Parent/parent-in-law 49 60 79 64 72 82 70 65 34 8 6Other relative 52 29 25 30 36 28 34 23 17 2 13Non-relative 34 16 14 11 6 5 8 6 2 1 0<strong>Summary</strong> Social, Economic, Demographic, and Housing CharacteristicsNational Statistics Office, <strong>Census</strong> <strong>2001</strong>37
Table 12. POPULATION BY ETHNIC GROUP AND SEXEthnic, Racial or National Group Total Male FemaleAfrican descent/Black 69,982 32,932 37,049Indigenous people 258 107 150East Indian 545 264 282Chinese 163 59 104Portuguese 126 71 55Syrian/Lebanese 464 272 191White/Caucasian 1,340 693 647Mixed 3,376 1,440 1,936Other 465 193 272Don't know/ not stated 169 78 90Total 76,886 36,109 40,777Chart 2. POPULATION BY ETHNIC GROUP AND SEXAfrican descent/Black69,982, 91%Indigenous people,258, 0%East Indian, 545, 1%Chinese, 163, 0%Portuguese, 126, 0%Syrian/Lebanese, 464,1%White/Caucasian,1,340, 2%Mixed, 3,376, 4%Other, 465, 1%Don't know/ not stated,169, 0%<strong>Summary</strong> Social, Economic, Demographic, and Housing CharacteristicsNational Statistics Office, <strong>Census</strong> <strong>2001</strong>38
Table 13. POPULATION BY AGE GROUP, SEX AND ETHNIC GROUPAfricanDescent/BlackIndigenousPeopleSEXAGE-5-YR TotalEastIndian ChinesePortugueseSyrian/Lebanese White Mixed OtherBoth Sexes 76,886 69,982 258 545 163 126 464 1,340 3,374 465 16900 to 04 7,239 6,505 22 54 8 5 68 78 447 34 1805 to 09 7,382 6,746 19 42 8 5 30 98 392 28 1410 to 14 7,084 6,617 17 26 5 5 14 55 309 29 715 to 19 6,317 5,939 19 31 11 5 19 24 240 25 420 to 24 6,055 5,594 12 36 39 5 36 53 243 31 625 to 29 6,393 5,772 40 65 28 7 57 83 290 41 1030 to 34 6,983 6,258 36 71 14 4 58 117 336 69 2035 to 39 6,686 5,970 29 90 11 6 53 140 309 61 1740 to 44 5,551 4,985 16 55 11 13 24 132 232 57 2645 to 49 4,325 3,896 17 33 8 16 20 137 146 40 1250 to 54 3,265 2,930 7 16 6 11 19 141 106 22 755 to 59 2,388 2,141 8 11 5 8 20 87 87 16 560 to 64 1,881 1,683 7 5 1 11 17 75 69 8 565 to 69 1,577 1,457 0 5 4 4 13 40 51 1 270 to 74 1,338 1,229 6 2 2 1 8 40 47 2 175 to 79 1,021 951 0 2 2 7 5 20 26 1 780 to 84 726 670 2 1 0 8 1 16 26 0 285 to 89 406 381 1 0 0 4 1 5 10 0 490 to 94 183 171 0 0 0 1 1 4 6 0 0OVER 94 YEARS 30 28 0 0 0 0 0 1 0 0 1NOT STATED 56 53 0 0 0 0 0 0 2 0 1Don't know/not statedMale 36,109 32,932 108 264 59 72 274 692 1,440 191 7700 to 04 3,703 3,320 10 33 5 5 35 41 229 18 705 to 09 3,682 3,370 6 20 4 2 14 54 191 17 410 to 14 3,432 3,219 11 17 5 4 7 26 122 17 415 to 19 2,996 2,829 5 14 2 4 11 12 104 13 220 to 24 2,893 2,706 4 16 1 2 17 23 114 8 225 to 29 2,941 2,700 17 16 6 4 34 49 102 11 230 to 34 3,108 2,792 17 35 8 0 41 53 125 25 1235 to 39 3,022 2,701 12 41 5 4 33 66 122 31 740 to 44 2,505 2,264 7 35 4 6 18 59 90 10 1245 to 49 2,019 1,804 5 16 7 10 16 72 65 19 550 to 54 1,540 1,369 5 7 5 8 11 75 43 12 555 to 59 1,078 948 6 4 4 6 12 49 39 6 460 to 64 860 760 1 2 0 5 10 45 34 2 165 to 69 721 663 0 4 1 0 10 23 17 1 270 to 74 587 535 2 2 1 0 4 23 19 0 175 to 79 471 436 0 1 1 5 1 12 10 1 480 to 84 308 284 0 1 0 5 0 8 10 0 085 to 89 148 145 0 0 0 1 0 0 1 0 190 to 94 60 57 0 0 0 1 0 1 1 0 0OVER 94 YEARS 8 6 0 0 0 0 0 1 0 0 1NOT STATED 27 24 0 0 0 0 0 0 2 0 1Female 40,777 37,050 150 281 104 54 190 648 1,934 274 9200 to 04 3,536 3,185 12 21 3 0 33 37 218 16 1105 to 09 3,700 3,376 13 22 4 3 16 44 201 11 1010 to 14 3,652 3,398 6 9 0 1 7 29 187 12 315 to 19 3,321 3,110 14 17 9 1 8 12 136 12 220 to 24 3,162 2,888 8 20 38 3 19 30 129 23 425 to 29 3,452 3,072 23 49 22 3 23 34 188 30 830 to 34 3,875 3,466 19 36 6 4 17 64 211 44 835 to 39 3,664 3,269 17 49 6 2 20 74 187 30 1040 to 44 3,046 2,721 9 20 7 7 6 73 142 47 1445 to 49 2,306 2,092 12 17 1 6 4 65 81 21 750 to 54 1,725 1,561 2 9 1 3 8 66 63 10 255 to 59 1,310 1,193 2 7 1 2 8 38 48 10 160 to 64 1,021 923 6 3 1 6 7 30 35 6 465 to 69 856 794 0 1 3 4 3 17 34 0 070 to 74 751 694 4 0 1 1 4 17 28 2 075 to 79 550 515 0 1 1 2 4 8 16 0 380 to 84 418 386 2 0 0 3 1 8 16 0 285 to 89 258 236 1 0 0 3 1 5 9 0 390 to 94 123 114 0 0 0 0 1 3 5 0 0OVER 94 YEARS 22 22 0 0 0 0 0 0 0 0 0NOT STATED 29 29 0 0 0 0 0 0 0 0 0<strong>Summary</strong> Social, Economic, Demographic, and Housing CharacteristicsNational Statistics Office, <strong>Census</strong> <strong>2001</strong>39
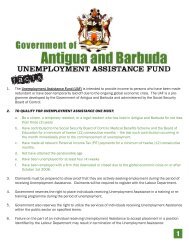
Table 14. POPULATION BY RELIGION AND SEXRELIGION Total Male FemaleTotal 76,886 36,109 40,777Anglican 19,767 9,482 10,285Baptist 3,777 1,635 2,142Bahai Faith 51 20 30Bretheren 194 100 94Church of God 3,443 1,435 2,008Evangelical 1,982 849 1,133Hinduism 189 100 89Jehovah Witness 1,257 548 709Methodist 6,091 2,822 3,269Moravian 8,057 3,792 4,264Islam [Muslim] 228 136 91Pentecostal 8,118 3,455 4,663Presbyterian 205 102 102Rastafarian 973 764 208Roman Catholic 8,021 3,647 4,374Salvation Army 444 196 248Seventh Day Adventist 9,436 4,263 5,173Spiritual Baptist 66 28 39None 3,145 1,954 1,191Not stated 1,329 724 606Other 116 57 59<strong>Summary</strong> Social, Economic, Demographic, and Housing CharacteristicsNational Statistics Office, <strong>Census</strong> <strong>2001</strong>40
Chart 3: Population by Religion and SexSpiritual Baptist0%None4%Not stated2%Other0%Seventh Day Adve12%Anglican26%Salvation Army1%Roman Catholic10%Baptist5%Rastafarian1%Presbyterian0%Pentecostal11%Islam [Muslim]0%Moravian10%Methodist8%Church of God4%Evangelical3%Hinduism0%Jehovah Witness2%Bahai Faith0%Bretheren0%<strong>Summary</strong> Social, Economic, Demographic, and Housing CharacteristicsNational Statistics Office, <strong>Census</strong> <strong>2001</strong>41
Table 15. POPULATION BY AGE GROUP, SEX AND RELIGIONTotal Anglican BaptistBahaiFaithChurchof GodBrethrenEvangelicalHinduismJehovahWitness Methodist MoravianBoth Sexes 76,886 19,773 3,777 50 192 3,443 1,980 189 1,257 6,092 8,06000 to 04 7,239 1,565 417 1 14 429 235 23 136 447 64205 to 09 7,382 1,703 480 4 18 370 220 12 141 559 71310 to 14 7,084 1,709 453 0 17 374 217 6 134 519 69015 to 19 6,317 1,534 325 4 19 354 155 12 99 514 69920 to 24 6,055 1,505 261 6 18 283 135 17 81 464 61825 to 29 6,393 1,611 311 1 17 283 161 22 85 418 57830 to 34 6,983 1,670 348 4 16 311 190 16 132 492 60035 to 39 6,686 1,569 319 0 20 335 176 28 114 492 60040 to 44 5,551 1,368 254 4 13 237 135 23 113 444 56345 to 49 4,325 1,110 172 8 12 161 89 13 65 388 47250 to 54 3,265 968 120 5 7 100 84 6 46 306 39755 to 59 2,388 826 83 4 12 60 43 2 29 222 33660 to 64 1,881 651 71 2 1 42 36 4 28 200 27065 to 69 1,577 569 47 2 2 42 37 2 12 183 27070 to 74 1,338 522 46 2 0 24 18 1 18 141 20575 to 79 1,021 380 35 2 5 18 20 1 12 124 15280 to 84 726 280 13 1 0 7 11 0 5 94 12985 to 89 406 145 13 0 1 10 10 1 4 55 7690 to 94 183 65 4 0 0 1 7 0 2 24 29OVER 94 YEARS 30 12 0 0 0 1 0 0 1 1 10NOT STATED 56 11 5 0 0 1 1 0 0 5 11Male 36,109 9,496 1,636 18 99 1,433 848 98 549 2,822 3,79200 to 04 3,703 790 219 0 12 201 104 13 67 228 34305 to 09 3,682 837 236 2 6 175 117 7 77 285 35610 to 14 3,432 857 205 0 8 182 79 2 58 246 33615 to 19 2,996 725 147 1 13 161 67 7 48 241 36420 to 24 2,893 729 110 1 11 126 66 8 34 255 30325 to 29 2,941 763 125 0 10 113 75 4 24 188 26630 to 34 3,108 802 113 1 7 119 65 10 54 213 28235 to 39 3,022 738 128 0 11 101 76 12 47 220 25440 to 44 2,505 620 118 0 7 87 60 14 58 176 24645 to 49 2,019 515 55 2 6 66 39 11 22 154 22050 to 54 1,540 473 47 4 1 31 35 5 13 148 17955 to 59 1,078 398 31 1 6 20 14 0 16 100 15260 to 64 860 315 33 1 0 17 13 2 10 93 11265 to 69 721 272 23 1 0 18 16 1 4 79 12670 to 74 587 250 22 2 0 8 7 1 5 61 9175 to 79 471 187 10 1 1 6 7 1 6 57 6680 to 84 308 125 4 1 0 0 4 0 4 47 5285 to 89 148 62 6 0 0 1 2 0 0 24 2890 to 94 60 25 2 0 0 0 1 0 2 5 10OVER 94 YEARS 8 3 0 0 0 0 0 0 0 0 4NOT STATED 27 10 2 0 0 1 1 0 0 2 2Female 40,777 10,277 2,141 32 93 2,010 1,132 91 708 3,270 4,26800 to 04 3,536 775 198 1 2 228 131 10 69 219 29905 to 09 3,700 866 244 2 12 195 103 5 64 274 35710 to 14 3,652 852 248 0 9 192 138 4 76 273 35415 to 19 3,321 809 178 3 6 193 88 5 51 273 33520 to 24 3,162 776 151 5 7 157 69 9 47 209 31525 to 29 3,452 848 186 1 7 170 86 18 61 230 31230 to 34 3,875 868 235 3 9 192 125 6 78 279 31835 to 39 3,664 831 191 0 9 234 100 16 67 272 34640 to 44 3,046 748 136 4 6 150 75 9 55 268 31745 to 49 2,306 595 117 6 6 95 50 2 43 234 25250 to 54 1,725 495 73 1 6 69 49 1 33 158 21855 to 59 1,310 428 52 3 6 40 29 2 13 122 18460 to 64 1,021 336 38 1 1 25 23 2 18 107 15865 to 69 856 297 24 1 2 24 21 1 8 104 14470 to 74 751 272 24 0 0 16 11 0 13 80 11475 to 79 550 193 25 1 4 12 13 0 6 67 8680 to 84 418 155 9 0 0 7 7 0 1 47 7785 to 89 258 83 7 0 1 9 8 1 4 31 4890 to 94 123 40 2 0 0 1 6 0 0 19 19OVER 94 YEARS 22 9 0 0 0 1 0 0 1 1 6NOT STATED 29 1 3 0 0 0 0 0 0 3 9<strong>Summary</strong> Social, Economic, Demographic, and Housing CharacteristicsNational Statistics Office, <strong>Census</strong> <strong>2001</strong>42
Table 15. CONTINUEDIslam[Muslim] PentecostalPresbyterianRastafarianRomanCatholicSalvationArmySeventhDay Adv.SpiritualBaptist None Not stated OtherBoth Sexes 227 8,117 201 973 8,020 444 9,437 66 3,146 1,330 11200 to 04 23 987 14 51 705 43 1,046 10 296 135 2005 to 09 25 963 25 51 665 61 1,023 6 199 124 2010 to 14 16 928 18 48 614 54 991 4 159 113 2015 to 19 19 734 19 43 554 46 833 7 247 90 1020 to 24 14 644 12 157 596 24 726 6 368 113 725 to 29 30 716 8 112 693 34 810 5 377 113 830 to 34 20 775 18 100 911 33 855 5 347 134 635 to 39 33 689 26 141 817 40 803 5 358 114 740 to 44 17 578 18 119 602 28 655 5 252 117 645 to 49 18 384 12 100 526 16 474 2 197 104 250 to 54 5 238 7 31 407 25 331 4 132 46 055 to 59 5 136 8 10 273 16 222 1 71 29 060 to 64 0 111 4 5 209 6 170 1 46 22 265 to 69 1 70 2 2 135 2 146 1 35 16 170 to 74 0 64 4 2 116 8 131 1 19 14 275 to 79 0 51 2 1 72 6 99 0 16 24 180 to 84 0 26 2 0 64 1 71 2 10 10 085 to 89 1 13 2 0 30 1 30 1 8 5 090 to 94 0 6 0 0 23 0 16 0 4 2 0OVER 94 YEARS 0 0 0 0 4 0 0 0 1 0 0NOT STATED 0 4 0 0 4 0 5 0 4 5 0Male 137 3,455 100 764 3,646 194 4,261 27 1,954 723 5700 to 04 16 506 8 26 350 20 550 2 166 72 1005 to 09 12 465 14 29 317 35 520 5 108 71 810 to 14 4 455 6 29 288 28 495 1 81 59 1315 to 19 12 323 11 24 243 17 385 4 152 46 520 to 24 6 265 8 129 256 11 312 4 196 57 625 to 29 19 272 2 99 325 13 331 2 248 61 130 to 34 13 296 5 88 362 13 355 1 235 70 435 to 39 22 256 12 116 370 14 354 0 226 61 440 to 44 11 216 10 101 273 18 265 1 159 61 445 to 49 12 159 7 87 253 6 201 0 140 64 050 to 54 5 85 5 26 183 8 159 4 95 34 055 to 59 4 51 7 6 135 2 73 1 47 14 060 to 64 0 36 2 1 106 6 67 0 35 11 065 to 69 1 18 2 2 66 0 61 0 25 5 170 to 74 0 18 1 1 46 2 47 0 12 12 175 to 79 0 24 0 0 26 1 45 0 16 17 080 to 84 0 6 0 0 28 0 26 2 5 4 085 to 89 0 2 0 0 10 0 8 0 4 1 090 to 94 0 0 0 0 7 0 5 0 2 1 0OVER 94 YEARS 0 0 0 0 1 0 0 0 0 0 0NOT STATED 0 2 0 0 1 0 2 0 2 2 0Female 90 4,662 101 209 4,374 250 5,176 39 1,192 607 5500 to 04 7 481 6 25 355 23 496 8 130 63 1005 to 09 13 498 11 22 348 26 503 1 91 53 1210 to 14 12 473 12 19 326 26 496 3 78 54 715 to 19 7 411 8 19 311 29 448 3 95 44 520 to 24 8 379 4 28 340 13 414 2 172 56 125 to 29 11 444 6 13 368 21 479 3 129 52 730 to 34 7 479 13 12 549 20 500 4 112 64 235 to 39 11 433 14 25 447 26 449 5 132 53 340 to 44 6 362 8 18 329 10 390 4 93 56 245 to 49 6 225 5 13 273 10 273 2 57 40 250 to 54 0 153 2 5 224 17 172 0 37 12 055 to 59 1 85 1 4 138 14 149 0 24 15 060 to 64 0 75 2 4 103 0 103 1 11 11 265 to 69 0 52 0 0 69 2 85 1 10 11 070 to 74 0 46 3 1 70 6 84 1 7 2 175 to 79 0 27 2 1 46 5 54 0 0 7 180 to 84 0 20 2 0 36 1 45 0 5 6 085 to 89 1 11 2 0 20 1 22 1 4 4 090 to 94 0 6 0 0 16 0 11 0 2 1 0OVER 94 YEARS 0 0 0 0 3 0 0 0 1 0 0NOT STATED 0 2 0 0 3 0 3 0 2 3 0<strong>Summary</strong> Social, Economic, Demographic, and Housing CharacteristicsNational Statistics Office, <strong>Census</strong> <strong>2001</strong>43
Table 16. POPULATION BY COUNTRY OF BIRTH AND SEXCOUNTRY Total Male FemaleTOTAL 76,886 36,109 40,776Anguilla 35 12 23<strong>Antigua</strong> and <strong>Barbuda</strong> 53,284 25,557 27,727Bahamas 2 1 1Barbados 252 147 105Belize 11 6 5Bermuda 11 7 4BVI 85 45 41Dominica 3,966 1,735 2,231Grenada 161 89 72Guyana 5,410 2,402 3,009Jamaica 3,335 1,100 2,234Montserrat 951 476 476St. Kitts-Nevis 398 185 213St. Lucia 566 243 323St. Vincent & Grenadines 767 456 311Trinidad & Tobago 601 288 313Turks & Caicos Islands 5 0 5St. Croix 362 183 179St. Thomas 262 137 125Other Caribbean (English speaking) 11 6 5Aruba 4 1 2Cuba 18 12 6Curacao 46 25 20Dominican Republic 1,492 556 935Guadeloupe 66 36 30Haiti 28 19 8Martinique 4 2 1Puerto Rico 47 22 25Other Caribbean 43 22 22Australia 6 2 4Canada 362 173 189Ghana 26 20 6India 69 39 30New Zealand 10 6 4Nigeria 36 22 14Pakistan 0 0 0United Kingdom 831 405 426Other Commonwealth 1 0 1Honduras 6 4 2USA 2,194 1,088 1,105Venezuela 35 17 18<strong>Summary</strong> Social, Economic, Demographic, and Housing CharacteristicsNational Statistics Office, <strong>Census</strong> <strong>2001</strong>44
Table 16. CONTINUEDCOUNTRYMexico 40 23 17Guatemala 4 1 2Surinam 17 8 8French Guiana 22 13 8Other Central America 37 17 20Other South America 72 28 45France 63 33 30Germany 10 5 5Italy 14 6 8Spain 2 2 0Netherlands 7 4 4Scandinavia 110 53 57Eastern Europe 213 130 83Other Europe 48 34 14Syria 24 14 10Lebanon 8 5 4Other Middle East Countries 0 0 0Egypt 40 23 17Ethiopia 75 43 31South Africa 118 35 83Other African Countries 18 8 10China 11 5 6Japan 26 18 8Other Far East Countries 2 0 2Rest of World 102 55 47Not Stated 252 147 105Don't know 11 6 5<strong>Summary</strong> Social, Economic, Demographic, and Housing CharacteristicsNational Statistics Office, <strong>Census</strong> <strong>2001</strong>45
Table 17. POPULATION BY COUNTRY OF BIRTH AND 10 YEAR AGE GROUPCountry Total 00 to 09 10 to 19 20 to 29 30 to 39 40 to 49 50 to 59 60 to 69 70 to 79 80 to 89 90 to 98 n/sTotal 76,886 14,575 13,355 12,437 13,651 9,885 5,701 3,494 2,383 1,135 216 55Anguilla 35 0 7 5 1 6 5 8 2 0 0 0<strong>Antigua</strong> and <strong>Barbuda</strong> 53,276 11,568 9,509 8,031 7,801 6,407 4,152 2,705 1,924 950 181 47Bahamas 2 0 1 1 0 0 0 0 0 0 0 0Barbados 252 29 35 29 47 49 30 20 8 4 0 0Belize 11 0 1 4 2 1 1 1 0 0 0 0Bermuda 11 1 0 6 0 1 1 0 0 1 0 0BVI 85 6 40 5 6 8 0 5 10 6 0 0Dominica 3,966 226 526 929 1,293 537 216 123 63 42 11 0Grenada 161 5 14 25 36 36 29 6 6 2 1 0Guyana 5,410 431 933 1,263 1,454 908 284 88 33 12 1 4Jamaica 3,335 306 625 768 938 491 141 43 17 4 1 1Montserrat 951 49 84 120 193 113 123 122 100 42 4 1St. Kitts-Nevis 398 13 16 37 61 98 59 51 37 25 1 0St. Lucia 566 40 73 99 149 91 58 34 17 1 2 1St. Vincent & Grenadines 767 26 75 160 278 135 69 16 7 1 0 0Trinidad & Tobago 601 42 89 89 158 107 65 30 14 6 0 0Turks & Caicos Islands 5 0 0 1 1 1 1 0 0 0 0 0St. Croix 362 140 106 37 31 12 22 6 6 2 0 0St. Thomas 262 90 90 26 23 11 13 5 1 1 1 0Other Caribbean (English speaking) 11 4 1 1 2 2 0 0 0 0 0 0Aruba 4 1 1 0 1 0 0 0 0 0 0 0Cuba 18 0 0 1 5 1 4 2 5 0 0 0Curacao 46 4 1 0 2 30 4 0 1 4 0 0Dominican Republic 1,492 81 228 309 425 301 96 29 22 1 0 0Guadeloupe 66 12 22 10 4 4 5 5 5 0 1 0Haiti 28 4 0 4 8 11 1 0 0 0 0 0Martinique 4 0 0 0 0 0 0 0 4 0 0 0Puerto Rico 47 22 11 5 4 4 1 0 1 0 0 0Other Caribbean 43 4 10 14 7 5 0 4 0 0 0 0Australia 6 0 0 1 2 1 1 0 0 0 0 0Canada 362 84 83 42 43 43 34 19 8 5 0 0Ghana 26 0 0 12 6 5 2 1 0 0 0 0India 69 11 7 8 23 11 2 4 2 0 0 0New Zealand 10 2 0 1 2 0 4 0 0 0 0 0Nigeria 36 1 4 5 18 8 0 0 0 0 0 0Pakistan 0 0 0 0 0 0 0 0 0 0 0 0United Kingdom 831 129 98 76 207 146 79 58 34 5 0 0Other Commonwealth 1 0 0 0 0 0 1 0 0 0 0 0Honduras 6 2 4 0 0 0 0 0 0 0 0 0USA 2,194 1,159 565 85 118 105 79 39 31 6 5 1Venezuela 35 10 7 6 6 4 1 1 0 0 0 0Mexico 4 0 1 1 1 0 0 0 0 0 0 0Guatemala 0 0 0 0 0 0 0 0 0 0 0 0Surinam 40 6 13 7 6 1 2 4 0 0 0 0French Guiana 4 0 0 1 1 0 1 0 0 0 0 0<strong>Summary</strong> Social, Economic, Demographic, and Housing CharacteristicsNational Statistics Office, <strong>Census</strong> <strong>2001</strong>46
Table 17. CONTINUEDCountry Total 00 to 09 10 to 19 20 to 29 30 to 39 40 to 49 50 to 59 60 to 69 70 to 79 80 to 89 90 to 98 n/sOther Central America 17 0 0 1 5 1 0 1 1 6 1 0Other South America 22 0 2 4 7 5 2 0 0 0 1 0France 37 4 1 1 13 11 6 1 0 0 0 0Germany 72 6 6 0 17 14 17 10 1 0 1 0Italy 63 6 5 6 20 11 4 8 2 0 0 0Spain 10 2 0 1 2 2 1 0 0 0 0 0Netherlands 14 1 1 0 5 2 4 1 0 0 0 0Scandinavia 2 0 0 0 2 0 0 0 0 0 0 0Eastern Europe 7 0 2 0 0 1 4 0 0 0 0 0Other Europe 110 12 4 13 22 22 23 7 2 4 1 0Syria 213 8 13 49 70 36 18 12 5 0 1 0Lebanon 48 0 1 7 19 4 6 5 4 2 0 0Other Middle East Countries 24 1 0 11 7 5 0 0 0 0 0 0Egypt 8 0 0 1 0 2 0 2 2 0 0 0Ethiopia 0 0 0 0 0 0 0 0 0 0 0 0South Africa 40 2 7 4 11 8 6 0 0 1 0 0Other African Countries 75 5 5 20 25 13 4 2 0 0 0 0China 118 4 11 63 20 12 5 2 1 0 0 0Japan 18 2 1 2 8 2 1 0 0 0 0 0Other Far East Countries 11 0 0 5 1 2 1 0 0 1 0 0Rest of World 26 1 1 4 6 5 6 2 1 0 0 0Not stated 113 11 14 16 22 30 6 11 4 0 0 0<strong>Summary</strong> Social, Economic, Demographic, and Housing CharacteristicsNational Statistics Office, <strong>Census</strong> <strong>2001</strong>47
Table 18. Foreign Born Population By Country of Birth andYear of Last ArrivalCountry Total <strong>2001</strong> 2000 1999 1998 1997 1996 1995 1994 1993 1992 19911986to19901981to19851976to19801971to19751966to19701961to1965Before1960TOTAL 22,858 730 1,911 1,799 1,860 1,720 1,576 1,474 1,307 994 789 755 3,556 1,090 581 384 368 291 1,672Anguilla 31 0 1 0 0 0 1 1 0 0 0 0 1 0 1 4 0 0 22Bahamas 2 0 0 0 0 1 0 0 0 0 0 0 1 0 0 0 0 0 0Barbados 237 6 26 20 5 7 11 16 5 2 10 11 25 24 17 12 12 10 18Belize 10 0 0 0 1 1 2 0 0 1 0 0 0 0 1 0 0 0 2Bermuda 11 0 0 1 0 1 1 0 2 0 0 0 0 1 2 0 0 0 1BVI 67 4 4 1 1 4 1 5 2 5 1 1 10 11 2 5 1 1 8Dominica 3,828 81 163 194 237 240 201 179 172 120 102 124 903 320 166 100 93 72 361Grenada 158 4 6 6 10 10 4 7 11 2 1 2 20 14 11 8 22 6 13Guyana 5,404 163 541 459 524 435 436 396 388 291 209 253 844 101 49 5 12 17 283Jamaica 3,331 116 374 397 405 402 354 264 250 123 99 69 219 61 23 8 5 5 158Montserrat 762 6 19 12 17 73 65 105 34 14 17 5 93 51 30 30 37 28 126St. Kitts-Nevis 307 6 10 7 8 7 13 7 5 5 4 7 34 37 37 29 20 17 53St. Lucia 535 20 24 49 36 19 30 34 24 17 17 12 59 54 25 10 28 29 47St. Vincent &Grenadines 763 7 34 28 52 43 36 48 23 39 23 16 211 48 52 17 28 7 53Trinidad & Tobago 585 30 41 30 40 35 29 33 33 25 16 14 99 31 19 17 25 28 41Turks & CaicosIslands 5 0 0 0 0 0 0 1 0 0 0 0 0 0 2 0 0 0 1St. Croix 354 11 22 14 26 29 14 17 11 10 18 14 51 35 17 19 11 2 33St. Thomas 258 8 11 18 17 14 13 18 12 14 12 10 46 22 7 12 2 2 18Other Caribbean(English speaking) 11 0 0 5 0 1 0 2 0 0 0 0 0 0 1 1 0 0 0Aruba 4 0 0 0 4 0 0 0 0 0 0 0 0 0 0 0 0 0 0Cuba 12 0 6 0 1 0 0 1 0 1 0 0 0 0 0 0 1 0 1Curacao 39 0 1 4 1 0 2 1 0 1 1 0 4 4 2 0 5 8 4Dominican Republic 1,472 37 111 106 157 128 88 91 105 105 75 48 267 28 6 2 0 0 119Guadeloupe 59 0 2 6 5 4 2 4 4 4 2 2 5 5 5 1 2 4 2Haiti 26 1 2 1 0 8 1 0 0 1 2 0 4 0 0 0 1 1 2Martinique 2 1 0 0 0 0 0 0 0 0 0 0 0 0 1 0 0 0 0Puerto Rico 47 1 5 6 6 1 1 4 1 2 0 0 7 2 5 1 1 0 2Other Caribbean 41 1 1 2 2 6 2 0 0 0 1 0 5 7 2 2 1 0 6Australia 6 1 2 1 0 0 0 0 0 0 0 0 0 0 1 0 0 0 0Canada 360 23 49 31 25 18 18 18 16 13 13 7 47 34 10 7 5 8 17Ghana 26 1 4 4 7 1 1 0 1 0 0 0 5 0 0 0 0 0 2India 69 13 20 12 1 6 0 1 1 1 0 0 5 0 0 2 0 0 5New Zealand 10 2 0 0 0 4 0 0 4 0 0 0 0 0 0 0 0 0 0Nigeria 36 1 0 4 0 7 6 1 5 0 5 2 4 0 0 0 0 0 1Pakistan 0 0 0 0 0 0 0 0 0 0 0 0 0 0 0 0 0 0 0United Kingdom 813 28 83 67 46 33 49 36 33 23 29 30 113 59 25 40 30 17 72OtherCommonwealth 1 0 0 0 0 0 0 0 0 0 0 0 1 0 0 0 0 0 0Honduras 6 0 0 2 0 0 1 0 0 0 0 0 2 0 0 0 0 0 0USA 2,173 106 194 223 153 134 147 129 126 119 87 94 347 98 40 19 7 10 142Venezuela 35 0 6 7 5 1 5 2 0 1 4 0 2 1 0 0 0 0 0<strong>Summary</strong> Social, Economic, Demographic, and Housing CharacteristicsNational Statistics Office, <strong>Census</strong> <strong>2001</strong>48
Table 18. CONTINUEDCountry Total <strong>2001</strong> 2000 1999 1998 1997 1996 1995 1994 1993 1992 19911986 to19901981 to19851976 to19801971 to19751966 to19701961to1965Before1960Mexico 0 0 0 0 0 0 1 0 0 0 0 0 0 0 1 0 0 0 0Guatemala 0 0 0 0 0 0 0 0 0 0 0 0 0 0 0 0 0 0 0Surinam 5 4 1 1 5 4 0 4 0 2 0 1 1 2 2 5 4 1 1French Guiana 0 0 0 0 0 0 0 0 2 0 0 0 0 0 0 0 0 0 0Other CentralAmerica 0 1 0 0 0 1 1 0 2 1 0 1 0 0 4 0 1 0 0Other South America 2 0 0 2 1 0 4 1 1 1 0 0 0 1 0 2 0 0 2France 2 2 1 4 0 0 0 2 7 6 0 0 0 0 5 2 2 1 4Germany 6 7 2 2 2 5 1 1 4 6 2 0 1 1 7 6 7 2 2Italy 2 5 2 4 5 2 1 1 14 8 0 0 1 0 2 2 5 2 4Spain 0 1 0 2 0 1 0 0 1 0 0 0 0 0 0 0 1 0 2Netherlands 0 0 0 1 0 1 2 1 2 0 0 0 0 0 1 0 0 0 1Scandinavia 0 0 0 0 0 0 0 0 0 0 0 0 0 0 0 0 0 0 0Eastern Europe 0 0 1 0 0 0 1 0 0 0 0 0 0 0 0 0 0 1 0Other Europe 6 4 7 6 1 4 5 2 12 4 5 7 2 4 5 6 4 7 6Syria 14 12 11 22 13 17 6 8 36 1 4 12 7 7 12 14 12 11 22Lebanon 1 1 0 1 4 0 1 2 10 2 2 6 2 0 1 1 1 0 1Other MiddleEast Countries 1 0 0 0 1 4 0 0 0 1 1 0 0 1 2 1 0 0 0Egypt 0 0 0 0 0 0 0 0 5 1 2 0 0 0 0 0 0 0 0Ethiopia 0 0 0 0 0 0 0 0 0 0 0 0 0 0 0 0 0 0 0South Africa 2 0 1 2 4 6 2 1 4 1 0 0 0 0 4 2 0 1 2Other AfricanCountries 11 6 6 2 4 5 10 0 11 1 0 0 0 0 5 11 6 6 2China 4 1 1 0 1 4 1 6 7 2 0 0 1 0 0 4 1 1 0Japan 8 0 2 0 0 0 0 0 0 0 0 0 1 0 0 8 0 2 0Other Far EastCountries 0 1 0 0 0 0 0 0 1 0 2 1 0 1 0 0 1 0 0Rest of World 0 1 1 1 0 0 4 1 4 1 0 2 0 1 5 0 1 1 1Not Stated 2 0 0 0 0 0 0 0 0 0 0 0 0 0 0 2 0 0 0<strong>Summary</strong> Social, Economic, Demographic, and Housing CharacteristicsNational Statistics Office, <strong>Census</strong> <strong>2001</strong>49
Table 19. Population 15 Yrs and Over By Age Group, Sex and Marital StatusMarriedbut not inUnionWidowedand not inUnionDivorcedand not inUnionDon'tknow/ NotstatedLegally CommonlawVisitingLegallyNot in aTotal marriedunion partnerseparatedunionN/ABoth Sexes 55,176 15,845 6,661 6,794 1,057 300 1,920 1,067 20,492 1,040 015 to 19 6,322 37 120 520 0 0 0 0 5,505 140 020 to 24 6,057 315 637 1,478 8 1 4 1 3,450 161 025 to 29 6,393 1,170 1,180 1,499 59 2 4 23 2,328 128 030 to 34 6,977 2,171 1,287 1,194 90 28 11 78 1,982 136 035 to 39 6,681 2,516 1,273 887 125 39 25 110 1,601 105 040 to 44 5,549 2,374 837 519 142 45 36 135 1,365 96 045 to 49 4,323 1,831 524 349 134 45 58 159 1,104 120 050 to 54 3,265 1,510 336 178 117 34 95 170 781 45 055 to 59 2,389 1,100 187 83 105 35 149 135 565 30 060 to 64 1,882 886 130 40 88 18 185 81 433 20 065 to 69 1,578 721 70 14 70 14 218 75 377 19 070 to 74 1,339 538 37 13 51 17 297 46 327 12 075 to 79 1,021 350 23 6 35 10 295 31 261 10 080 to 84 727 217 10 2 22 7 258 19 188 5 085 to 89 406 81 6 1 2 4 175 4 132 1 090 to 94 183 19 5 1 5 1 91 1 58 1 0OVER 94 YEARS 30 2 1 0 2 0 14 0 10 0 0NOT STATED 56 5 0 7 2 1 5 0 25 11 0Male 25,290 7,951 3,279 2,968 445 128 394 405 9,153 567 015 to 19 2,998 6 24 190 0 0 0 0 2,702 75 020 to 24 2,894 83 193 663 2 0 0 1 1,848 104 025 to 29 2,941 444 548 675 20 0 0 6 1,163 84 030 to 34 3,104 955 603 513 33 17 1 18 892 72 035 to 39 3,017 1,235 634 348 51 17 4 26 659 43 040 to 44 2,504 1,193 448 206 51 14 6 41 496 49 045 to 49 2,019 954 302 163 47 19 11 52 412 60 050 to 54 1,540 849 199 96 53 10 12 63 232 26 055 to 59 1,079 577 129 54 47 7 16 61 175 13 060 to 64 862 483 95 26 34 11 22 34 147 11 065 to 69 722 418 48 11 39 7 33 41 116 11 070 to 74 588 313 28 11 24 12 63 26 108 2 075 to 79 471 226 16 5 25 7 71 20 95 5 080 to 84 308 137 6 2 13 4 72 12 60 1 085 to 89 148 61 2 0 2 1 51 1 28 1 090 to 94 60 13 4 0 2 1 26 1 12 0 0OVER 94 YEARS 8 1 1 0 1 0 5 0 0 0 0NOT STATED 27 2 0 4 1 0 2 0 10 8 0Female 29,886 7,894 3,382 3,826 612 172 1,527 662 11,339 473 015 to 19 3,324 31 96 330 0 0 0 0 2,802 65 020 to 24 3,163 232 444 815 6 1 4 0 1,602 58 025 to 29 3,452 726 632 823 39 2 4 17 1,165 43 030 to 34 3,873 1,216 684 681 58 11 10 60 1,090 64 035 to 39 3,664 1,281 638 539 75 22 22 83 943 61 040 to 44 3,045 1,181 389 313 91 30 30 94 869 47 045 to 49 2,304 878 222 187 87 25 47 107 692 60 050 to 54 1,725 661 137 82 64 24 83 107 549 18 055 to 59 1,310 524 58 29 58 28 134 73 390 17 060 to 64 1,020 403 35 13 54 7 164 47 287 10 065 to 69 856 303 22 4 31 7 185 34 261 8 070 to 74 751 225 10 2 26 5 235 19 219 10 075 to 79 550 124 7 1 10 2 224 11 166 5 080 to 84 419 79 4 0 8 4 185 7 128 4 085 to 89 258 19 4 1 0 2 124 2 105 0 090 to 94 123 6 1 1 2 0 65 0 46 1 0OVER 94 YEARS 22 1 0 0 1 0 10 0 10 0 0NOT STATED 29 3 0 4 1 1 2 0 16 2 0<strong>Summary</strong> Social, Economic, Demographic, and Housing CharacteristicsNational Statistics Office, <strong>Census</strong> <strong>2001</strong>50
Table 20. FEMALES 15 YEARS AND OVER BY AGE GROUP AND UNION STATUSTotalLegallymarriedCommonlawVisitingpartnerMarriedbutseparatedLegallyseparateWidowedand not inUnionDivorcedand notin UnionNot in aunionDon'tnow/Not statedTotal 29,886 7,894 3,382 3,826 612 172 1,527 662 11,339 47315 to 19 3,324 31 96 330 0 0 0 0 2,802 6520 to 24 3,163 232 444 815 6 1 4 0 1,602 5825 to 29 3,452 726 632 823 39 2 4 17 1,165 4330 to 34 3,873 1,216 684 681 58 11 10 60 1,090 6435 to 39 3,664 1,281 638 539 75 22 22 83 943 6140 to 44 3,045 1,181 389 313 91 30 30 94 869 4745 to 49 2,304 878 222 187 87 25 47 107 692 6050 to 54 1,725 661 137 82 64 24 83 107 549 1855 to 59 1,310 524 58 29 58 28 134 73 390 1760 to 64 1,020 403 35 13 54 7 164 47 287 1065 to 69 856 303 22 4 31 7 185 34 261 870 to 74 751 225 10 2 26 5 235 19 219 1075 to 79 550 124 7 1 10 2 224 11 166 580 to 84 419 79 4 0 8 4 185 7 128 485 to 89 258 19 4 1 0 2 124 2 105 090 to 94 123 6 1 1 2 0 65 0 46 1OVER 94YEARS 22 1 0 0 1 0 10 0 10 0NOTSTATED 29 2 0 4 1 1 2 0 16 2<strong>Summary</strong> Social, Economic, Demographic, and Housing CharacteristicsNational Statistics Office, <strong>Census</strong> <strong>2001</strong>51
Table 21. POPULATION 15 AND OVER BY SEX AND AGE OF FIRST UNIONAge at first Union Total Male FemaleTotal 27,826 12,865 14,96115 to 19 67 8 5920 to 24 2,946 666 2,28025 to 29 8,341 3,196 5,14430 to 34 7,953 4,070 3,88335 to 39 4,494 2,504 1,99040 to 44 2,178 1,271 90745 to 49 956 581 37450 to 54 456 287 17055 to 59 194 118 7660 to 64 131 87 4565 and Over 53 39 14<strong>Summary</strong> Social, Economic, Demographic, and Housing CharacteristicsNational Statistics Office, <strong>Census</strong> <strong>2001</strong>52
Table 22. Population by Age Group, Sex and Highest Level of EducationTotalDaycare/NurseryPreschoolPrimaryInfant StandardKindergarten (1-3 Yrs)PrimaryStandard (4-6 Yrs) SecondaryPre-University(College) University Other NoneNotstatedBoth Sexes 76,886 4,664 899 10,989 2,403 18,068 23,823 8,407 4,961 26 2,141 50300 to 04 7,243 4,628 833 0 0 0 0 0 0 0 1,781 105 to 09 7,381 20 43 6,366 176 0 0 0 0 0 359 41710 to 14 7,085 4 8 4,070 654 2,212 99 0 0 4 1 3415 to 19 6,322 2 1 270 409 3,180 1,658 724 54 8 0 1620 to 24 6,057 0 4 54 46 740 3,419 1,517 262 7 0 725 to 29 6,393 1 0 46 67 856 3,512 1,507 395 2 0 630 to 34 6,977 2 1 10 91 1,135 3,677 1,140 919 1 0 035 to 39 6,681 0 0 31 79 1,359 3,559 822 820 2 0 740 to 44 5,549 4 5 6 142 1,063 2,900 751 674 0 0 445 to 49 4,323 0 0 14 150 1,080 1,960 542 571 1 0 550 to 54 3,265 0 0 23 81 1,195 1,135 437 392 0 0 155 to 59 2,389 1 1 25 59 1,049 744 259 249 0 0 160 to 64 1,882 0 1 16 87 925 402 212 236 0 0 465 to 69 1,578 1 1 13 79 895 302 138 148 0 0 070 to 74 1,339 0 0 18 71 826 182 135 107 0 0 075 to 79 1,021 0 0 11 82 656 113 100 58 0 0 180 to 84 727 0 0 4 53 468 91 70 41 0 0 085 to 89 406 0 0 5 36 277 35 30 23 0 0 090 to 94 183 0 0 1 28 106 23 19 6 0 0 0OVER 94 YEARS 30 0 0 0 6 19 2 1 1 0 0 0NOT STATED 57 0 0 6 6 28 10 2 5 0 0 00 0 0 0 0 0 0 0 0 0 0 0Male 36,109 2,218 504 5,632 1,350 8,346 10,366 3,707 2,492 16 1,206 27300 to 04 3,706 2,195 472 0 0 0 0 0 0 0 1,038 105 to 09 3,680 16 22 3,160 82 0 0 0 0 0 167 23410 to 14 3,432 0 2 2,080 383 903 42 0 0 2 1 1815 to 19 2,998 1 1 177 244 1,456 810 283 13 6 0 620 to 24 2,894 0 2 31 31 482 1,646 590 102 6 0 425 to 29 2,941 0 0 42 40 518 1,534 643 163 0 0 230 to 34 3,104 1 0 5 57 577 1,570 491 403 0 0 035 to 39 3,017 0 0 12 35 698 1,483 320 467 0 0 140 to 44 2,504 2 5 4 100 527 1,212 330 323 0 0 145 to 49 2,019 0 0 11 105 535 817 281 267 1 0 250 to 54 1,540 0 0 20 45 537 496 218 224 0 0 055 to 59 1,079 1 0 22 26 433 317 138 141 0 0 060 to 64 862 0 0 12 35 406 143 120 143 0 0 265 to 69 722 1 0 13 39 376 125 84 84 0 0 070 to 74 588 0 0 17 33 329 66 72 71 0 0 075 to 79 471 0 0 11 35 274 47 65 37 0 0 180 to 84 308 0 0 4 28 165 35 48 29 0 0 085 to 89 148 0 0 4 13 93 12 11 16 0 0 090 to 94 60 0 0 1 14 24 6 11 4 0 0 0OVER 94 YEARS 8 0 0 0 2 4 1 0 1 0 0 0NOT STATED 28 0 0 6 4 11 2 1 4 0 0 00 0 0 0 0 0 0 0 0 0 0 0Female 40,777 2,446 395 5,357 1,053 9,723 13,457 4,700 2,469 11 934 23000 to 04 3,537 2,433 361 0 0 0 0 0 0 0 743 005 to 09 3,701 5 22 3,206 94 0 0 0 0 0 191 18310 to 14 3,653 4 6 1,990 271 1,309 57 0 0 1 0 1615 to 19 3,324 1 0 93 165 1,724 848 441 41 2 0 1020 to 24 3,163 0 1 23 14 259 1,773 927 160 1 0 425 to 29 3,452 1 0 4 28 338 1,978 864 232 2 0 430 to 34 3,873 1 1 5 35 559 2,107 649 515 1 0 035 to 39 3,664 0 0 19 45 661 2,076 502 353 2 0 640 to 44 3,045 1 0 2 42 536 1,688 421 352 0 0 245 to 49 2,304 0 0 4 46 545 1,143 261 303 0 0 250 to 54 1,725 0 0 2 36 659 639 219 169 0 0 155 to 59 1,310 0 1 4 33 615 427 120 108 0 0 160 to 64 1,020 0 1 4 52 519 259 91 93 0 0 165 to 69 856 0 1 0 41 519 177 54 64 0 0 070 to 74 751 0 0 1 39 497 116 63 36 0 0 075 to 79 550 0 0 0 47 382 66 35 20 0 0 080 to 84 419 0 0 0 25 303 57 22 12 0 0 085 to 89 258 0 0 1 23 184 23 19 7 0 0 090 to 94 123 0 0 0 13 82 17 8 2 0 0 0OVER 94 YEARS 22 0 0 0 4 16 1 1 0 0 0 0NOT STATED 29 0 0 0 2 17 7 1 1 0 0 0<strong>Summary</strong> Social, Economic, Demographic, and Housing CharacteristicsNational Statistics Office, <strong>Census</strong> <strong>2001</strong>53
Table 23. UNDER 15 ATTENDING SCHOOL BY TYPE OF SCHOOLInfant/ SpecialSixthDaycare Pre- Kinder Educa Pri- PostForm Technical/AdultNot NotAGE Total nursery School garten tion mary Primary Secondary ('A' Vocational University Education Other stated applicable21,705 1,044 2,537 2,655 42 8,302 547 1,973 0 0 0 0 67 79 4,4590 1,427 124 0 0 0 0 0 0 0 0 0 0 7 10 1,2861 1,424 278 0 0 0 0 0 0 0 0 0 0 12 6 1,1282 1,452 532 0 0 0 0 0 0 0 0 0 0 10 4 9073 1,468 77 937 0 0 0 0 0 0 0 0 0 1 1 4514 1,470 25 1,240 0 1 0 0 0 0 0 0 0 4 1 1995 1,580 5 313 1,168 1 0 0 0 0 0 0 0 5 2 856 1,549 0 41 1,452 1 0 0 0 0 0 0 0 7 1 477 1,399 1 6 35 0 1,310 0 0 0 0 0 0 0 4 438 1,490 0 0 0 1 1,434 0 0 0 0 0 0 0 12 439 1,363 1 0 0 5 1,303 0 0 0 0 0 0 0 7 4710 1,522 0 0 0 7 1,470 0 0 0 0 0 0 0 7 3711 1,422 0 0 0 8 1,368 0 0 0 0 0 0 0 5 4112 1,326 0 0 0 7 749 70 464 0 0 0 0 5 2 2913 1,366 0 0 0 5 340 196 771 0 0 0 0 8 7 4014 1,448 0 0 0 5 330 281 739 0 0 00 8 10 76<strong>Summary</strong> Social, Economic, Demographic, and Housing CharacteristicsNational Statistics Office, <strong>Census</strong> <strong>2001</strong>54
Table 24. Population by Age Group, Sex and Highest Level of Examination PassedSchool leavingexam Standard(6/7)CambridgeSchoolCertificateGCE 'O' levels /CXCHigh SchoolDiplomaUndergraduateDiplomaOther diploma /CertificateTotalGCE 'A' LevelsBoth Sexes 76,886 15,771 408 6,734 3,237 758 551 4,01400 to 04 7,243 0 0 0 0 0 0 005 to 09 7,381 0 0 0 0 0 0 010 to 14 7,086 1,371 0 0 0 0 0 015 to 19 6,322 2,293 12 757 250 59 10 13520 to 24 6,057 1,193 29 1,494 536 242 79 60325 to 29 6,393 1,333 30 1,169 563 134 95 72030 to 34 6,977 1,599 39 1,059 583 85 99 62235 to 39 6,681 1,743 43 811 447 71 77 58040 to 44 5,548 1,346 48 667 332 63 54 50145 to 49 4,323 1,053 35 370 206 34 41 30150 to 54 3,265 840 26 224 113 30 45 19755 to 59 2,389 710 37 95 89 18 14 12960 to 64 1,882 543 35 43 49 18 11 8965 to 69 1,578 506 29 22 26 4 11 5470 to 74 1,339 443 16 7 18 1 6 4075 to 79 1,021 336 14 4 11 0 7 2280 to 84 727 249 8 7 6 0 1 1685 to 89 406 135 2 0 5 0 1 290 to 94 183 54 2 1 2 0 0 1OVER 94 YEARS 30 11 1 0 0 0 0 0NOT STATED 57 12 0 2 0 0 0 1Male 36,108 7,169 152 2,646 1,364 306 226 1,63900 to 04 3,706 0 0 0 0 0 0 005 to 09 3,680 0 0 0 0 0 0 010 to 14 3,432 571 0 0 0 0 0 015 to 19 2,998 1,059 4 276 119 20 6 6120 to 24 2,894 627 11 602 261 90 26 25325 to 29 2,941 663 6 483 236 49 35 27930 to 34 3,104 751 8 412 226 41 39 21735 to 39 3,017 774 14 301 194 31 26 23440 to 44 2,503 590 20 266 110 25 25 22645 to 49 2,019 495 17 137 78 18 25 12650 to 54 1,540 383 13 99 47 13 22 8555 to 59 1,079 308 16 34 48 10 6 5160 to 64 862 216 12 14 13 5 5 3665 to 69 722 237 14 13 13 1 2 2670 to 74 588 184 4 4 7 1 4 1775 to 79 471 146 6 1 5 0 4 1380 to 84 308 96 5 4 2 0 1 1185 to 89 148 42 0 0 2 0 0 190 to 94 60 18 0 1 1 0 0 0OVER 94 YEARS 8 4 1 0 0 0 0 0NOT STATED 28 5 0 0 0 0 0 1Female 40,778 8,602 256 4,087 1,873 453 325 2,37500 to 04 3,537 0 0 0 0 0 0 005 to 09 3,701 0 0 0 0 0 0 010 to 14 3,654 801 0 0 0 0 0 015 to 19 3,324 1,234 8 482 131 39 4 7320 to 24 3,163 566 18 892 274 152 53 35025 to 29 3,452 669 24 686 327 84 60 44130 to 34 3,873 848 30 648 356 45 60 40635 to 39 3,664 969 29 510 253 40 51 34740 to 44 3,045 756 28 401 223 37 29 27445 to 49 2,304 559 18 232 128 16 16 17550 to 54 1,725 457 13 125 66 17 23 11255 to 59 1,310 402 22 61 41 8 8 7860 to 64 1,020 327 23 29 36 13 6 5365 to 69 856 268 14 8 13 2 8 2870 to 74 751 259 12 4 11 0 2 2375 to 79 550 190 8 2 6 0 4 880 to 84 419 153 4 4 4 0 0 585 to 89 258 93 2 0 2 0 1 190 to 94 123 36 2 0 1 0 0 1OVER 94 YEARS 22 7 0 0 0 0 0 0NOT STATED 29 7 0 2 0 0 0 0<strong>Summary</strong> Social, Economic, Demographic, and Housing CharacteristicsNational Statistics Office, <strong>Census</strong> <strong>2001</strong>55
Table 24. CONTINUEDAssociatedegreeProfessionalCertificateBachelorsDegreePostGraduateDiplomaHigherdegree(Masters/Doctoral) Other None Not stated N/ABoth Sexes 500 2,206 1,525 271 495 1,050 35,959 1,824 1,58300 to 04 0 0 0 0 0 12 6,855 60 31505 to 09 0 0 0 0 0 53 6,994 69 26610 to 14 0 0 0 0 0 122 5,350 83 16015 to 19 5 125 0 1 0 160 2,302 90 12220 to 24 33 274 102 10 5 71 1,187 84 11425 to 29 87 296 216 25 37 99 1,341 155 9330 to 34 83 367 261 45 54 91 1,684 193 11235 to 39 88 325 234 29 67 85 1,811 203 6540 to 44 66 242 203 36 88 83 1,561 187 7045 to 49 43 164 163 30 64 77 1,368 252 12450 to 54 43 175 131 31 59 71 1,133 120 2555 to 59 18 78 72 28 34 41 922 73 2960 to 64 12 53 73 17 49 17 773 77 2265 to 69 11 42 34 8 12 22 736 47 1670 to 74 10 31 22 5 11 20 649 43 1775 to 79 0 13 10 5 7 16 526 40 1180 to 84 1 12 2 1 4 7 380 25 685 to 89 0 5 2 0 2 2 232 10 690 to 94 0 2 0 0 1 0 108 8 1OVER 94 YEARS 0 0 0 0 0 0 16 2 0NOT STATED 0 0 0 0 0 0 30 1 10Male 216 917 722 142 314 438 18,090 976 79000 to 04 0 0 0 0 0 2 3,475 39 19005 to 09 0 0 0 0 0 23 3,487 47 12410 to 14 0 0 0 0 0 49 2,698 29 8515 to 19 0 30 0 1 0 75 1,242 40 6420 to 24 7 101 39 2 1 30 755 37 5125 to 29 43 117 83 11 22 36 774 69 3530 to 34 24 159 105 22 28 36 876 102 5835 to 39 45 152 120 11 41 35 897 120 2240 to 44 29 112 95 19 55 30 767 106 2645 to 49 17 83 82 18 31 26 651 148 6550 to 54 22 60 69 16 42 36 542 79 1255 to 59 4 36 42 17 28 18 412 37 1360 to 64 10 22 43 11 35 7 383 36 1465 to 69 8 26 18 5 11 12 309 18 670 to 74 7 10 16 5 7 8 281 23 1175 to 79 0 2 6 4 7 8 234 30 580 to 84 0 6 2 1 4 4 163 8 185 to 89 0 1 2 0 2 1 88 5 290 to 94 0 0 0 0 0 0 36 2 1OVER 94 YEARS 0 0 0 0 0 0 4 0 0NOT STATED 0 0 0 0 0 0 18 0 4Female 284 1,288 803 129 181 612 17,869 848 79300 to 04 0 0 0 0 0 10 3,381 22 12505 to 09 0 0 0 0 0 30 3,507 22 14210 to 14 0 0 0 0 0 72 2,652 54 7515 to 19 5 95 0 0 0 85 1,059 51 5820 to 24 25 173 64 7 4 41 432 47 6425 to 29 43 179 132 14 16 63 567 87 5830 to 34 59 208 157 23 26 55 808 90 5435 to 39 43 173 113 18 26 51 914 83 4340 to 44 37 130 108 17 33 53 795 81 4345 to 49 26 81 81 12 33 51 716 104 5950 to 54 22 114 63 16 17 35 591 41 1355 to 59 14 42 30 11 6 23 510 36 1660 to 64 2 31 30 6 14 10 390 41 765 to 69 2 16 16 4 1 10 426 29 1070 to 74 2 22 6 0 4 12 368 20 675 to 79 0 11 4 1 0 7 293 10 680 to 84 1 6 0 0 0 4 218 17 585 to 89 0 4 0 0 0 1 144 5 490 to 94 0 2 0 0 1 0 72 6 0OVER 94 YEARS 0 0 0 0 0 0 12 2 0NOT STATED 0 0 0 0 0 0 12 1 6<strong>Summary</strong> Social, Economic, Demographic, and Housing CharacteristicsNational Statistics Office, <strong>Census</strong> <strong>2001</strong>56
Table 25. Population 15 Years and Over by Age Group, Sexand Occupation for which TrainedLegislators,Sr. Officials& Managers ProfessionalTechnicians& Assoc.ProfessionalServiceWorkers &Shop SalesWorkersAgric.,Forestry &FisheryWorkersCraft &RelatedWorkersPlant &MachineOps. &AssemblersElementaryOccupationsNotApplicableTotalClerksBoth Sexes 55,071 618 2,715 3,630 3,689 5,087 111 6,860 565 1,078 30,72015 to 19 6,317 4 36 99 201 169 2 390 18 43 5,35520 to 24 6,052 28 193 383 695 604 18 739 43 104 3,24625 to 29 6,375 54 348 468 650 807 12 866 52 113 3,00530 to 34 6,960 91 392 524 612 887 7 991 85 138 3,23135 to 39 6,670 85 333 562 498 809 8 987 99 144 3,14240 to 44 5,533 84 371 450 402 622 14 795 65 136 2,59345 to 49 4,311 77 272 331 242 403 14 572 57 114 2,22850 to 54 3,260 63 265 300 152 302 6 467 34 66 1,60655 to 59 2,381 59 149 141 100 203 4 314 31 61 1,31860 to 64 1,876 42 147 123 58 98 12 219 23 51 1,10465 to 69 1,575 13 84 78 26 72 5 176 20 42 1,05770 to 74 1,339 12 67 81 18 41 4 143 14 28 93175 to 79 1,020 2 30 49 18 35 0 99 16 19 75180 to 84 727 2 20 20 11 23 1 63 6 12 56885 to 89 406 0 2 16 4 4 2 28 1 1 34890 to 94 183 0 2 4 2 2 0 7 0 4 161Over 94 Yrs 30 0 1 1 0 0 0 2 0 0 25N/S 57 0 0 0 0 5 0 2 0 0 49Male 25,240 332 1,216 1,596 577 1,831 89 5,732 503 562 12,80115 to 19 2,994 2 14 48 36 41 1 362 18 31 2,43920 to 24 2,892 12 70 166 125 216 14 661 42 63 1,52325 to 29 2,933 25 126 185 95 309 8 748 42 57 1,33630 to 34 3,095 40 153 228 78 302 7 825 77 70 1,31635 to 39 3,016 40 163 244 70 282 5 809 89 65 1,25040 to 44 2,492 40 178 209 59 214 13 668 51 63 99745 to 49 2,014 43 128 154 28 153 11 477 52 59 91050 to 54 1,537 41 118 129 34 105 5 390 31 39 64755 to 59 1,076 37 71 64 19 76 4 260 30 25 49060 to 64 858 28 78 46 11 43 10 170 19 22 43265 to 69 721 13 41 46 7 29 5 137 19 31 39270 to 74 588 8 43 35 4 20 4 101 11 18 34375 to 79 471 0 18 25 5 22 0 63 14 11 31380 to 84 308 2 12 12 4 13 0 39 6 7 21385 to 89 148 0 2 4 2 4 2 12 1 1 11990 to 94 60 0 0 0 0 1 0 6 0 1 52Over 94 Yrs 8 0 0 1 0 0 0 2 0 0 5N/S 28 0 0 0 0 1 0 2 0 0 24Female 29,831 285 1,499 2,033 3,112 3,255 22 1,128 61 515 17,91915 to 19 3,323 1 22 51 165 128 1 28 0 12 2,91620 to 24 3,160 16 123 217 569 389 4 78 1 41 1,72325 to 29 3,442 29 222 283 555 497 4 118 10 57 1,66930 to 34 3,865 52 240 296 533 585 0 166 8 69 1,91535 to 39 3,654 46 171 318 429 527 4 178 10 79 1,89340 to 44 3,041 45 193 241 343 408 1 126 14 73 1,59645 to 49 2,297 34 144 177 214 250 4 95 5 55 1,31850 to 54 1,723 22 147 171 118 197 1 77 2 28 96055 to 59 1,305 22 78 77 81 128 0 54 1 36 82860 to 64 1,017 14 69 77 47 54 2 49 4 29 67265 to 69 854 0 43 33 19 43 0 39 1 11 66570 to 74 751 4 24 46 14 20 0 42 4 10 58875 to 79 549 2 12 24 13 13 0 36 1 8 43880 to 84 419 0 8 8 7 10 1 24 0 5 35585 to 89 258 0 0 12 1 0 0 16 0 0 22990 to 94 123 0 2 4 2 1 0 1 0 2 110Over 94 Yrs 22 0 1 0 0 0 0 0 0 0 20N/S 29 0 0 0 0 4 0 0 0 0 25<strong>Summary</strong> Social, Economic, Demographic, and Housing CharacteristicsNational Statistics Office, <strong>Census</strong> <strong>2001</strong>57
Table 26(a). Population 15 and Over by Main Economic Activity and Sex for Past WeekActivity Total Male FemaleTotal 55,176 25,290 29,886Worked 33,892 16,990 16,902Had a job but didn't work 20,293 7,851 12,443Looked for work 265 172 93Wanted work 40 24 16Home duties 317 58 259Attended school 134 71 63Retired 111 60 51Disabled, unable 16 5 11Other 87 46 41Not stated 23 13 10Table 26(b). Population 15 and Over by Main Economic Activity and Sex for Past YearActivity Total Male FemaleTotal 55,153 25,281 29,872Worked 35,995 18,083 17,912Had a job but didn't work 230 98 132Looked for work 2,944 1,398 1,546Wanted work 385 191 194Home duties 4,351 442 3,909Attended school 4,951 2,213 2,738Retired 3,908 1,694 2,214Disabled, unable 796 327 468Other 480 250 230Not stated 1,112 585 527<strong>Summary</strong> Social, Economic, Demographic, and Housing CharacteristicsNational Statistics Office, <strong>Census</strong> <strong>2001</strong>58
Table 27(a). Employed Persons for Past Week by Occupational Group and SexOCCUPATION Total Male Female54,138 24,806 29,332Legislators, Sr. Officials & Managers 1,598 873 725Professionals 2,135 956 1,179Technicians & Assoc. Professionals 3,822 1,737 2,085Clerks 5,141 982 4,158Service Workers & Shop Sales Workers 7,390 2,662 4,728Agric., Forestry & Fishery Workers 525 420 105Craft & Related Workers 5,574 5,053 521Plant & Machine Ops. & Assemblers 1,779 1,667 112Elementary Occupations 6,445 2,886 3,559Not Applicable 19,730 7,569 12,161Table 27(b). Employed Persons for Past Year by Occupational Group and SexOCCUPATION Total Male Female36,232 18,177 18,055Legislators, Sr. Officials & Managers 1,589 873 716Professionals 2,110 946 1,164Technicians & Assoc. Professionals 3,794 1,732 2,061Clerks 5,066 966 4,101Service Workers & Shop Sales Workers 7,254 2,646 4,607Agric., Forestry & Fishery Workers 520 419 101Craft & Related Workers 5,453 4,940 513Plant & Machine Ops. & Assemblers 1,764 1,653 111Elementary Occupations 6,311 2,832 3,479Not Applicable 2,372 1,170 1,202<strong>Summary</strong> Social, Economic, Demographic, and Housing CharacteristicsNational Statistics Office, <strong>Census</strong> <strong>2001</strong>59
Table 28(a). Employed Persons for Past Week by Industry Group and SexType-Business Total Male Female54,139 24,818 29,321Agric., Hunting, Forestry 695 494 201Fishing 247 244 2Mining & Quarrying 108 89 19Manufacturing 1,564 941 622Electricity, Gas & Water Supply 518 424 94Construction 3,222 3,100 122Wholesale & Retail Trade 4,932 2,295 2,638Hotels & Restaurants 5,173 2,074 3,099Transport, Storage & Communications 2,818 1,830 988Financial Intermediation 1,061 320 740Real Estate, Renting & Business Activities 1,494 813 681Public Admin. & Defense 4,406 2,119 2,287Education 1,734 403 1,330Health & Social Work 1,747 303 1,444Other Community, Social & Personal Services 2,710 1,180 1,530Private House with Employed Persons 1,364 241 1,123Extra-Territorial Organizations & Bodies 521 319 202Not Applicable 19,825 7,628 12,197Table 28(b). Employed Persons for Past Year by Industry Group and SexType-Business Total Male Female36,233 18,188 18,046Agric., Hunting, Forestry 691 492 199Fishing 255 253 2Mining & Quarrying 106 87 19Manufacturing 1,541 926 615Electricity, Gas & Water Supply 513 419 94Construction 3,122 3,000 122Wholesale & Retail Trade 4,846 2,271 2,575Hotels & Restaurants 5,081 2,045 3,035Transport, Storage & Communications 2,808 1,825 982Financial Intermediation 1,049 319 730Real Estate, Renting & Business Activities 1,460 803 657Public Admin. & Defense 4,376 2,106 2,271Education 1,711 394 1,317Health & Social Work 1,716 300 1,416Other Community, Social & Personal Services 2,686 1,175 1,511Private House with Employed Persons 1,304 238 1,065Extra-Territorial Organizations & Bodies 503 307 196Not Applicable 2,467 1,228 1,239<strong>Summary</strong> Social, Economic, Demographic, and Housing CharacteristicsNational Statistics Office, <strong>Census</strong> <strong>2001</strong>60
TotalWorkedTable 29. Population 15 and Over by Age Group, Sexand Main Economic Activity Past WeekHad a jobbut didn'tworkLooked forworkWantedwork andavailableHomedutiesAttendedschool Retired Disabled Other Not statedBoth Sexes55,152 35,994 229 2,944 385 4,351 4,951 3,908 796 480 1,11515 to 19 6,321 937 13 427 41 319 4,306 0 23 69 18520 to 24 6,057 4,074 37 708 77 409 496 1 33 73 14825 to 29 6,392 5,188 33 432 46 464 59 1 29 57 8430 to 34 6,974 5,766 30 397 46 506 33 1 31 47 11835 to 39 6,677 5,527 45 329 47 544 14 7 39 35 9040 to 44 5,548 4,672 18 230 39 378 12 8 46 42 10245 to 49 4,320 3,449 25 170 33 311 5 22 49 39 21850 to 54 3,264 2,590 12 113 20 330 1 63 58 34 4355 to 59 2,387 1,720 4 72 16 250 11 208 49 28 2960 to 64 1,879 974 7 36 11 243 4 510 51 18 2565 to 69 1,576 549 2 16 10 224 1 672 65 10 2870 to 74 1,336 333 2 6 1 172 0 731 64 16 1175 to 79 1,021 132 0 2 0 108 1 702 58 10 780 to 84 727 53 0 2 0 57 0 526 79 4 685 to 89 403 7 0 0 0 29 0 287 76 1 490 to 94 183 5 0 1 0 5 0 137 35 0 0Over 94 Yrs 30 0 0 0 0 0 0 22 8 0 0N/S 57 17 0 1 0 2 7 10 4 0 160 0 0 0 0 0 0 0 0 0 0Male 25,282 18,082 98 1,398 191 442 2,213 1,694 327 250 58815 to 19 2,997 554 8 224 22 90 1,940 0 13 46 10020 to 24 2,894 2,131 13 325 35 49 219 0 13 36 7225 to 29 2,941 2,574 12 185 16 36 25 0 13 28 5230 to 34 3,103 2,777 10 148 23 28 12 1 22 20 6135 to 39 3,016 2,703 19 146 23 42 5 5 18 14 4140 to 44 2,504 2,233 8 110 13 25 4 5 25 26 5445 to 49 2,019 1,684 12 96 18 33 1 11 25 22 11750 to 54 1,540 1,322 7 71 14 36 0 24 23 17 2555 to 59 1,078 875 2 47 10 19 4 72 17 16 1660 to 64 861 560 2 23 8 23 1 205 20 8 1065 to 69 721 324 1 12 10 17 0 312 28 4 1470 to 74 586 205 1 6 0 26 0 307 29 6 675 to 79 471 83 0 1 0 8 0 350 20 5 280 to 84 308 41 0 2 0 5 0 230 26 1 285 to 89 148 5 0 0 0 2 0 117 22 1 190 to 94 60 2 0 1 0 1 0 46 10 0 0Over 94 Yrs 8 0 0 0 0 0 0 8 0 0 0N/S 28 8 0 0 0 0 2 1 2 0 130 0 0 0 0 0 0 0 0 0 0Female 29,869 17,912 131 1,546 194 3,909 2,738 2,214 468 230 52715 to 19 3,324 383 5 203 19 229 2,367 0 10 23 8520 to 24 3,163 1,943 24 383 42 360 277 1 19 37 7625 to 29 3,450 2,614 20 247 30 427 34 1 16 29 3330 to 34 3,872 2,988 20 249 23 478 20 0 10 26 5735 to 39 3,661 2,824 25 183 24 502 10 2 20 20 4940 to 44 3,044 2,439 10 120 25 353 8 4 20 16 4845 to 49 2,301 1,765 13 73 14 278 4 11 24 17 10150 to 54 1,724 1,268 5 42 6 294 1 39 35 17 1855 to 59 1,310 845 1 25 6 231 7 136 33 12 1360 to 64 1,019 414 5 13 2 220 2 306 30 10 1665 to 69 855 225 1 4 0 207 1 360 37 6 1370 to 74 750 129 1 0 1 146 0 424 35 10 575 to 79 550 49 0 1 0 100 1 352 37 5 580 to 84 419 12 0 0 0 52 0 296 53 2 485 to 89 255 2 0 0 0 26 0 170 54 0 290 to 94 123 2 0 0 0 4 0 91 25 0 0Over 94 Yrs 22 0 0 0 0 0 0 13 8 0 0N/S 29 8 0 1 0 2 5 8 1 0 2<strong>Summary</strong> Social, Economic, Demographic, and Housing CharacteristicsNational Statistics Office, <strong>Census</strong> <strong>2001</strong>61
Table 30. Employed Persons for Past Week by Age Group Sex and Industrial GroupTotalAgric.,Hunting,ForestryFishingMining &Quarrying ManufacturingElectricity,Gas &WaterSupplyConstructionWholesale& RetailTradeTransport,Hotels & Storage &Restaurants CommunicationsBoth Sexes 54,139 693 247 108 1,564 518 3,222 4,932 5,173 2,81815 to 19 6,150 11 6 4 29 7 110 193 171 4520 to 24 5,933 57 19 12 169 53 342 632 650 23425 to 29 6,300 57 34 14 175 71 454 718 822 39130 to 34 6,885 73 33 12 281 83 559 790 861 46635 to 39 6,570 107 36 16 249 78 592 707 830 44140 to 44 5,469 99 23 18 244 71 409 566 693 40345 to 49 4,245 73 24 16 149 57 300 462 489 26550 to 54 3,204 58 22 5 111 48 213 315 315 23755 to 59 2,345 46 16 8 71 33 125 208 199 17260 to 64 1,834 39 12 1 46 12 71 155 79 7565 to 69 1,521 30 14 2 20 5 28 89 42 4170 to 74 1,310 26 5 0 10 0 14 52 10 2575 to 79 985 8 2 0 10 0 1 26 4 1680 to 84 718 8 1 0 1 0 1 12 5 685 to 89 402 0 0 0 0 0 0 2 1 190 to 94 183 1 0 0 0 0 0 1 0 0Over 94 Years 30 0 0 0 0 0 0 0 0 0NOT STATED 57 0 0 0 0 0 2 4 2 10 0 0 0 0 0 0 0 0 0Male 24,818 492 244 89 941 424 3,100 2,295 2,074 1,83015 to 19 2,906 10 6 4 22 7 106 114 93 2820 to 24 2,838 51 19 11 119 46 329 302 332 12625 to 29 2,907 43 34 11 111 55 437 346 374 24230 to 34 3,069 54 33 11 169 72 535 364 338 28735 to 39 2,966 64 36 13 136 65 578 307 279 28940 to 44 2,466 65 22 16 131 57 394 266 196 26045 to 49 1,986 57 24 11 84 45 288 208 183 17750 to 54 1,506 42 22 5 67 39 201 157 113 16655 to 59 1,061 25 16 6 40 25 119 94 78 12360 to 64 846 29 12 0 31 8 70 66 48 5765 to 69 696 20 14 2 14 5 25 37 22 3970 to 74 571 18 5 0 7 0 14 17 7 2075 to 79 451 6 1 0 8 0 1 6 4 1180 to 84 306 7 1 0 1 0 1 6 4 585 to 89 146 0 0 0 0 0 0 1 1 090 to 94 60 1 0 0 0 0 0 1 0 0Over 94 Years 8 0 0 0 0 0 0 0 0 0NOT STATED 28 0 0 0 0 0 2 2 1 10 0 0 0 0 0 0 0 0 0Female 29,321 201 2 19 622 94 122 2,638 3,099 98815 to 19 3,243 1 0 0 7 0 4 78 78 1720 to 24 3,095 6 0 1 49 7 13 330 318 10725 to 29 3,393 13 0 4 64 16 17 372 448 14930 to 34 3,816 19 0 1 112 11 24 426 523 17935 to 39 3,603 43 0 2 113 13 14 400 550 15240 to 44 3,004 34 1 2 113 14 16 300 497 14345 to 49 2,259 17 0 5 65 12 12 254 306 8850 to 54 1,698 16 0 0 43 10 12 159 202 7155 to 59 1,285 20 0 2 31 7 6 114 120 4960 to 64 987 10 0 1 14 4 1 89 31 1865 to 69 825 10 0 0 6 0 2 52 20 270 to 74 739 8 0 0 2 0 0 35 2 575 to 79 533 2 1 0 1 0 0 20 0 580 to 84 412 1 0 0 0 0 0 6 1 185 to 89 256 0 0 0 0 0 0 1 0 190 to 94 123 0 0 0 0 0 0 0 0 0Over 94 Years 22 0 0 0 0 0 0 0 0 0NOT STATED 29 0 0 0 0 0 0 1 1 0<strong>Summary</strong> Social, Economic, Demographic, and Housing CharacteristicsNational Statistics Office, <strong>Census</strong> <strong>2001</strong>62
Table 30. ContinuedRealEstate,Renting & PublicFinancial Business Admin. &Intermediation Activities DefenseEducationHealth &Social WorkOtherCommunity, PrivateSocial & House withPersonal EmployedServices PersonsExtra-TerritorialOrganizations& BodiesNotApplicableFinancialIntermediationBoth Sexes 1,061 1,494 4,406 1,734 1,747 2,710 1,364 521 19,826 015 to 19 20 43 57 36 24 77 17 14 5,286 020 to 24 159 199 435 241 136 417 70 52 2,059 025 to 29 170 256 662 256 181 468 144 57 1,370 030 to 34 206 244 686 234 265 413 232 90 1,358 035 to 39 167 212 662 200 267 396 266 89 1,254 040 to 44 140 184 579 225 281 282 199 63 991 045 to 49 71 138 454 182 214 194 153 67 937 050 to 54 58 87 388 163 167 155 104 39 720 055 to 59 39 43 242 91 128 113 72 22 718 060 to 64 18 43 108 49 43 70 58 14 939 065 to 69 7 25 61 28 22 76 26 5 998 070 to 74 4 14 58 19 13 36 16 6 1,002 075 to 79 2 2 8 6 5 11 4 4 875 080 to 84 0 1 2 1 1 1 4 0 672 085 to 89 0 0 0 1 0 0 0 0 396 090 to 94 0 0 1 0 0 1 0 0 178 0Over 94 Years 0 0 0 0 0 0 0 0 30 0NOT STATED 0 0 2 1 0 0 0 0 43 00 0 0 0 0 0 0 0 0 0Male 320 813 2,119 403 303 1,180 241 319 7,629 015 to 19 4 31 35 7 5 25 5 7 2,398 020 to 24 53 112 231 60 24 138 25 33 826 025 to 29 54 128 303 63 40 175 26 28 438 030 to 34 53 118 311 47 39 158 35 49 398 035 to 39 43 110 306 57 43 161 45 48 386 040 to 44 39 84 266 49 42 155 40 40 344 045 to 49 18 81 195 39 42 102 18 43 372 050 to 54 26 51 188 23 23 89 18 34 243 055 to 59 16 28 125 25 25 61 5 16 234 060 to 64 8 36 64 11 8 43 12 10 332 065 to 69 2 19 39 11 5 42 8 4 386 070 to 74 2 12 46 6 4 20 1 6 384 075 to 79 1 2 8 4 2 7 0 2 386 080 to 84 0 1 2 1 1 1 2 0 271 085 to 89 0 0 0 1 0 0 0 0 142 090 to 94 0 0 0 0 0 0 0 0 58 0Over 94 Years 0 0 0 0 0 0 0 0 8 0NOT STATED 0 0 0 0 0 0 0 0 20 00 0 0 0 0 0 0 0 0 0Female 740 681 2,287 1,330 1,444 1,530 1,123 202 12,197 015 to 19 17 12 22 29 19 52 12 7 2,888 020 to 24 106 87 203 181 112 278 45 19 1,233 025 to 29 116 129 359 194 141 294 118 29 932 030 to 34 153 126 376 187 226 255 197 41 960 035 to 39 124 102 356 143 224 235 222 41 868 040 to 44 101 100 313 176 238 126 159 23 647 045 to 49 53 58 259 143 172 91 135 24 565 050 to 54 31 36 200 140 144 66 85 5 477 055 to 59 23 16 117 66 102 52 67 6 484 060 to 64 10 7 45 39 35 26 46 5 607 065 to 69 5 6 23 17 17 34 18 1 612 070 to 74 1 2 12 13 10 16 14 0 618 075 to 79 1 0 0 2 2 4 4 1 489 080 to 84 0 0 0 0 0 0 1 0 401 085 to 89 0 0 0 0 0 0 0 0 254 090 to 94 0 0 1 0 0 1 0 0 120 0Over 94 Years 0 0 0 0 0 0 0 0 22 0NOT STATED 0 0 2 1 0 0 0 0 23 0<strong>Summary</strong> Social, Economic, Demographic, and Housing CharacteristicsNational Statistics Office, <strong>Census</strong> <strong>2001</strong>63
Table 31. Population 15 Yrs and Over, Categorized by Gross Salary and Pay PeriodCategories Total Weekly Fortnightly Monthly Quarterly Annually Other NoneNotstatedNotapplicableTotal 29,014 15,650 3,364 9,285 39 64 379 26 61 1471 208 134 7 14 1 7 24 8 2 102 610 432 42 61 12 6 36 1 6 133 2,118 1,607 201 195 4 4 69 7 8 234 5,716 4,233 504 884 5 4 54 1 7 245 9,011 5,471 905 2,489 7 8 84 2 17 286 8,258 3,204 1,137 3,782 4 6 73 4 13 367 1,873 412 383 1,029 1 12 22 1 6 78 1,220 158 184 831 5 17 17 1 1 6<strong>Antigua</strong> And <strong>Barbuda</strong>Population Housing <strong>Census</strong> <strong>2001</strong>Income Flash CardCategories Weekly Fortnightly Monthly Quarterly Annually$ $ $ $ $1
Table 32. Employed Persons for Past Week by Employment Type and SexPAYMENT Total Male FemaleTotal 54,160 24,822 29,337Paid employee -Gov 8,613 3,795 4,818Paid employee -Private 19,824 9,770 10,054Paid employee -Statutory 929 478 451Unpaid worker 172 82 90Own business with paid help 1,318 876 442Own business without paid help 2,757 1,576 1,181Apprentice 37 26 11Don't know/not stated 243 144 99Not applicable 20,266 8,075 12,191<strong>Summary</strong> Social, Economic, Demographic, and Housing CharacteristicsNational Statistics Office, <strong>Census</strong> <strong>2001</strong>65
Table 33. Population 15 Years and Over by Type of Employment and Mode of TravelP102-MODE-TRAVELTotalPaidemployee–Govt.Paidemployee-PrivatePaidemployee-StatutoryUnpaidworkerOwnbusinesswithpaidhelpOwnbusinesswithoutpaidhelpApprenticeTotal 33,869 8,560 19,867 927 254 1,323 2,886 52Work at home 1,666 37 265 1 89 241 1,021 12Walk 5,442 1,714 2,951 90 61 155 453 17Bicycle 388 117 226 13 1 4 24 2Private car 13,931 3,702 7,813 523 76 840 966 11Company\Government 4,017 778 3,100 111 5 14 10 0Public transport 7,779 2,145 5,127 178 17 41 261 8Hired transport 277 23 171 2 2 12 65 1Other 370 43 213 8 2 16 87 0<strong>Summary</strong> Social, Economic, Demographic, and Housing CharacteristicsNational Statistics Office, <strong>Census</strong> <strong>2001</strong>66
AGE-5-YR Total WorkedTable 34. Population 15 and Over by Main Economic Activity Last Year and Age GroupHad a job butdidn't workLooked forworkWantedwork andavailableHomedutiesAttendedschool Retired Disabled Other54,160 35,728 219 2,774 353 4,145 4,812 3,798 787 43815 to 19 6,148 921 13 414 35 307 4,187 0 23 6420 to 24 5,940 4,034 33 674 71 390 484 1 33 7225 to 29 6,304 5,165 30 402 40 445 57 1 28 5230 to 34 6,894 5,732 30 382 42 482 31 1 31 4635 to 39 6,573 5,483 45 302 47 518 14 7 39 3040 to 44 5,472 4,640 18 218 36 358 11 8 46 3745 to 49 4,247 3,420 24 159 29 289 5 22 48 3650 to 54 3,205 2,570 11 101 18 317 0 61 57 2655 to 59 2,346 1,713 4 61 14 238 11 201 49 2560 to 64 1,832 966 7 35 11 226 2 496 48 1765 to 69 1,518 541 2 13 8 211 1 642 64 870 to 74 1,307 329 2 6 1 169 0 713 64 1375 to 79 985 132 0 1 0 106 1 674 57 680 to 84 718 53 0 2 0 55 0 518 79 485 to 89 400 7 0 0 0 28 0 284 76 190 to 94 183 5 0 1 0 5 0 137 35 0OVER 94 YEARS 30 0 0 0 0 0 0 22 8 0NOT STATED 57 17 0 1 0 2 7 10 4 0<strong>Summary</strong> Social, Economic, Demographic, and Housing CharacteristicsNational Statistics Office, <strong>Census</strong> <strong>2001</strong>67
Table 35. Population 15 and Over by Main Economic Activity Last Year andNumber of Months Worked Last YearMonths WorkedActivity Last Year Total 0 1 2 3 4 5 6 7 8 9 10 11 1238,623 926 389 448 705 607 675 1,471 860 1,029 1,061 980 1,451 28,021Worked 35,352 41 129 184 336 331 448 1,197 757 951 1,004 932 1,415 27,628Had a job but didn't work 203 34 8 7 22 18 22 28 16 12 7 6 2 22Looked for work 1,010 138 79 100 175 141 99 126 39 24 13 11 8 57Wanted work and available 107 13 7 13 20 16 6 12 7 1 1 0 1 8Home duties 828 256 41 65 78 57 51 42 19 14 22 14 11 158Attended school 407 136 79 53 33 13 12 14 1 11 4 1 4 46Retired 401 224 10 10 14 12 14 17 7 8 5 7 8 64Disabled 78 52 4 6 2 2 4 0 1 0 1 1 0 5Other 137 20 11 7 19 14 14 22 7 6 2 2 0 11Not stated 99 11 20 2 6 2 6 13 5 1 1 5 1 24<strong>Summary</strong> Social, Economic, Demographic, and Housing CharacteristicsNational Statistics Office, <strong>Census</strong> <strong>2001</strong>68
Table 36. Employed Persons Last Year by Number of Months Worked and Industry GroupMonths Work edType of Business Total 0 1 2 3 4 5 6 7 8 9 10 11 1235,834 77 140 199 371 365 483 1,267 798 991 1,033 956 1,434 27,721Agric., Hunting, Forestry 674 0 1 1 8 13 10 29 18 20 20 17 16 520Fishing 255 1 0 1 0 2 8 8 6 11 8 5 5 199Mining & Quarrying 106 0 1 0 1 1 0 1 0 2 0 1 5 93Manufacturing 1,533 1 8 8 8 18 8 47 33 43 33 48 54 1,222Electricity, Gas & Water Supply 510 0 0 2 4 0 0 1 2 5 0 4 25 467Construction 3,081 1 12 34 60 67 76 207 149 177 141 116 91 1,949Wholesale & Retail Trade 4,802 6 20 24 41 36 55 132 81 111 102 84 169 3,940Hotels & Restaurants 5,030 6 16 25 49 42 79 241 130 143 131 154 250 3,762Transport, Storage & Communications 2,793 1 1 7 1 10 14 64 28 41 53 54 122 2,397Financial Intermediation 1,043 0 1 4 5 2 6 11 12 13 22 16 67 884Real Estate, Renting & Business Activities 1,448 1 5 2 10 13 11 34 20 39 33 28 47 1,206Public Admin. & Defense 4,337 6 5 12 12 16 14 29 26 54 54 65 141 3,902Education 1,698 4 5 5 6 17 17 17 14 37 111 65 31 1,369Health & Social Work 1,699 1 1 4 6 7 10 24 7 20 33 35 73 1,477Other Community, Social & Personal Services 2,652 2 10 14 18 16 23 67 36 55 51 46 111 2,203Private House with Employed Persons 1,291 5 7 8 24 14 22 55 36 40 40 31 36 972Extra-Territorial Organizations & Bodies 496 2 7 2 6 2 5 16 7 11 14 13 19 390Not Applicable 2,386 39 39 43 111 87 124 283 191 167 188 175 171 769<strong>Summary</strong> Social, Economic, Demographic, and Housing CharacteristicsNational Statistics Office, <strong>Census</strong> <strong>2001</strong>69
Table 37. Females 15-64 by Age Group and Age at First Live Born ChildAGE-5-YR Total 10 to 14 15 to 19 20 to 24 25 to 29 30 to 34 35 to 39 40 to 44 45 to 49 50 to 54 55 to 59 60 to 64NotStatedTotal 49,561 380 8,755 11,311 6,606 2,606 762 228 37 16 1 1 18,85715 to 19 6,286 23 294 14 7 0 0 0 0 0 0 0 5,94720 to 24 6,010 33 886 846 16 7 2 0 0 0 0 0 4,22025 to 29 6,366 51 1,043 1,799 783 8 4 1 0 0 0 0 2,67930 to 34 6,937 59 1,327 1,920 1,332 412 16 1 0 0 0 1 1,87035 to 39 6,650 63 1,469 1,787 1,346 613 132 1 0 1 0 0 1,23940 to 44 5,518 45 1,204 1,513 951 560 236 60 2 0 0 0 94645 to 49 4,294 26 911 1,183 780 355 161 71 12 1 0 0 79250 to 54 3,248 30 698 980 586 297 96 39 11 6 0 0 50455 to 59 2,379 34 523 737 426 193 63 34 7 4 0 0 36060 to 64 1,872 18 401 531 379 161 52 20 5 4 1 0 300<strong>Summary</strong> Social, Economic, Demographic, and Housing CharacteristicsNational Statistics Office, <strong>Census</strong> <strong>2001</strong>70
Table 38. Females 15-64 by Age Group and Number of Live Births Ever HadAGE-5-YR Total 1 2 3 4 5 6 7 8 9 10 11 12 13 1415 to1819 to2223 to2627 to3031 to3536 to4041 to4546 to50Total 31,292 8,518 8,002 5,804 3,702 2,213 1,332 704 402 216 132 88 46 23 11 28 34 12 16 6 2 2 015 to 19 347 254 66 11 8 2 1 1 1 1 0 0 0 0 0 0 0 0 0 0 0 0 020 to 24 1,813 1,212 417 117 43 8 6 0 1 0 2 2 0 0 0 1 1 1 0 0 0 0 025 to 29 3,735 1,933 1,021 459 196 73 26 7 2 2 4 1 0 1 0 4 2 1 0 0 0 0 030 to 34 5,148 1,734 1,634 964 447 218 69 36 17 6 1 2 1 0 0 1 8 0 7 2 0 0 035 to 39 5,518 1,223 1,607 1,223 701 358 202 96 45 20 11 11 5 1 1 0 6 2 4 0 0 1 040 to 44 4,651 861 1,222 1,057 673 417 219 96 42 23 16 5 4 2 0 2 6 1 1 2 1 0 045 to 49 3,580 550 815 774 625 359 229 105 52 42 7 5 7 2 0 0 5 1 2 0 0 0 050 to 54 2,815 384 608 574 430 306 222 119 77 36 23 17 7 2 1 4 0 4 0 0 1 0 055 to 59 2,062 214 376 373 326 258 205 128 71 35 41 11 8 5 2 6 2 1 0 0 0 0 060 to 64 1,624 152 237 252 253 214 153 116 94 49 28 34 13 8 6 10 2 0 1 1 0 1 0<strong>Summary</strong> Social, Economic, Demographic, and Housing CharacteristicsNational Statistics Office, <strong>Census</strong> <strong>2001</strong>71
Table 39. Females 15-64 by Union Status, Age Group and Number of Live Births, Ever HadType of Union Total 1 2 3 4 5 6 7 8 9 10 11 12 13 1415 to1819 to2223 to2627 to3031 to3536 to4041 to4546 to50Total 18,236 4,999 4,722 3,390 2,155 1,285 773 405 214 104 70 35 17 12 0 12 23 7 10 2 1 1 015 to 19 295 217 59 11 5 2 0 1 0 0 0 0 0 0 0 0 0 0 0 0 0 0 020 to 24 1,303 843 315 91 35 6 4 0 1 0 2 2 0 0 0 1 1 0 0 0 0 0 025 to 29 2,299 1,102 666 305 143 48 19 2 2 1 1 1 0 1 0 4 2 1 0 0 0 0 030 to 34 3,105 934 1,000 614 293 153 51 28 11 5 0 2 1 0 0 1 6 0 5 1 0 0 035 to 39 3,153 653 898 724 411 208 136 59 28 12 7 6 1 1 0 0 5 2 1 0 0 1 040 to 44 2,635 486 677 598 401 249 117 49 24 12 10 1 4 0 0 0 4 1 1 1 0 0 045 to 49 1,966 317 431 420 341 209 131 61 25 18 6 0 0 0 0 0 4 1 1 0 0 0 050 to 54 1,481 228 344 294 228 158 108 60 31 12 8 4 2 1 0 0 0 1 0 0 1 0 055 to 59 1,127 136 212 190 178 129 119 71 41 19 19 5 2 1 0 2 1 0 0 0 0 0 060 to 64 872 84 119 143 122 122 88 72 51 24 16 13 6 7 0 4 0 0 1 0 0 0 0Legally marrie dTotal 6,250 1,074 1,763 1,424 905 470 287 136 71 45 31 14 4 5 0 5 8 1 4 1 1 1 015 to 19 16 7 6 0 1 0 0 1 0 0 0 0 0 0 0 0 0 0 0 0 0 0 020 to 24 154 83 45 13 10 0 0 0 1 0 0 1 0 0 0 1 0 0 0 0 0 0 025 to 29 561 246 172 96 33 7 2 0 0 0 1 1 0 0 0 0 1 1 0 0 0 0 030 to 34 1,058 238 405 229 106 54 13 8 2 0 0 1 0 0 0 0 0 0 1 0 0 0 035 to 39 1,165 181 372 311 157 66 46 19 4 4 2 2 0 0 0 0 1 0 0 0 0 1 040 to 44 1,069 135 300 276 187 99 34 17 7 6 2 1 1 0 0 0 2 0 1 1 0 0 045 to 49 792 77 197 214 147 76 46 12 7 7 5 0 0 0 0 0 2 0 1 0 0 0 050 to 54 588 54 129 134 111 59 52 26 16 4 1 0 1 0 0 0 0 0 0 0 1 0 055 to 59 477 25 85 83 99 55 53 34 12 13 11 1 0 1 0 2 1 0 0 0 0 0 060 to 64 370 28 52 69 57 53 41 18 22 11 8 6 1 4 0 1 0 0 0 0 0 0 0<strong>Summary</strong> Social, Economic, Demographic, and Housing CharacteristicsNational Statistics Office, <strong>Census</strong> <strong>2001</strong>72
Table 39. ContinuedCommon-law Union Total 1 2 3 4 5 6 7 8 9 10 11 12 13 14Total 2,846 751 767 501 348 232 114 57 26 16 8 5 2 2 0 1 6 4 4 1 0 0 015 to1819 to2223 to2627 to3031 to3536 to4041 to4546 to5015 to 19 55 36 14 4 1 0 0 0 0 0 0 0 0 0 0 0 0 0 0 0 0 0 020 to 24 330 177 106 31 10 4 0 0 0 0 1 1 0 0 0 0 0 0 0 0 0 0 025 to 29 532 188 177 84 46 23 10 1 1 1 0 0 0 1 0 0 0 0 0 0 0 0 030 to 34 601 154 187 125 67 39 10 7 2 0 0 1 0 0 0 1 4 0 2 1 0 0 035 to 39 578 91 152 124 85 61 31 16 6 5 2 0 0 0 0 0 2 0 1 0 0 0 040 to 44 344 64 58 61 61 47 31 10 6 2 2 0 0 0 0 0 0 1 0 0 0 0 045 to 49 208 16 29 39 52 34 17 13 4 5 0 0 0 0 0 0 0 1 0 0 0 0 050 to 54 125 18 33 20 12 19 10 7 1 0 1 1 1 0 0 0 0 1 0 0 0 0 055 to 59 43 4 10 6 8 5 5 1 4 0 0 1 0 0 0 0 0 0 0 0 0 0 060 to 64 29 4 2 6 5 1 1 1 2 2 1 0 1 1 0 0 0 0 0 0 0 0 0Visiting partne rTotal 2,665 1,086 679 401 226 124 69 36 18 11 2 4 1 1 0 1 4 1 1 0 0 0 015 to 19 111 81 22 5 1 2 0 0 0 0 0 0 0 0 0 0 0 0 0 0 0 0 020 to 24 403 285 90 19 6 1 1 0 0 0 0 0 0 0 0 0 0 0 0 0 0 0 025 to 29 573 296 158 69 34 8 5 1 0 0 0 0 0 0 0 1 1 0 0 0 0 0 030 to 34 565 187 173 99 52 24 18 4 1 4 0 0 1 0 0 0 1 0 1 0 0 0 035 to 39 473 116 126 100 60 26 19 10 8 2 1 2 0 0 0 0 0 1 0 0 0 0 040 to 44 271 52 55 65 36 37 10 11 4 0 0 0 0 0 0 0 1 0 0 0 0 0 045 to 49 160 34 39 28 25 16 10 8 1 0 0 0 0 0 0 0 0 0 0 0 0 0 050 to 54 76 24 13 14 6 6 2 1 2 4 0 1 0 1 0 0 0 0 0 0 0 0 055 to 59 23 10 2 1 4 2 2 0 0 1 0 0 0 0 0 0 0 0 0 0 0 0 060 to 64 11 2 0 1 2 0 1 1 1 0 1 0 0 0 0 0 0 0 0 0 0 0 0<strong>Summary</strong> Social, Economic, Demographic, and Housing CharacteristicsNational Statistics Office, <strong>Census</strong> <strong>2001</strong>73
Table 39. ContinuedTotal 1 2 3 4 5 6 7 8 9 10 11 12 13 14Married but not in a UnionTotal 485 71 118 96 64 48 40 22 16 5 1 2 2 0 0 0 0 0 0 0 0 0 015 to 19 0 0 0 0 0 0 0 0 0 0 0 0 0 0 0 0 0 0 0 0 0 0 020 to 24 4 2 1 0 0 0 0 0 0 0 0 0 0 0 0 0 0 0 0 0 0 0 025 to 29 31 16 8 2 2 1 0 0 1 0 0 0 0 0 0 0 0 0 0 0 0 0 030 to 34 51 5 18 13 5 5 0 2 2 0 0 0 0 0 0 0 0 0 0 0 0 0 035 to 39 70 14 16 11 16 5 6 2 0 0 0 0 0 0 0 0 0 0 0 0 0 0 040 to 44 87 11 25 19 10 11 8 2 0 0 0 0 0 0 0 0 0 0 0 0 0 0 045 to 49 76 7 17 16 11 5 8 6 2 4 0 0 0 0 0 0 0 0 0 0 0 0 050 to 54 60 2 13 14 13 8 7 0 1 0 0 0 0 0 0 0 0 0 0 0 0 0 055 to 59 54 7 13 11 6 7 4 1 4 0 0 0 1 0 0 0 0 0 0 0 0 0 060 to 64 53 6 6 10 1 6 6 7 5 1 1 2 1 0 0 0 0 0 0 0 0 0 0Legally Separate dTotal 134 17 37 30 16 12 17 4 0 1 0 0 0 0 0 0 0 0 0 0 0 0 015 to1819 to2223 to2627 to3031 to3536 to4041 to4546 to500 0 0 0 0 0 0 0 0 0 0 0 0 0 0 0 0 0 0 0 0 0 020 to 24 0 0 0 0 0 0 0 0 0 0 0 0 0 0 0 0 0 0 0 0 0 0 025 to 29 1 0 0 0 1 0 0 0 0 0 0 0 0 0 0 0 0 0 0 0 0 0 030 to 34 8 1 1 2 4 0 0 0 0 0 0 0 0 0 0 0 0 0 0 0 0 0 035 to 39 18 6 2 5 2 0 2 0 0 0 0 0 0 0 0 0 0 0 0 0 0 0 040 to 44 29 4 11 8 1 1 2 1 0 0 0 0 0 0 0 0 0 0 0 0 0 0 045 to 49 23 1 7 5 0 6 4 0 0 0 0 0 0 0 0 0 0 0 0 0 0 0 050 to 54 22 2 11 5 1 0 1 1 0 0 0 0 0 0 0 0 0 0 0 0 0 0 055 to 59 26 1 5 1 5 5 7 1 0 1 0 0 0 0 0 0 0 0 0 0 0 0 060 to 64 6 1 0 4 1 0 0 0 0 0 0 0 0 0 0 0 0 0 0 0 0 0 0<strong>Summary</strong> Social, Economic, Demographic, and Housing CharacteristicsNational Statistics Office, <strong>Census</strong> <strong>2001</strong>74
Table 39. ContinuedTotal 1 2 3 4 5 6 7 8 9 10 11 12 13 14Widowed and not in a UnionTotal 445 55 70 65 64 61 42 47 14 6 12 2 4 1 0 1 0 0 0 0 0 0 015 to 19 0 0 0 0 0 0 0 0 0 0 0 0 0 0 0 0 0 0 0 0 0 0 020 to 24 1 0 0 0 0 0 1 0 0 0 0 0 0 0 0 0 0 0 0 0 0 0 025 to 29 4 1 1 1 0 0 0 0 0 0 0 0 0 0 0 0 0 0 0 0 0 0 030 to 34 10 1 2 4 0 2 0 0 0 0 0 0 0 0 0 0 0 0 0 0 0 0 035 to 39 18 4 5 0 7 0 1 0 0 0 0 0 0 1 0 0 0 0 0 0 0 0 040 to 44 28 5 2 7 7 1 0 1 1 0 1 0 1 0 0 0 0 0 0 0 0 0 045 to 49 42 10 8 6 6 6 4 1 0 0 1 0 0 0 0 0 0 0 0 0 0 0 050 to 54 76 8 14 19 11 11 6 2 0 1 2 0 0 0 0 0 0 0 0 0 0 0 055 to 59 123 16 19 13 13 17 13 17 8 0 6 0 0 0 0 0 0 0 0 0 0 0 060 to 64 144 11 17 14 19 24 17 25 5 5 1 2 2 0 0 1 0 0 0 0 0 0 0Divorced and Not in a Unio nTotal 519 101 140 119 69 40 28 13 5 2 0 1 0 0 0 0 0 0 1 0 0 0 015 to1819 to2223 to2627 to3031 to3536 to4041 to4546 to5015 to 19 0 0 0 0 0 0 0 0 0 0 0 0 0 0 0 0 0 0 0 0 0 0 020 to 24 0 0 0 0 0 0 0 0 0 0 0 0 0 0 0 0 0 0 0 0 0 0 025 to 29 14 8 6 0 0 0 0 0 0 0 0 0 0 0 0 0 0 0 0 0 0 0 030 to 34 49 18 16 11 5 0 0 0 0 0 0 0 0 0 0 0 0 0 0 0 0 0 035 to 39 73 8 25 20 6 7 6 0 0 0 0 0 0 0 0 0 0 0 0 0 0 0 040 to 44 78 18 22 18 13 5 2 0 0 0 0 0 0 0 0 0 0 0 0 0 0 0 045 to 49 98 19 20 26 18 10 2 0 1 0 0 0 0 0 0 0 0 0 0 0 0 0 050 to 54 96 14 24 23 13 5 10 6 1 0 0 0 0 0 0 0 0 0 0 0 0 0 055 to 59 69 10 23 12 8 6 5 4 1 0 0 0 0 0 0 0 0 0 0 0 0 0 060 to 64 41 5 4 8 5 7 2 4 1 2 0 1 0 0 0 0 0 0 1 0 0 0 0<strong>Summary</strong> Social, Economic, Demographic, and Housing CharacteristicsNational Statistics Office, <strong>Census</strong> <strong>2001</strong>75
Table 39. Continu edNot in a uni onTotal 1 2 3 4 5 6 7 8 9 10 11 12 13 14 15 to 18 19 to 22 23 to 26 27 to 30 31 to 35 36 to 40 41 to 45 46 to 50Total 4,728 1,775 1,109 727 445 293 175 87 64 18 14 6 4 2 0 4 5 1 0 0 0 0 015 to 19 110 90 17 1 1 0 0 0 0 0 0 0 0 0 0 0 0 0 0 0 0 0 020 to 24 402 291 71 25 10 1 1 0 0 0 1 0 0 0 0 0 1 0 0 0 0 0 025 to 29 567 337 138 52 26 8 2 0 0 0 0 0 0 0 0 2 0 0 0 0 0 0 030 to 34 733 315 193 126 52 28 10 5 2 1 0 0 0 0 0 0 1 0 0 0 0 0 035 to 39 731 220 194 146 77 41 24 12 10 1 1 1 1 0 0 0 1 1 0 0 0 0 040 to 44 698 187 195 137 81 48 29 7 6 4 4 0 1 0 0 0 0 0 0 0 0 0 045 to 49 541 141 110 85 75 57 40 20 10 2 0 0 0 0 0 0 1 0 0 0 0 0 050 to 54 427 101 101 64 59 49 20 14 10 4 4 1 0 0 0 0 0 0 0 0 0 0 055 to 59 305 64 53 60 35 30 29 12 12 4 2 2 1 0 0 0 0 0 0 0 0 0 060 to 64 214 28 37 30 30 30 19 16 14 2 2 1 0 2 0 1 0 0 0 0 0 0 0Don't know/not stat edTotal 164 69 40 26 18 5 2 4 0 0 0 0 0 0 0 0 0 0 0 0 0 0 015 to 19 4 2 0 1 0 0 0 0 0 0 0 0 0 0 0 0 0 0 0 0 0 0 020 to 24 8 4 2 2 0 0 0 0 0 0 0 0 0 0 0 0 0 0 0 0 0 0 025 to 29 16 10 5 0 1 0 0 0 0 0 0 0 0 0 0 0 0 0 0 0 0 0 030 to 34 30 14 6 5 2 1 0 1 0 0 0 0 0 0 0 0 0 0 0 0 0 0 035 to 39 26 12 6 7 0 1 0 0 0 0 0 0 0 0 0 0 0 0 0 0 0 0 040 to 44 31 12 8 6 5 0 0 0 0 0 0 0 0 0 0 0 0 0 0 0 0 0 045 to 49 26 12 4 1 7 1 1 0 0 0 0 0 0 0 0 0 0 0 0 0 0 0 050 to 54 11 2 6 0 1 0 0 1 0 0 0 0 0 0 0 0 0 0 0 0 0 0 055 to 59 7 0 1 2 0 1 1 1 0 0 0 0 0 0 0 0 0 0 0 0 0 0 060 to 64 4 0 1 1 1 0 0 0 0 0 0 0 0 0 0 0 0 0 0 0 0 0 0<strong>Summary</strong> Social, Economic, Demographic, and Housing CharacteristicsNational Statistics Office, <strong>Census</strong> <strong>2001</strong>76
Table 40. Female 15-64 Years by Age Group and Number of Live Births in the Past 12MonthsAGE-5-YR Total None OneTwoseparatebirthTwinsThree ormoreNotapplicableTotal 26,879 13,081 1,636 11 22 11 12,11915 to 19 3,324 297 154 1 0 0 2,87120 to 24 3,163 1,000 354 4 5 1 1,79925 to 29 3,452 1,830 409 0 2 0 1,21030 to 34 3,873 2,551 374 1 10 1 93535 to 39 3,664 2,709 231 1 5 2 71540 to 44 3,045 2,337 87 1 0 1 61945 to 49 2,304 1,706 16 1 0 1 58050 to 54 1,725 367 6 1 0 2 1,34855 to 59 1,310 182 4 0 0 0 1,12460 to 64 1,020 101 1 0 0 1 916<strong>Summary</strong> Social, Economic, Demographic, and Housing CharacteristicsNational Statistics Office, <strong>Census</strong> <strong>2001</strong>77
Marital Status /AGE-5-YRTable 41. Females 15- 64 Years by Union Status,Age Group and Number of Live Births for Past 12 MonthsTotal None OneTwoseparatebirthsTwinsThree ormoreNotapplicableTotal 26,879 13,081 1,636 11 22 11 12,11915 to 19 3,324 297 154 1 0 0 2,87120 to 24 3,163 1,000 354 4 5 1 1,79925 to 29 3,452 1,830 409 0 2 0 1,21030 to 34 3,873 2,551 374 1 10 1 93535 to 39 3,664 2,709 231 1 5 2 71540 to 44 3,045 2,337 87 1 0 1 61945 to 49 2,304 1,706 16 1 0 1 58050 to 54 1,725 367 6 1 0 2 1,34855 to 59 1,310 182 4 0 0 0 1,12460 to 64 1,020 101 1 0 0 1 916Legally marriedTotal 7,133 4,220 524 2 8 4 2,37515 to 19 31 7 7 0 0 0 1720 to 24 232 96 55 0 0 0 8125 to 29 726 401 134 0 0 0 19130 to 34 1,216 844 175 0 5 1 19135 to 39 1,281 993 111 1 4 0 17240 to 44 1,181 933 34 0 0 0 21445 to 49 878 696 6 1 0 1 17350 to 54 661 129 2 0 0 1 52955 to 59 524 81 0 0 0 0 44360 to 64 403 40 0 0 0 0 364Common-law unionTotal 3,335 2,102 429 4 6 1 79315 to 19 96 16 40 0 0 0 4120 to 24 444 217 102 2 1 1 12025 to 29 632 392 112 0 1 0 12630 to 34 684 465 85 0 4 0 13035 to 39 638 478 58 0 0 0 10240 to 44 389 297 25 1 0 0 6545 to 49 222 183 5 0 0 0 3450 to 54 137 41 1 0 0 0 9555 to 59 58 8 0 0 0 0 4960 to 64 35 5 0 0 0 0 30<strong>Summary</strong> Social, Economic, Demographic, and Housing Characteristics 78National Statistics Office, <strong>Census</strong> <strong>2001</strong>
Table 41. CONTINUEDVisiting partnerTotal None OneTwoseparatebirthsTwinsThreeor moreNotapplicableTotal 3,813 2,177 364 0 1 0 1,27115 to 19 330 61 57 0 0 0 21220 to 24 815 309 113 0 0 0 39225 to 29 823 480 93 0 0 0 25030 to 34 681 484 59 0 0 0 13835 to 39 539 421 25 0 1 0 9140 to 44 313 250 13 0 0 0 4945 to 49 187 141 2 0 0 0 4350 to 54 82 22 0 0 0 0 6055 to 59 29 5 0 0 0 0 2460 to 64 13 2 1 0 0 0 10Married but not in a Union3,813 2,177 364 0 1 0 1,271Total 531 301 16 0 0 1 21315 to 19 0 0 0 0 0 0 020 to 24 6 2 1 0 0 0 225 to 29 39 24 5 0 0 0 1030 to 34 58 42 4 0 0 0 1235 to 39 75 64 5 0 0 0 640 to 44 91 73 1 0 0 0 1745 to 49 87 70 0 0 0 0 1750 to 54 64 17 0 0 0 1 4655 to 59 58 8 0 0 0 0 4960 to 64 54 0 0 0 0 0 54Legally separatedTotal 150 79 0 0 0 0 7115 to 19 0 0 0 0 0 0 020 to 24 1 0 0 0 0 0 125 to 29 2 1 0 0 0 0 130 to 34 11 7 0 0 0 0 435 to 39 22 17 0 0 0 0 540 to 44 30 28 0 0 0 0 245 to 49 25 16 0 0 0 0 1050 to 54 24 5 0 0 0 0 1955 to 59 28 6 0 0 0 0 2260 to 64 7 0 0 0 0 0 7<strong>Summary</strong> Social, Economic, Demographic, and Housing Characteristics 79National Statistics Office, <strong>Census</strong> <strong>2001</strong>
Table 41. CONTINUEDWidowed andnot in a UnionTotal None OneTwoseparatebirthsTwinsThreeor moreNotapplicableTotal 496 124 1 0 0 0 37115 to 19 0 0 0 0 0 0 020 to 24 4 1 0 0 0 0 225 to 29 4 2 0 0 0 0 130 to 34 10 6 0 0 0 0 435 to 39 22 13 0 0 0 0 840 to 44 30 18 0 0 0 0 1245 to 49 47 29 0 0 0 0 1850 to 54 83 17 1 0 0 0 6555 to 59 134 17 0 0 0 0 11760 to 64 164 20 0 0 0 0 143Divorced and not in a UnionTotal 589 324 7 0 0 0 25815 to 19 0 0 0 0 0 0 020 to 24 0 0 0 0 0 0 025 to 29 17 12 1 0 0 0 430 to 34 60 45 0 0 0 0 1635 to 39 83 66 2 0 0 0 1440 to 44 94 71 1 0 0 0 2245 to 49 107 88 0 0 0 0 1950 to 54 107 23 0 0 0 0 8455 to 59 73 13 2 0 0 0 5860 to 64 47 6 0 0 0 0 41Not in a unionTotal 10,389 3,635 288 5 5 5 6,45215 to 19 2,802 209 48 1 0 0 2,54320 to 24 1,602 365 81 1 4 0 1,15225 to 29 1,165 503 65 0 0 0 59730 to 34 1,090 636 48 1 1 0 40335 to 39 943 634 29 0 0 2 27740 to 44 869 639 12 0 0 1 21745 to 49 692 465 2 0 0 0 22550 to 54 549 112 1 1 0 0 43555 to 59 390 43 1 0 0 0 34660 to 64 287 28 0 0 0 1 258<strong>Summary</strong> Social, Economic, Demographic, and Housing Characteristics 80National Statistics Office, <strong>Census</strong> <strong>2001</strong>
Table 41. CONTINUEDTotal None OneTwoseparatebirthsTwinsThreeor moreNotapplicableDon't know/ NSTotal 443 119 8 0 1 0 31415 to 19 65 4 2 0 0 0 5920 to 24 58 10 1 0 0 0 4725 to 29 43 13 0 0 1 0 2930 to 34 64 23 4 0 0 0 3735 to 39 61 22 1 0 0 0 3940 to 44 47 26 0 0 0 0 2045 to 49 60 19 0 0 0 0 4150 to 54 18 2 0 0 0 0 1655 to 59 17 0 0 0 0 0 1760 to 64 10 0 0 0 0 0 10<strong>Summary</strong> Social, Economic, Demographic, and Housing Characteristics 81National Statistics Office, <strong>Census</strong> <strong>2001</strong>
TABLE 42.AGE GROUPHEADS OF HOUSEHOLD BY AGE, SEX OF HEAD, AND SIZE OF HOUSEHOLDSIZE OF HOUSEHOLD (NUMBER OF PERSONS)ONE TWO THREE FOUR FIVE SIX SEVEN EIGHT NINE TEN ELEVENTWELVE& OVERTOTAL PERSON PERSONS PERSONS PERSONS PERSONS PERSONS PERSONS PERSONS PERSONS PERSONS PERSONS PERSONSBOTH SEXES 20,437 5,041 4,081 3,805 3,150 2,049 1,125 560 304 163 65 37 5715-19 92 32 28 16 7 6 3 0 0 0 0 0 020-24 692 219 180 136 82 41 15 10 7 2 0 0 025-29 1,620 402 405 377 245 92 54 22 14 6 1 1 130-34 2,614 529 516 581 498 272 126 50 23 12 3 2 235-39 2,963 566 452 612 573 366 208 88 52 29 10 3 440-44 2,769 501 450 525 528 388 202 94 46 20 7 2 645-49 2,255 487 368 401 383 294 154 73 54 19 8 7 750-54 1,847 446 320 334 275 204 128 75 26 18 9 5 755-59 1,368 363 276 239 193 116 72 52 24 15 10 3 560-64 1,083 319 247 192 118 79 45 33 18 10 9 6 765-69 954 290 249 134 98 70 42 30 14 10 3 7 770-74 807 288 216 109 59 55 35 16 11 7 4 1 675 & OVER 1,373 599 374 149 91 66 41 17 15 15 1 0 5MALE 11,557 3,168 2,168 1,963 1,821 1,236 631 285 152 68 35 12 1815-19 46 24 12 6 1 3 0 0 0 0 0 0 020-24 360 140 85 64 38 17 7 4 3 1 0 0 025-29 921 263 217 216 135 46 24 10 5 5 0 0 030-34 1,469 346 266 290 301 163 64 24 10 3 2 0 035-39 1,749 421 227 316 347 234 122 46 22 10 3 1 240-44 1,608 355 211 271 315 246 130 47 24 9 4 0 045-49 1,296 342 174 199 221 188 88 38 32 8 3 2 150-54 1,078 280 177 183 163 122 81 47 13 5 5 1 155-59 746 227 140 104 120 63 38 23 13 8 6 1 260-64 625 187 153 115 63 44 20 18 8 4 7 3 265-69 536 167 151 68 59 40 20 11 6 4 1 3 470-74 434 147 135 53 29 27 19 9 6 2 3 1 275 & OVER 689 269 220 78 29 43 18 8 10 9 1 0 4FEMALE 8,880 1,873 1,913 1,842 1,329 813 494 275 152 95 30 25 3915-19 46 8 16 10 6 3 3 0 0 0 0 0 020-24 332 79 95 72 44 24 8 6 4 1 0 0 025-29 699 139 188 161 110 46 30 12 9 1 1 1 130-34 1,145 183 250 291 197 109 62 26 13 9 1 2 235-39 1,214 145 225 296 226 132 86 42 30 19 7 2 240-44 1,161 146 239 254 213 142 72 47 22 11 3 2 645-49 959 145 194 202 162 106 66 35 22 11 5 5 650-54 769 166 143 151 112 82 47 28 13 13 4 4 655-59 622 136 136 135 73 53 34 29 11 7 4 2 360-64 458 132 94 77 55 35 25 15 10 6 2 3 565-69 418 123 98 66 39 30 22 19 8 6 2 4 370-74 373 141 81 56 30 28 16 7 5 5 1 0 475 & OVER 684 330 154 71 62 23 23 9 5 6 0 0 1<strong>Summary</strong> Social, Economic, Demographic, and Housing Characteristics 82National Statistics Office, <strong>Census</strong> <strong>2001</strong>
SIZE OF HOUSEHOLDTABLE 43. NON-INSTITUTIONAL HOUSEHOLDS:POPULATION BY SIZE OF HOUSEHOLD AND PARISHST.JOHN'SST.JOHN'S ST. ST. ST. ST. ST.TOTAL (CITY) (RURAL) GEORGE PETER PHILLIP PAUL MARY BARBUDAONE 5,041 1,743 1,239 443 298 213 531 446 129TWO 4,081 1,350 1,147 379 247 168 372 354 63THREE 3,805 1,172 1,186 315 232 145 380 306 68FOUR 3,150 926 858 350 228 134 319 275 60FIVE 2,049 655 535 178 139 99 222 182 40SIX 1,125 338 301 86 106 66 106 94 27SEVEN 560 184 143 31 51 23 59 59 9EIGHT 304 111 69 16 26 9 34 28 10NINE 163 55 38 15 11 7 15 18 4TEN 65 24 11 4 5 7 7 3 4ELEVEN 37 7 12 2 2 1 7 5 1TWELVE 28 10 6 3 1 1 2 4 1THIRTEEN 11 6 2 0 1 2 0 0 0FOURTEEN 7 4 0 0 0 0 2 0 1FIFTEEN 6 3 0 0 1 0 1 1 0SIXTEEN 2 0 0 0 0 0 1 1 0SEVENTEEN 2 0 0 0 0 1 0 1 0EIGHTEEN 0 0 0 0 0 0 0 0 0NINETEEN 1 0 0 0 0 1 0 0 0TWENTY 0 0 0 0 0 0 0 0 0TWENTY PLUS 0 0 0 0 0 0 0 0 00 0 0 0 0 0 0 0 0TOTAL HOUSEHOLDS 20,437 6,588 5,548 1,822 1,348 878 2,058 1,777 418<strong>Summary</strong> Social, Economic, Demographic, and Housing CharacteristicsNational Statistics Office, <strong>Census</strong> <strong>2001</strong>83
TABLE 44. NON-INSTITUTIONAL HOUSEHOLDS:HOUSEHOLDS BY (SIZE OF HOUSEHOLD) NUMBER OF PERSONS, AND NUMBER OF ROOMS OCCUPIEDNUMBER OF ROOMSSIZE OF HOUSEHOLD(NO. OF PERSONS) TOTAL ONE TWO THREE FOUR FIVE SIX SEVEN EIGHT NINE TEN TEN+ONE 5,047 514 1,294 1,780 970 307 107 33 8 3 5 6 20TWO 4,077 117 535 1,591 1,124 463 153 56 22 2 3 3 8THREE 3,805 81 342 1,405 1,224 482 157 57 31 9 2 4 11FOUR 3,149 26 162 1,077 1,158 449 161 64 30 5 5 4 8FIVE 2,050 13 84 604 751 372 131 51 18 8 6 5 7SIX 1,122 13 31 292 452 214 74 27 12 6 0 1 0SEVEN 562 6 19 106 225 113 52 17 13 3 2 2 4EIGHT 305 4 5 55 107 68 35 20 3 2 2 2 2NINE 163 1 4 31 58 38 13 5 7 2 1 0 0TEN 65 0 1 8 24 16 7 6 3 1 0 0 0ELEVEN 37 0 0 5 11 13 2 1 0 0 0 0 0TWELVE 28 0 1 3 9 7 5 2 1 1 0 0 0THIRTEEN 11 0 0 0 3 1 3 1 1 0 1 0 0FOURTEEN 7 0 0 0 3 3 0 1 0 0 0 0 0FIFTEEN 6 0 0 0 2 1 1 1 1 0 0 0 0SIXTEEN 2 0 0 0 0 1 0 0 0 0 0 0 0SEVENTEEN 2 0 0 0 1 0 0 0 0 0 0 0 0EIGHTEEN 0 0 0 0 0 0 0 0 0 0 0 0 0NINETEEN 1 0 0 0 0 0 1 0 0 0 0 0 0TWENTY 0 0 0 0 0 0 0 0 0 0 0 0 0TWENTY PLUS 0 0 0 0 0 0 0 0 0 0 0 0 0NOTSTATEDTOTAL HOUSEHOLDS 20,437 775 2,478 6,957 6,122 2,548 902 351 151 42 27 27 60<strong>Summary</strong> Social, Economic, Demographic, and Housing CharacteristicsNational Statistics Office, <strong>Census</strong> <strong>2001</strong>84
Table 45. All Households: Dwelling Units by Type and ParishPARISHTotalUndividedprivatePart ofprivateFlat/ApartmentTownhouseDoublehouse/duplexCombinedbusiness Barracks OtherTotal 20,454 18,201 685 1,040 38 185 229 17 59ST. JOHN'S CITY 6,579 5,694 317 361 13 68 116 2 8ST. JOHN'S RURAL 5,566 4,829 166 422 9 53 52 4 31ST. GEORGE'S 1,820 1,649 46 92 1 17 12 1 2ST. PETER'S 1,345 1,294 13 21 0 7 9 1 0ST. PHILLIP'S 879 834 11 16 0 13 2 0 3ST. PAUL'S 2,064 1,863 81 51 11 25 21 6 8ST. MARY'S 1,778 1,651 30 76 4 0 11 33BARBUDA 421 387 21 1 0 2 6 0 4<strong>Summary</strong> Social, Economic, Demographic, and Housing CharacteristicsNational Statistics Office, <strong>Census</strong> <strong>2001</strong>85
Table 46. Non-Institutional Households: Dwelling Units by Type of Ownership and ParishPARISH Total Owned SquattedRentedprivateRentedGovt. Leased Rent-free OtherDon'tKnow N/STotal 20,437 12,891 34 6,641 68 42 556 116 89ST. JOHN'S CITY 6,577 3,324 14 2,944 22 7 186 40 40ST. JOHN'S RURAL 5,562 3,547 6 1,836 11 14 106 25 17ST. GEORGE'S 1,819 1,271 2 447 22 4 50 15 8ST. PETER'S 1,344 947 3 328 3 5 44 8 6ST. PHILLIP'S 879 694 1 144 3 3 21 9 4ST. PAUL'S 2,060 1,512 5 481 1 5 50 2 4ST. MARY'S 1,775 1,326 3 370 2 4 46 16 8BARBUDA 421 270 0 91 4 0 53 1 2Squatted0%Chart 4: Type of OwnershipOwned64%Rented-private32%Rented Govt0%Leased0%Rent-free3%Other1%Don't Know N/S0%OwnedSquattedRented-privateRented GovtLeasedRent-freeOtherDon't Know N/S<strong>Summary</strong> Social, Economic, Demographic, and Housing CharacteristicsNational Statistics Office, <strong>Census</strong> <strong>2001</strong>86
Table 47. Non-Institutional Households: Dwelling Units by Parish and Year BuiltPARISHTotalBefore19701970 -19791980 -19891990 -1995 1996 1997 1998 1999 2000 <strong>2001</strong>Don’tKnowTotal 20,437 2,849 1,591 2,984 3,153 691 598 733 654 616 181 6,387ST. JOHN'S CITY 6,577 1,254 528 753 618 128 75 141 113 108 31 2,828ST. JOHN'SRURAL 5,562 484 398 828 971 248 207 222 217 222 61 1,704ST. GEORGE'S 1,819 204 97 267 330 75 89 114 85 61 13 484ST. PETER'S 1,344 167 119 198 307 57 58 54 45 63 14 262ST. PHILLIP'S 879 185 86 153 145 31 22 32 30 25 9 161ST. PAUL'S 2,060 276 163 349 385 72 64 73 74 61 29 514ST. MARY'S 1,775 170 148 373 343 69 78 85 76 60 21 352BARBUDA 421 109 52 63 54 11 5 12 14 16 3 82Chart 5. Year Dwelling BuiltBefore 197014%Don't Know31%1970 - 19798%<strong>2001</strong>1%1980 - 198915%20003%19993%19984%19973%19963%1990 - 199515%<strong>Summary</strong> Social, Economic, Demographic, and Housing CharacteristicsNational Statistics Office, <strong>Census</strong> <strong>2001</strong>87
Table 48. Non-Institutional Households:Dwelling Units by Construction Material of Outer Walls and ParishPARISH Total Wood ConcreteWood &Other/don'tconcrete Stone Brick Adobe Makeshift knowTotal 20,437 9,025 6,735 4,445 36 24 1 95 76ST. JOHN'S CITY 6,577 3,582 1,358 1,584 7 5 0 17 24ST. JOHN'SRURAL 5,562 2,206 2,280 1,016 9 7 0 16 28ST. GEORGE'S 1,819 595 746 432 3 0 0 34 9ST. PETER'S 1,344 638 385 309 2 1 0 5 4ST. PHILLIP'S 879 281 405 182 5 1 0 4 1ST. PAUL'S 2,060 858 706 470 5 2 1 16 2ST. MARY'S 1,775 805 532 417 3 8 0 3 7BARBUDA 421 60 323 35 2 0 0 0 1Wood & concrete22%Chart 5. Construction Materials of Outer WallsOther/don't know1%WoodWood44%ConcreteWood &concreteOther/don'tknowConcrete33%<strong>Summary</strong> Social, Economic, Demographic, and Housing CharacteristicsNational Statistics Office, <strong>Census</strong> <strong>2001</strong>88
Table 49 Non-Institutional Households:Dwelling Units by Construction Material of Roof and ParishTotalSheetmetal(Zinc)Shingle(asphalt)Shingle(wood)Shingle(other) Tile ConcreteMakeshiftThatchOtherDon'tknowTotal 20,437 14,608 5,146 101 61 98 223 6 145 49ST. JOHN'S CITY 6,577 4,824 1,663 13 6 4 38 1 12 16ST. JOHN'S RURAL 5,562 3,925 1,383 38 23 45 73 1 58 16ST. GEORGE'S 1,819 1,179 543 4 12 8 27 1 38 7ST. PETER'S 1,344 969 345 6 4 5 7 1 6 1ST. PHILLIP'S 879 652 200 10 3 1 8 1 3 1ST. PAUL'S 2,060 1,447 530 16 6 2 39 1 15 4ST. MARY'S 1,775 1,237 440 14 7 32 28 0 13 4BARBUDA 421 375 42 0 0 1 3 0 0 0<strong>Summary</strong> Social, Economic, Demographic, and Housing CharacteristicsNational Statistics Office, <strong>Census</strong> <strong>2001</strong>89
Table 50. Non-Institutional Households:Households by Number of Rooms and ParishNumber ofRooms TotalST.JOHN'SCITYST.JOHN'SRURALST.GEORGE'SST.PETER'SST.PHILLIP'SST.PAUL'SST.MARY'S BARBUDATotal 20,437 6,577 5,562 1,819 1,344 879 2,060 1,775 4211 785 332 136 44 54 27 104 64 242 2,478 933 584 190 137 123 269 186 563 6,958 2,325 1,834 572 531 247 763 576 1104 6,129 1,935 1,671 544 402 264 584 594 1355 2,533 702 795 268 137 125 214 227 656 897 213 308 120 48 54 67 71 167 352 70 133 40 17 14 33 36 98 147 31 59 20 6 4 11 13 39 42 10 12 4 2 2 5 7 010 29 9 14 3 1 1 0 1 011 8 2 3 1 1 0 1 0 012 5 1 2 0 0 0 2 0 013 3 1 1 1 0 0 0 0 014 3 0 2 1 0 0 0 0 015 to 19 1 0 0 1 0 0 0 0 020 to 24 6 3 1 1 0 0 1 0 025 to 29 1 0 0 1 0 0 0 0 030 andOver 0 0 0 0 0 0 0 0 0Not Stated 60 10 7 8 8 18 6 0 3<strong>Summary</strong> Social, Economic, Demographic, and Housing CharacteristicsNational Statistics Office, <strong>Census</strong> <strong>2001</strong>90
Table 51. Non-Institutional Households: Dwelling Units by Number of Bedrooms and ParishBedroomsTotalST. JOHN'SCITYST. JOHN'SRURALST.GEORGE'SST.PETER'SST.PHILLIP'S ST. PAUL'S ST. MARY'S BARBUDATotal 20,437 6,577 5,562 1,819 1,344 879 2,060 1,775 4211 2,888 1,148 677 223 153 118 314 178 772 7,752 2,550 2,107 668 566 270 808 659 1243 7,175 2,128 2,067 690 468 318 674 669 1614 1,825 486 532 174 106 113 171 198 455 411 111 103 42 26 23 43 52 116 90 30 24 6 2 3 11 13 17 33 10 6 3 3 5 2 4 08 7 3 2 0 0 0 1 1 09 4 3 0 0 0 0 1 0 010 12 5 3 2 0 0 2 0 011 1 0 1 0 0 0 0 0 012 0 0 0 0 0 0 0 0 013 2 1 1 0 0 0 0 0 014 0 0 0 0 0 0 0 0 015 to 19 2 1 0 1 0 0 0 0 020 to 24 6 3 2 0 0 0 1 0 025 to 29 0 0 0 0 0 0 0 0 030 and Over 0 0 0 0 0 0 0 0 0Not Stated 229 98 37 10 20 29 32 1 2<strong>Summary</strong> Social, Economic, Demographic, and Housing CharacteristicsNational Statistics Office, <strong>Census</strong> <strong>2001</strong>91
Table 52. Non-Institutional Households:Households by Main Source of Water Supply and ParishWATER-SUPPLYTotalST. JOHN'SCITYST. JOHN'SRURALST.GEORGE'SST.PETER'SST.PHILLIP'SST. PAUL'SST.MARY'SBARBUDATotal20,437 6,577 5,562 1,819 1,344 879 2,060 1,775 421Private, piped in dwelling 988 284 292 102 26 60 105 102 17Private catchment, not piped 773 106 178 74 35 38 116 139 87Private catchment, piped 797 82 279 100 50 41 127 74 44Public, piped in dwelling 11,594 3,762 3,363 1,084 819 496 1,086 810 174Public, piped in yard 2,035 563 499 186 147 92 201 291 56Public, stand-pipe 3,738 1,680 813 209 224 118 372 302 20Public well or tank 98 24 39 3 1 6 3 17 5Other 414 76 99 61 42 28 50 40 18<strong>Summary</strong> Social, Economic, Demographic, and Housing CharacteristicsNational Statistics Office, <strong>Census</strong> <strong>2001</strong>92
Table 53. Non-Institutional Households by Type of Toilet Facility and ParishToilet FacilityTotalST. JOHN'SCITYST. JOHN'SRURALST.GEORGE'S ST. PETER'SST.PHILLIP'S ST. PAUL'S ST. MARY'S BARBUDATotal 20,437 6,577 5,562 1,819 1,344 879 2,060 1,775 421W.C. ( flush toilet) linked to Sewer 499 167 96 15 13 55 6 81 66W.C. (flush toilet) linked to Septic 14,353 4,190 4,338 1,458 960 587 1,483 1,142 195Pit-latrine/VIP 5,176 2,073 1,069 308 345 222 530 527 102Other 110 47 20 5 7 7 14 9 1None 299 100 36 30 19 8 27 16 56<strong>Summary</strong> Social, Economic, Demographic, and Housing Characteristics 93National Statistics Office, <strong>Census</strong> <strong>2001</strong>
Chart 7. Type of Toilet FacilitiesPit-latrine/VIP25%Other1%None1%W.C. ( flush toilet)linked to Sewer2%W.C. (flush toilet)linked to Septic71%<strong>Summary</strong> Social, Economic, Demographic, and Housing Characteristics 94National Statistics Office, <strong>Census</strong> <strong>2001</strong>
Table 54. Non- Institutional Households by Type of Cooking Fuel Used and ParishPARISH Total Coal Wood Propane/ Cooking Gas Kerosene Electricity OtherTotal 20,437 305 83 19,550 33 141 325ST. JOHN'S CITY 6,577 86 20 6,350 12 12 107ST. JOHN'S RURAL 5,562 49 13 5,371 8 31 90ST. GEORGE'S 1,819 16 3 1,753 2 19 26ST. PETER'S 1,344 19 5 1,279 2 5 34ST. PHILLIP'S 879 34 4 814 1 6 20ST. PAUL'S 2,060 38 27 1,963 3 8 21ST. MARY'S 1,775 46 10 1,635 5 57 22BARBUDA 421 17 1 385 0 3 15<strong>Summary</strong> Social, Economic, Demographic, and Housing Characteristics 95National Statistics Office, <strong>Census</strong> <strong>2001</strong>
Chart 8. Type of Cooking FuelKerosene0% Electricity1%Other2%Coal1%Propane/ CookingGas96%Wood0%<strong>Summary</strong> Social, Economic, Demographic, and Housing Characteristics 96National Statistics Office, <strong>Census</strong> <strong>2001</strong>
Table 55. Non-Institutional Households: Households by Number of Radios and ParishPARISH Total Yes No No Response20,437 18,066 2,196 175ST. JOHN'S CITY 6,577 5,737 797 43ST. JOHN'S RURAL 5,562 4,994 501 67ST. GEORGE'S 1,819 1,637 165 17ST. PETER'S 1,344 1,182 152 10ST. PHILLIP'S 879 797 73 9ST. PAUL'S 2,060 1,831 214 15ST. MARY'S 1,775 1,547 215 13BARBUDA 421 341 79 1<strong>Summary</strong> Social, Economic, Demographic, and Housing Characteristics 97National Statistics Office, <strong>Census</strong> <strong>2001</strong>
Table 56. Non-Institutional Households by Number of Television and ParishPARISH Total Yes NoNo response NotApplicableTotal 20,437 18,094 2,207 136ST. JOHN'S CITY 6,577 5,768 774 35ST. JOHN'S RURAL 5,562 5,066 446 50ST. GEORGE'S 1,819 1,654 151 14ST. PETER'S 1,344 1,194 141 9ST. PHILLIP'S 879 766 106 7ST. PAUL'S 2,060 1,761 292 7ST. MARY'S 1,775 1,548 216 11BARBUDA 421 337 81 3<strong>Summary</strong> Social, Economic, Demographic, and Housing CharacteristicsNational Statistics Office, <strong>Census</strong> <strong>2001</strong>98
Table 57. Non-Institutional Households: Households by Number of Video Recorders and ParishPARISH Total Yes No No response/NotTotal 20,437 10,548 9,563 326ST. JOHN'S CITY 6,577 3,045 3,429 103ST. JOHN'S RURAL 5,562 3,196 2,249 117ST. GEORGE'S 1,819 1,055 740 24ST. PETER'S 1,344 694 626 24ST. PHILLIP'S 879 458 402 19ST. PAUL'S 2,060 1,002 1,042 16ST. MARY'S 1,775 880 873 22BARBUDA 421 218 202 1<strong>Summary</strong> Social, Economic, Demographic, and Housing CharacteristicsNational Statistics Office, <strong>Census</strong> <strong>2001</strong>99
Table 58. Non-Institutional Households: Number of Households With/Without Telephones by ParishPARISH Total Yes No No responseTotal 20,437 13,582 6,581 274ST. JOHN'S CITY 6,577 3,837 2,659 81ST. JOHN'S RURAL 5,562 4,044 1,422 96ST. GEORGE'S 1,819 1,370 431 18ST. PETER'S 1,344 904 419 21ST. PHILLIP'S 879 630 238 11ST. PAUL'S 2,060 1,359 686 15ST. MARY'S 1,775 1,170 574 31BARBUDA 421 268 152 1<strong>Summary</strong> Social, Economic, Demographic, and Housing CharacteristicsNational Statistics Office, <strong>Census</strong> <strong>2001</strong>100
Projected Estimated Resident Population <strong>2001</strong>-2010<strong>2001</strong>Age-1-5-YrTotalTotal76,886Male36,109Female40,7770 1,428 710 7171 1,427 738 6852 1,453 753 7003 1,469 776 6934 1,472 732 7405-9 7,387 3,683 3,70410-14 7,091 3,435 3,65615-19 6,326 3,000 3,32620-24 6,062 2,897 3,16525-29 6,398 2,944 3,45430-34 6,982 3,106 3,87635-39 6,686 3,019 3,66740-44 5,551 2,505 3,04645-49 4,326 2,021 2,30650-54 3,268 1,541 1,72755-59 2,390 1,080 1,31060-64 1,884 863 1,02165-69 1,579 723 85770-74 1,339 588 75275-79 1,022 471 55180-84 727 308 41985-89 406 148 25890-94 183 60 123Over 94 30 8 22Projected Estimated Resident Population <strong>2001</strong>-2010101National Statistics Office, <strong>Census</strong> <strong>2001</strong>
Projected Estimated Resident Population <strong>2001</strong>-20102002Age-1-5-YrTotalTotal78,320Male36,780Female41,5400 1,454 724 7311 1,454 752 7022 1,480 767 7133 1,497 791 7064 1,499 745 7545-9 7,525 3,752 3,77310-14 7,223 3,499 3,72415-19 6,444 3,056 3,38820-24 6,175 2,951 3,22425-29 6,517 2,998 3,51930-34 7,112 3,164 3,94935-39 6,811 3,076 3,73540-44 5,655 2,551 3,10345-49 4,407 2,059 2,34950-54 3,329 1,569 1,75955-59 2,434 1,100 1,33460-64 1,919 879 1,04065-69 1,609 736 87370-74 1,364 599 76675-79 1,041 480 56180-84 741 314 42785-89 414 151 26390-94 186 61 125Over 94 31 7 24Projected Estimated Resident Population <strong>2001</strong>-2010102National Statistics Office, <strong>Census</strong> <strong>2001</strong>
Projected Estimated Resident Population <strong>2001</strong>-20102003Age-1-5-YrTotalTotal79,781Male37,467Female42,3140 1,482 737 7451 1,481 766 7152 1,508 781 7273 1,525 806 7194 1,527 759 7685-9 7,665 3,822 3,84310-14 7,359 3,565 3,79415-19 6,565 3,113 3,45220-24 6,290 3,006 3,28425-29 6,638 3,054 3,58430-34 7,245 3,223 4,02235-39 6,937 3,133 3,80440-44 5,760 2,599 3,16145-49 4,489 2,097 2,39250-54 3,391 1,599 1,79255-59 2,480 1,121 1,35960-64 1,954 895 1,05965-69 1,639 750 88970-74 1,390 610 78075-79 1,060 489 57180-84 755 320 43585-89 421 154 26790-94 190 62 128Over 94 30 6 24Projected Estimated Resident Population <strong>2001</strong>-2010103National Statistics Office, <strong>Census</strong> <strong>2001</strong>
Projected Estimated Resident Population <strong>2001</strong>-20102004Age-1-5-YrTotalTotal81,270Male38,166Female43,1040 1,509 751 7581 1,508 780 7282 1,536 796 7403 1,553 821 7324 1,555 773 7825-9 7,808 3,893 3,91510-14 7,496 3,631 3,86515-19 6,687 3,171 3,51620-24 6,407 3,062 3,34525-29 6,762 3,111 3,65130-34 7,380 3,283 4,09735-39 7,067 3,191 3,87640-44 5,868 2,648 3,22045-49 4,573 2,136 2,43750-54 3,454 1,628 1,82655-59 2,526 1,141 1,38560-64 1,991 912 1,07965-69 1,669 764 90570-74 1,416 621 79575-79 1,080 498 58280-84 769 326 44385-89 429 157 27290-94 193 63 130Over 94 30 9 21Projected Estimated Resident Population <strong>2001</strong>-2010104National Statistics Office, <strong>Census</strong> <strong>2001</strong>
Projected Estimated Resident Population <strong>2001</strong>-20102005Age-1-5-YrTotalTotal82,786Male38,878Female43,9080 1,537 765 7721 1,537 795 7422 1,565 811 7543 1,582 836 7464 1,585 788 7975-9 7,954 3,966 3,98810-14 7,635 3,699 3,93715-19 6,812 3,230 3,58220-24 6,527 3,119 3,40825-29 6,889 3,169 3,71930-34 7,518 3,344 4,17435-39 7,199 3,251 3,94840-44 5,977 2,697 3,28045-49 4,658 2,176 2,48250-54 3,518 1,659 1,85955-59 2,573 1,162 1,41160-64 2,028 929 1,09965-69 1,700 778 92270-74 1,442 633 80975-79 1,100 507 59380-84 783 332 45185-89 437 160 27890-94 197 65 132Over 94 32 9 23Projected Estimated Resident Population <strong>2001</strong>-2010105National Statistics Office, <strong>Census</strong> <strong>2001</strong>
Projected Estimated Resident Population <strong>2001</strong>-20102006Age-1-5-YrTotalTotal84,330Male39,603Female44,7270 1,566 779 7871 1,565 809 7562 1,594 826 7683 1,612 852 7604 1,614 803 8115-9 8,102 4,040 4,06310-14 7,778 3,768 4,01015-19 6,939 3,290 3,64820-24 6,649 3,177 3,47125-29 7,017 3,229 3,78930-34 7,658 3,406 4,25235-39 7,333 3,312 4,02240-44 6,089 2,747 3,34145-49 4,745 2,217 2,52950-54 3,584 1,690 1,89455-59 2,621 1,184 1,43760-64 2,066 946 1,12065-69 1,732 793 94070-74 1,469 644 82575-79 1,121 516 60480-84 798 338 46085-89 445 163 28390-94 201 66 135Over 94 33 9 24Projected Estimated Resident Population <strong>2001</strong>-2010106National Statistics Office, <strong>Census</strong> <strong>2001</strong>
Projected Estimated Resident Population <strong>2001</strong>-20102007Age-1-5-YrTotalTotal85,903Male40,342Female45,5600 1,595 794 8011 1,594 824 7702 1,624 841 7823 1,642 867 7744 1,644 818 8275-9 8,254 4,115 4,13810-14 7,923 3,838 4,08515-19 7,068 3,352 3,71620-24 6,773 3,237 3,53625-29 7,148 3,289 3,85930-34 7,801 3,470 4,33135-39 7,470 3,374 4,09740-44 6,202 2,798 3,40445-49 4,834 2,258 2,57650-54 3,651 1,721 1,92955-59 2,670 1,206 1,46460-64 2,105 964 1,14165-69 1,764 807 95770-74 1,496 656 84075-79 1,142 526 61680-84 813 345 46885-89 454 166 28890-94 204 67 137Over 94 32 9 23Projected Estimated Resident Population <strong>2001</strong>-2010107National Statistics Office, <strong>Census</strong> <strong>2001</strong>
Projected Estimated Resident Population <strong>2001</strong>-20102008Age-1-5-YrTotalTotal87,506Male41,095Female46,4110 1,625 809 8161 1,624 840 7842 1,654 857 7973 1,672 884 7894 1,675 833 8425-9 8,408 4,192 4,21610-14 8,071 3,909 4,16115-19 7,200 3,414 3,78620-24 6,899 3,297 3,60225-29 7,281 3,350 3,93130-34 7,946 3,535 4,41235-39 7,610 3,436 4,17340-44 6,318 2,851 3,46745-49 4,924 2,300 2,62450-54 3,719 1,754 1,96555-59 2,720 1,229 1,49160-64 2,144 982 1,16265-69 1,797 822 97570-74 1,524 669 85675-79 1,163 536 62780-84 828 351 47785-89 462 169 29390-94 208 68 140Over 94 34 9 25Projected Estimated Resident Population <strong>2001</strong>-2010108National Statistics Office, <strong>Census</strong> <strong>2001</strong>
Projected Estimated Resident Population <strong>2001</strong>-20102009Age-1-5-YrTotalTotal89,138Male41,861Female47,2770 1,655 824 8321 1,654 855 7992 1,685 873 8123 1,703 900 8034 1,706 848 8585-9 8,564 4,270 4,29410-14 8,221 3,982 4,23915-19 7,334 3,478 3,85620-24 7,028 3,359 3,66925-29 7,417 3,413 4,00530-34 8,095 3,600 4,49435-39 7,751 3,501 4,25140-44 6,436 2,904 3,53245-49 5,016 2,343 2,67350-54 3,788 1,786 2,00255-59 2,770 1,252 1,51960-64 2,184 1,000 1,18465-69 1,831 838 99370-74 1,553 681 87275-79 1,185 546 63980-84 843 358 48685-89 471 172 29990-94 212 70 143Over 94 35 9 26Projected Estimated Resident Population <strong>2001</strong>-2010109National Statistics Office, <strong>Census</strong> <strong>2001</strong>
Projected Estimated Resident Population <strong>2001</strong>-20102010Age-1-5-YrTotalTotal90,801Male42,642Female48,1590 1,686 839 8471 1,685 871 8142 1,716 889 8273 1,735 917 8184 1,738 864 8745-9 8,724 4,350 4,37410-14 8,375 4,057 4,31815-19 7,471 3,543 3,92820-24 7,159 3,421 3,73825-29 7,556 3,476 4,07930-34 8,246 3,668 4,57835-39 7,896 3,566 4,33040-44 6,556 2,958 3,59845-49 5,109 2,387 2,72350-54 3,859 1,820 2,04055-59 2,822 1,275 1,54760-64 2,225 1,019 1,20665-69 1,865 853 1,01270-74 1,582 694 88875-79 1,207 556 65180-84 859 364 49585-89 479 175 30490-94 216 71 145Over 94 35 9 26Projected Estimated Resident Population <strong>2001</strong>-2010110National Statistics Office, <strong>Census</strong> <strong>2001</strong>
Office embarked on several initiatives during census <strong>2001</strong> to minimize under-coverage of both Population andHousing Units, and to reduce costs. These initiatives were based on experience garnered for the 1991 <strong>Census</strong>operations; included here were outreach programs for the Spanish communities—rigorous/robust publicityprograms in Spanish along with the employment of a greater number of highly skilled Spanish interpreters usedas enumerators or as enumerator assistants. Also provisions were made for respondents to be enumerated atconvenient locations apart from their homes, viz. offices/place of work.CALCULATION OF ERRORS AND POPULATUION ESTIMATESThe Estimated Resident Population and the calculation of errors in the estimates are shown/derived below:The Estimated Resident Population (P ter ) consists the algebraic sum of: the Resident Population in PrivateHouseholds (P erph ); the Population in Open Institutions, Restricted Institutions, Hotels [Long-Term Guests], andVagrants (P ihv ).The Estimated de facto Population (P def ) consists the algebraic sum of: the Estimated Resident Population (P ter ),and Crew onboard ship(s) in Harbour/Port and Hotel and Guest House Visitors (short term), (P cshgv ).Now, If P tP ncP r= Tabulated Population (defined previously);= “No Contact” estimates;= “Refusals” estimates;ThenandP ter = (P t + P nc + P r ) + P ihv …………………………………………………………………………………….(1)P erph = (P t + P nc + P r )…………………………………………………………………………………………….(2)P ter = P erph + P ihv ……………………………………………………………………………………………….(3)P def = P ter + P cshgv ……………………………………………………………………………………………….(4)Now, Table A.1— Average Household Size by Parish is shown below:ParishAverageHousehold Size( xi)St. John (city) 3.0St. John (rural) 3.1St. George 2.9St. Peter 3.3St. Phillip 3.3St. Mary 3.1St. Paul 3.1<strong>Barbuda</strong> 3.1Mean of the Average Household Sizes (mean of the means), μ = 3.11= μ , Population Mean (i.e. averagehousehold size in <strong>Antigua</strong> and <strong>Barbuda</strong> as at <strong>Census</strong> <strong>2001</strong>)Standard Error (of mean of household size), σ (= σ av) = 0.14XXP nc = N nc X μ= 1372 x 3.1 = 4,253 ; where N nc = 1,372, “No Contact” Households; and, μ = 3.1, population mean.P r = N r x μAccuracy of the DataNational Statistics Office, <strong>Census</strong> <strong>2001</strong>A-2
= 2,480 x 3.105 = 7,700 ; where Nr = 2,480, Households “Refusals”P erph = (63,863 + 4,253 + 7,700) = 75,816—Estimated Residential population in Private Households.P ihv = 1,070P ter = (75,816 + 1,070) = 76,886—Total Estimated Residential Population.Now, we derive expressions for errors and their values in the population estimates:2 2σP⎛ncσN⎞nc⎛σμ⎞= ⎜ ⎟ + ⎜ ⎟Pnc⎝ Nnc⎠ ⎝ μ ⎠; where σ N = N = 1372 = 37.04ncnc=2 2⎛37.04 ⎞ ⎛0.14⎞⎜ ⎟ + ⎜ ⎟⎝ 1372 ⎠ ⎝3.11⎠σ P nc = ± 223.23………………………………………………………………………………………(i)2 2σP⎛rσN⎞r⎛σμ⎞= ⎜ ⎟ + ⎜ ⎟Pr⎝ Nr⎠ ⎝ μ ⎠; where σ N = N = 2480 = 49.80rr=2 2⎛49.80 ⎞ ⎛0.14⎞⎜ ⎟ + ⎜ ⎟⎝ 2480 ⎠ ⎝3.11⎠σ P r = 379.55………………………………………………………………………………………(ii)±1,070 32.71σ P = P = =± ……………………………………………………………......(iii)invinvσ P = P = 63,863 =± 252.71………………………………………………………………(iv)tt2 2 2( ) ( ) ( ) ( )σP = σP + σP + σP + σPter t nc r inv= ( ) 2 + ( ) 2 + ( ) 2+ (252.71 379.55 223.23 32.71=± 508.752……………………………………………..(v))2Accuracy of the DataNational Statistics Office, <strong>Census</strong> <strong>2001</strong>A-3
2 2( ) ( ) ( )erph t nc r2σP = σP + σP + σP………………………………………………………(vi).= ( 252.71) 2 + ( 379.55) 2+ ( 223.23)= ± 507.69σ P = P = 1,685 =± 41.05cshgvcshgv2( ) ( ) 2def ter cshgv2σP = σP + σP……………………………………………………………..(vii)2 2= ( 508.75) + ( 41.05)= ± 510.40The respective population estimates may thus be reported as follows:The total Estimated Resident Population, P ter = 76,886 ± 509; the % error in the estimate is:508.75 *100 = 0.66% , the estimate is therefore 99.34 % accurate.76,886The Estimated Resident Population in Private Households, P erph = 75,816 ± 508; the % error in the estimateis: 507.69 *100 = 0.67% , the estimate is therefore 99.33% accurate.75,816The Estimated de facto Population, P def = 78,571 ± 510; the % error in the estimate is: 510.40 *100 = 0.65% ,78,571the estimate is therefore 99.35% accurate.□Accuracy of the DataNational Statistics Office, <strong>Census</strong> <strong>2001</strong>A-4
Appendix BQuestionnaireQuestionnaireNational Statistics Office, <strong>Census</strong> <strong>2001</strong>B-1
Appendix BQuestionnaireQuestionnaireNational Statistics Office, <strong>Census</strong> <strong>2001</strong>B-2
Appendix BQuestionnaireQuestionnaireNational Statistics Office, <strong>Census</strong> <strong>2001</strong>B-3
Appendix BQuestionnaireQuestionnaireNational Statistics Office, <strong>Census</strong> <strong>2001</strong>B-4
Appendix BQuestionnaireQuestionnaireNational Statistics Office, <strong>Census</strong> <strong>2001</strong>B-5
Appendix BQuestionnaireQuestionnaireNational Statistics Office, <strong>Census</strong> <strong>2001</strong>B-6
Appendix BQuestionnaireQuestionnaireNational Statistics Office, <strong>Census</strong> <strong>2001</strong>B-7
Appendix BQuestionnaireQuestionnaireNational Statistics Office, <strong>Census</strong> <strong>2001</strong>B-8
Appendix BQuestionnaireQuestionnaireNational Statistics Office, <strong>Census</strong> <strong>2001</strong>B-9
Appendix BQuestionnaireQuestionnaireNational Statistics Office, <strong>Census</strong> <strong>2001</strong>B-10
Appendix BQuestionnaireQuestionnaireNational Statistics Office, <strong>Census</strong> <strong>2001</strong>B-11
Appendix BQuestionnaireQuestionnaireNational Statistics Office, <strong>Census</strong> <strong>2001</strong>B-12
Appendix BQuestionnaireQuestionnaireNational Statistics Office, <strong>Census</strong> <strong>2001</strong>B-13
Appendix BQuestionnaireQuestionnaireNational Statistics Office, <strong>Census</strong> <strong>2001</strong>B-14
Appendix C.AcknowledegmentsThe United Nations Fund for Population Activities (UNFPA, Mexico) and United Nations StatisticalDepartment (UNSD), Dr. Carlos Ellis, Technical Advisor in Data processing/ Consultant, author of the coreconsistency and corrections—CONCOR program used by member States in their respective censuses[thisprogram was customized for national use, by the Chief Statistician and programmer]. Dr. Ellis (assisted bySerge Poulard) conducted the Regional <strong>Census</strong> Data Processing Training Workshop for OECS member Statesin support of the Regionally coordinated 2000/<strong>2001</strong> Round of Population and Housing <strong>Census</strong>es, in Gros-Islet, St.Lucia November 5 – 9, <strong>2001</strong>.The Demographic Centre for Latin American and the Caribbean, (Centro Latinoamericano y Caribeno deDemografia (CELADE)/UNECLAC, Serge Poulard, Physicist/Computer programmer and Regional Advisor inData Processing/ Consultant; for a sterling contribution to software design and development; for sustainedtechnical assistance in the varied aspects of data processing—removing all hindrances/kinks and bottlenecksthereby effecting seamless throughput, and timely realization of goals and objectives; for sustainedcommunication/dialogue throughout the phases of the census. To this Titan of Computer Science, Philanthropist,and Icon of Assistance I bestow the posthumous accolades of meritorious service to the nation of <strong>Antigua</strong> and<strong>Barbuda</strong>, and to the Region (all CARICOM member States) as a whole. Serge Poulard has served us all well fornearly two decades (two censuses), may his soul rest in eternal peace (Requiescat In Pace).The United States Bureau of the <strong>Census</strong>, Computer Software Branch, Michael Stroot, and Glenn Ferri forsustained technical assistance with emphasis on IMPS (CONCOR, and CENTS) programming and user-specificapplication design and development; in the use of CSPro.; to the Bureau for making IMPS and CSPro freelyavailable on the Internet; for always providing timely and feasible solutions to multifarious problems as they arosefrom time to time.The Caribbean Community(CARICOM) Secretariat, Osmond Gordon, Programme Manager, for sustainedsupport and coordination of activities of the whole census exercise; Dr. Philomen Harrison, ProgrammeManager, Statistics, for her support and encouragement; and the Regional <strong>Census</strong> Coordinating Committee(RCCC), for general advice.The Central Statistical Office of Belize, Danny Tunn, Statistical Assistant and OMR Consultant, for providingtechnical assistance via CARICOM Secretariat in the form of training in the use/application of the Optical MarkReading (OMR) scanner/machine used (in <strong>Census</strong> <strong>2001</strong>) for data capture, and to the CSO of Belize itself for theloan of its OMR machine.The Ministry of Health, Sports, Carnival and Youth Affairs, Lauchland Lake, Permanent Secretary, former SeniorStatistician and Deputy <strong>Census</strong> Officer (National Statistics Office— Statistics Division, Ministry of Finance and theEconomy); coordinator par excellence of all census activities—preparatory phase, field and in-houseoperations/processes; was instrumental in the production and publication of the <strong>Antigua</strong> and <strong>Barbuda</strong> Preliminary<strong>Census</strong> <strong>Report</strong> <strong>2001</strong>;The members of the National <strong>Census</strong> Advisory Committee (NCAC): Franck Jacobs, Lauchland Lake, EtienLewis, Debora Barnes, Sheila Roseau, Maudlyn Christian, Phillip Harris, Dr. Ermina Osoba, PhilmoreMullin, Caril Sebastian, James Spencer, Sylvanie Matthew, Renée Phillips, Maurice E. Christian, HortensiaBrookes-Miguel, David Spencer, Doristeen Etinoff, Samuel James, Rosita Francis, Jocelyn Roberts,Oswald Thomas, Wendell Nicholas, Yolanda Goodwin.The members of the <strong>Census</strong> Coordinating Committee (CCC):Franck Jacobs, Lauchland Lake, Debora Barnes,Rohan Anthony, Joan Moses, Vera Morris, Patricia Thomas, Constance Gonsalves, Etien Lewis, YolandaGoodwin.Technical mapping assistance, Alvah Guishard of the DCA Division and Mrs. Claudette SolomonPrinting and Electronic Personnel, Original Printery.Liaison Officers, Trainers, Supervisors and Enumerators.AcknowledgmentsNational Statistics Office, <strong>Census</strong> <strong>2001</strong>.C-11
The staff of the NSO—Statistics Division of the Ministry of Finance and the Economy, Joan Moses, successorDeputy <strong>Census</strong> Officer and Senior Statistician; completed the coordination exercise.The <strong>Census</strong>es and Surveys Section of the NSO, Alphaeus Tonge, Statistical Clerk and key figure in the dataprocessing department; Constance Gonsalves, Key Punch Operator I, key figure in field work and in-houseoperations; Leegus Neale, Statistical Officer III for field work (mapping exercise and GIS application) and inhouseoperations; Marlon Carbon, Statistical Officer III, for field work—re: mapping exercise; Etien Lewis,Theoretical Mathematician and former Statistical Advisor to the Minister of Planning, for extensive in-house andfield activities;The External Trade Section of the NSO, Rohan Anthony, Statistical Officer I and IT Specialist, for in-housetechnical assistance in Integrated Microcomputer Processing System (IMPS) application, and editing of data;Desirée Perry, Statistical Officer II, for in-house and field operations (Supervisor of Enumerators); JasmineChristopher, Clerical Assistant; Sika Roberts, Clerical Assistant; Michelle Jarvis, Jr. Clerk; Conda George,Key-Punch Operator II; Carla Joseph, Clerical Assistant for editing and coding operations.The Information Systems Section of the NSO, Juan Gardner, Jr. Clerk; Karen Carr, Clerk for assistance in dataentry operations.The National Accounts and Balance of Payments Section of the NSO, Denise Nickeo, Statistical Officer II forexcellent field work (enumeration).Administration and General Services Section of the NSO, Patricia Christian Thomas, Senior Officer Manager forexquisite field work (Supervisor of Enumerators and Liaison Officer);Debra Barnes, Secretary III and Secretary tothe <strong>Census</strong> for exemplary performance; Vera Morris, Senior Executive Officer, for census accounting operations.The Human Resource Development Unit, Ministry of Planning, Avna Baronville, Human Resource Officer forassistance in editing and coding of questionnaires; Jacqueline Powell, Human Resource Officer.Manpower Training/Job Programme Office, Nickisha Jenkins, Jane-Ann Anthony and Nikki Reifer.The Ministry of Finance and the Economy, (formerly the Ministry of Planning, Implementation and Public ServiceAffairs), Charmaine Mason, Arica Wyre for assistance in editing and coding of questionnaires; YolandaGoodwin, Data Manager/Coordinator, for continual technical advice/assistance throughout all phases of thecensus; M.D. Vincent Benjamin, Permanent Secretary, for his keen interest and support throughout all phasesof the census.We are eternally grateful to all other persons, corporations, organizations not mentioned herein above, but whocontributed to the census exercise.AcknowledgmentsNational Statistics Office, <strong>Census</strong> <strong>2001</strong>.C-22
References1. <strong>Antigua</strong> & <strong>Barbuda</strong> 1991 Population Of Housing <strong>Census</strong>.2. <strong>Antigua</strong> & <strong>Barbuda</strong> Preliminary <strong>Census</strong> <strong>Report</strong> <strong>2001</strong>.3. Phillip Bevington , et al, Data Reduction and Error Analysis for the Physical Sciences, Paperback,2003.4. P.V. Bork, H. Grote, D.Notz, M. Regler, Data Analysis Techniques in High Energy PhysicsExperiments, Cambridge University Press, 1993.5. John E. Hunter, Frank L. Schmidt, Methods of Meta-Analysis: Correcting Error and Bias in ResearchFindings, Paperback - April 7, 2004.6. William Lichten, Data and Error Analysis (second edition), Paperback - October 13, 1998.7.John R. Taylor, An Introduction to Error Analysis: The Study of Uncertainties in PhysicalMeasurements, University Science Books, 1982.8. U.S. <strong>Census</strong> Bureau, 2000 <strong>Census</strong> of Population and Housing: <strong>Summary</strong> Social, Economic,andHousing Characteristics,PHC-2-1, United States <strong>Summary</strong>, Washington, DC, 2003.ReferencesNational Statistics Office, <strong>Census</strong> <strong>2001</strong> R-1