An Introduction to qRT-PCR Assays Using Sybr Green (Using SDS ...
An Introduction to qRT-PCR Assays Using Sybr Green (Using SDS ...
An Introduction to qRT-PCR Assays Using Sybr Green (Using SDS ...

You also want an ePaper? Increase the reach of your titles
YUMPU automatically turns print PDFs into web optimized ePapers that Google loves.
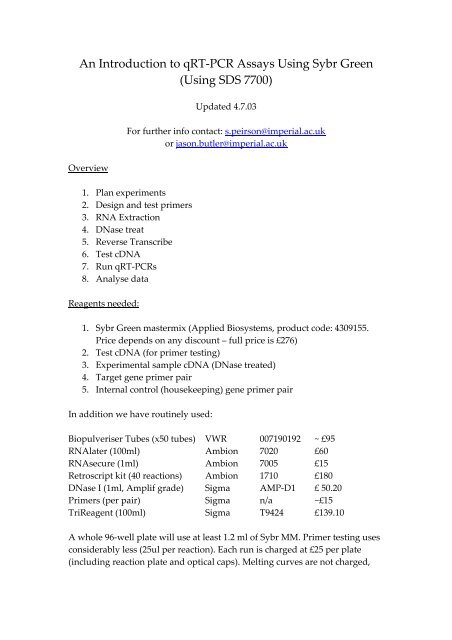
<strong>An</strong> <strong>Introduction</strong> <strong>to</strong> <strong>qRT</strong>-<strong>PCR</strong> <strong>Assays</strong> <strong>Using</strong> <strong>Sybr</strong> <strong>Green</strong>(<strong>Using</strong> <strong>SDS</strong> 7700)OverviewUpdated 4.7.03For further info contact: s.peirson@imperial.ac.ukor jason.butler@imperial.ac.uk1. Plan experiments2. Design and test primers3. RNA Extraction4. DNase treat5. Reverse Transcribe6. Test cDNA7. Run <strong>qRT</strong>-<strong>PCR</strong>s8. <strong>An</strong>alyse dataReagents needed:1. <strong>Sybr</strong> <strong>Green</strong> mastermix (Applied Biosystems, product code: 4309155.Price depends on any discount – full price is £276)2. Test cDNA (for primer testing)3. Experimental sample cDNA (DNase treated)4. Target gene primer pair5. Internal control (housekeeping) gene primer pairIn addition we have routinely used:Biopulveriser Tubes (x50 tubes) VWR 007190192 ~ £95RNAlater (100ml) Ambion 7020 £60RNAsecure (1ml) Ambion 7005 £15Retroscript kit (40 reactions) Ambion 1710 £180DNase I (1ml, Amplif grade) Sigma AMP-D1 £ 50.20Primers (per pair) Sigma n/a ~£15TriReagent (100ml) Sigma T9424 £139.10A whole 96-well plate will use at least 1.2 ml of <strong>Sybr</strong> MM. Primer testing usesconsiderably less (25ul per reaction). Each run is charged at £25 per plate(including reaction plate and optical caps). Melting curves are not charged,
and can be fitted in when the machine is not in use. This charge is <strong>to</strong> cover thecost of the annual service contract for the machine.1. Plan ExperimentsBefore conducting the assay decide on the form of the experiment and howdata is <strong>to</strong> be analysed. This is an important aspect of the procedure, as it willaffect the conclusions that it is possible <strong>to</strong> draw from the results of the assay.The main considerations are:• Will expression be presented as relative expression or copies?• How many and which internal controls will be used?• Are quality controls necessary?a) Relative Expression vs Copy NumbersIn most cases biological experiments include a set of control samples, andthese may be used as a reference point for relative quantification. This ismost reliable when the comparison is being made of equivalent samples. Thatis, similar tissue/cell type with a relatively discrete biological stimulus.If the data is <strong>to</strong> be presented as a change relative <strong>to</strong> a control (eg:untreated or wildtype sample), then relative expression is an ideal approach.Setting up an assay for relative quantification is simplified as the assay revertsbe essentially being a normal <strong>PCR</strong> (albeit on a larger scale). The whole assayconsists of measuring target gene and internal control gene expression in bothcontrol and experimental samples, and the only additional samples requiredare no template controls (NTCs) <strong>to</strong> ensure that no contamination is present.Much of the early literature on <strong>qRT</strong>-<strong>PCR</strong> revolves arounddetermination of copy numbers of a transcript, also termed absolutequantification. However, an increasing number of studies have started <strong>to</strong>consider the relevance of copy numbers <strong>to</strong> biological questions. Approaches<strong>to</strong> this problem range from the simple assumption that product will doubleevery cycle, <strong>to</strong> the use of plasmid or cDNA standard curves <strong>to</strong> deriveefficiency, or more complicated calculations of efficiency from amplificationkinetics (see ‘Data <strong>An</strong>alysis’ below).One of the main problems with copy numbers is that the preparationand maintenance of exact concentrations of nucleic acids is technicallychallenging. Despite its widespread use spectropho<strong>to</strong>metry is not an exactmethod for quantification, and furthermore, long-term s<strong>to</strong>rage of nucleicacids at low concentrations without any degradation is not as straightforwardas it may initially seem. Additionally, due <strong>to</strong> the exponential nature ofamplification that occurs in <strong>PCR</strong>, slight differences in amplification rates can
esult in dramatic differences in results. A 5% difference in <strong>PCR</strong> efficiency canresult in almost a twofold difference in expression after 25 cycles. If standardsamples and experimental samples do not exhibit comparable kinetics, thenequating cDNA samples with copy numbers determined from standards ismisleading. This is particularly true when comparing experimental cDNAsamples against purified nucleic acid preparations (eg: <strong>PCR</strong> product orplasmid preparations).As differences in RNA concentration, RNA quality and reversetranscription efficiency will also inevitably occur, an internal control istypically used <strong>to</strong> act as an RNA loading control (see below). As such, targetgene expression is normalised <strong>to</strong> internal control gene expression, and thisresults in a ratio of target gene <strong>to</strong> internal control, which is independent ofcopy number. For example, partial RNA degradation or poor RT efficiencywill both result in a reduced copy number, but will also result in acomparable decrease in internal control gene expression. As such, theexpression ratio of target <strong>to</strong> internal control will be the same.Are copy numbers essential within the context of your assay? In someassays, copy number may be meaningful, but in many cases it is not. <strong>An</strong>otherway of thinking about this is does a measurement of the number of copies perug of RNA tell you anything more about the sample? For example, in thecontext of viral loading, copies per ug of RNA is obviously important, but inthe context of expression of an inflamma<strong>to</strong>ry marker in the brain followinginjury copies per ug of tissue is not especially meaningful – what is of interestis whether the expression of the marker changes following injury.As such, if copy numbers are really required then they may becalculated from molar concentration based upon the molecular weight of theamplicon and Avagadro’s constant. However, as well as constructing anaccurate standard curve, it must be confirmed that standards and cDNAexperimental samples amplify comparably. Finally, it should be realised thatcopy number calculations are not absolute in the q<strong>PCR</strong> context - they are ofcourse only relative <strong>to</strong> the standard used, and thus depend upon how suitablethis standard is.b) Internal Controls (Housekeeping Genes)A recurring question when dealing with quantification of geneexpression is “what is the most suitable internal control?” This questionreflects both a commendable desire <strong>to</strong> accurately control gene expressionassays, but also highlights a desire <strong>to</strong> oversimplify this difficult issue. Firstly,there is no such thing as an ideal internal control. Whilst numerous internalcontrols are available, none is ideal for every scenario, and all haveadvantages and drawbacks.Internal controls function as a loading control <strong>to</strong> ensure thatcomparable amounts of RNA are being measured in each case. However, how
can one be certain that an internal control is not also affected by theexperimental treatment?The most reliable approach <strong>to</strong> this issue is the use of multiple internalcontrols, which allows comparisons between controls as described byVandesompele (2002). This approach requires the use of several internalcontrols, and provides a method of calculating how stable any internal controlis based upon comparison with other internal controls. By then using thegeometric mean, outlier effects are reduced. The primary advantage of thisapproach is the confidence that this provides in the whole normalisationprocess. A secondary advantage is that accurate normalisation helps reduceassay variance (ie: makes it easier <strong>to</strong> see real differences).A frequently overlooked aspect of gene expression analysis is thewidespread assumption that internal controls will be expressed at the samelevel in different cell types. This is dependent upon the internal control geneexpression accurately reflecting the RNA content of the sample. However, ifdifferent samples contain different cell densities, different cell sizes, ordifferent cell subpopulations (heterogeneity), this may affect the accuracy ofthe comparisons.For example, when comparing the expression of a target gene in thesame volume of RNA extracted from liver and heart, normalisation assumesthat the internal control is expressed similarly in liver and heart. This may notbe the case, and if the gene chosen as an internal control is actually morehighly expressed in the liver, then the normalised expression will as such belower in the liver when compared with the heart.As such, it is recommended that a similar amount of RNA is used foreach reverse transcription reaction (we typically aim for 1 ug RNA), as theinternal control data should therefore be comparable. If this is not the case, itsuggests either differences in RNA quality or RT efficiency, or alternatively, ifdifferent tissues are being analysed, differences in internal control expressionmay occur. Also, it is worth recording the mass of tissue used, the RNA yieldsand the proportion of this that is subsequently used – quantify as much aspossible!c) Quality controlsIf your experimental sample group will all fit on a single plate, then interassaydifferences will not present any problem.However, ongoing assays present a different situation, and necessitatethe use of a quality control – a control sample that is run on every plate,which provides a reference point by which samples from different assays canbe compared. Quality controls may take the form of a standard curve orcDNA samples that are included on every plate, and ideally should bealiquotted prior <strong>to</strong> use and not freeze-thawed.
One approach is <strong>to</strong> include the untreated control group on everyexperimental treatment plate, <strong>to</strong> allow the analysis of experimental effects <strong>to</strong>be made with confidence.2) Primer DesignPrimers should be around 20-30 nucleotides long, and have an annealingtemperature of 58-60°C. Product size is not such an issue with <strong>Sybr</strong> as withTaqMan, and slightly larger products may be advantageous. Products largerthan 100 bp possess a higher melting temperature, and are thus easier <strong>to</strong>separate from any primer-dimer artefacts. Secondly, as <strong>Sybr</strong> green is a DNAbindingdye, larger products will bind more dye and fluoresce more,improving the assay sensitivity. We have found 100-300 bp products workwell, and have used products up <strong>to</strong> 500 bp with no reduction in amplificationrate.Where possible, primers should be designed <strong>to</strong> span one or moreintrons, <strong>to</strong> prevent amplification of genomic DNA (or at least allowdiscrimination between cDNA and gDNA products). Runs of three or more Gand Cs at the 3’ end should be avoided where possible <strong>to</strong> prevent extension ofmisprimes, and checking primers for complementarity or formation ofprimer-dimers is recommended.Primer TestingPrimers should be tested using <strong>Sybr</strong> green MM, rather than using normal Taq.As the <strong>Sybr</strong> MM uses a modified Taq enzyme and contains all the reactioncomponents premixed, little optimisation is possible. As such, primers thatwork well with other kits may not work necessarily work with the <strong>Sybr</strong> MMand vice versa. As such, time is best spent checking primers with the reactionmix which is going <strong>to</strong> be used for the assay, and the volumes that are usedcompared <strong>to</strong> a whole 96-well plate is minimal.Primers can be tested on any representative cDNA, and you do notneed <strong>to</strong> waste valuable experimental samples testing primers.The following reaction should enable analysis of primers:ul<strong>Sybr</strong> <strong>Green</strong> MM 25 x 1Primers (25uM s<strong>to</strong>ck): F 1 0.5 uMR 1 0.5 uMH20 22cDNA 1FINAL 50 ul
Reaction conditions:Initial step:Taq activation95°C 10 minutes40 cycles of:Denaturation<strong>An</strong>nealing/Extension95°C 15 seconds60°C 60 secondsConfirmation of Product SpecificityAs primers alone determine the specificity of the assay, it is essential <strong>to</strong> confirm thatthe correct product is amplifiedThis can be accomplished in three ways: by gel electrophoresis, sequencing <strong>to</strong>confirm product identity and melting curve analysis.1. Gel electrophoresis – run 10-15 ul of sample on agarose gel2. Sequence – cut band from gel, and direct sequence3. Melting Curve – using 25 ul of <strong>PCR</strong> product on <strong>SDS</strong> 7700 (takesapproximately 20 mins). Ramp temperature from 60 <strong>to</strong> 95°C and recordfluorescence. When this is plotted in ‘Dissociation Curve’ software asrate of change, this will highlight the melting temperature of thedouble-stranded product, and will indicate the presence of any primerdimers.Use a temperature just below the product melting peak forrecording fluorescence during real-time <strong>PCR</strong> run.Do not use primers for q<strong>PCR</strong> if you doubt their specificity!3. Extract RNACollect samples for analysis and either snap freeze or s<strong>to</strong>re in RNApreservation medium such as RNAlater (Ambion). We have used the latter forsome time and found it <strong>to</strong> work well.Extract RNA according <strong>to</strong> desired pro<strong>to</strong>col – we typically useTriReagent from Sigma-Genosys <strong>to</strong> isolate <strong>to</strong>tal RNA. Either <strong>to</strong>tal RNA ormRNA may be used. We have found that homogenising using a Fast-Prephomogeniser system combined with a half volume Tri-Reagent extractiongives good yields – routinely around 4-6 ug of <strong>to</strong>tal RNA from paired retina,and up <strong>to</strong> nearly 20ug from paired eyes. We usually resuspend pelleted RNAin around 20 ul of RNase-free water, either DEPC or RNASecure treated (thelater is simply added <strong>to</strong> water and activated by heating <strong>to</strong> 60°C).
If using spectropho<strong>to</strong>metry <strong>to</strong> quantitate RNA, should have anOD260:OD280 ratio around the 1.8 – 2.0 range. Also note that thisspectropho<strong>to</strong>metry of nucleic acids is most reliable over a range from 5 – 90ug/mL.4. DNase TreatAll samples should be DNase I treated <strong>to</strong> ensure any genomic DNA isremoved prior <strong>to</strong> reverse transcribing. We normally use Sigma DNase I, using2ul of DNase <strong>to</strong> treat 1ug <strong>to</strong>tal RNA, incubating at 37°C for 30 minutes. Bewarned – many commercially available DNase pro<strong>to</strong>cols are quiteconservative – in many cases addition of extra DNase and additionalincubation time may be necessary.5. Reverse TranscribeReverse transcribe samples according <strong>to</strong> manufacturer’s instructions.Ifintending <strong>to</strong> use ribosomal RNAs as controls, must will need <strong>to</strong> use randomprimers (rRNAs are not poly-A tailed). If using mRNA, can use oligo-dT –however, remember <strong>to</strong> DNase treat still – mRNA extraction may still retainsome genomic DNA.6. Test cDNAOnce synthesised cDNA should be tested prior <strong>to</strong> use in a q<strong>PCR</strong> assay <strong>to</strong>ensure that amplification quality cDNA is present. This is preferably doneusing a primer pair that spans an intron <strong>to</strong> ensure that no genomic DNA ispresent. <strong>An</strong> internal control is ideal, as it will be present in all tissues andshould give a strong band on a gel.7. Assay SetupUp <strong>to</strong> 32 individual samples can be run on each 96 well plate as each sampleis run in triplicate <strong>to</strong> allow intra-assay variation <strong>to</strong> be calculated. A slightexcess is also recommended <strong>to</strong> account for the small volumes lost duringpipetting.In setting up an assay, we initially prepare an overall master-mix(OMM) for all samples in which a certain transcript is <strong>to</strong> be amplified (eg:target gene). This OMM is then subdivided in<strong>to</strong> smaller triplicate mastermixes(TMM), each enough for 3 reactions. The template cDNA is added <strong>to</strong>each TMM, which is then mixed and added <strong>to</strong> the reaction plate. This ensures
that triplicates contain exactly the same reaction components – anydifferences between them are due <strong>to</strong> technical fac<strong>to</strong>rs and assay noise,allowing a measure of intra-assay variation <strong>to</strong> be calculated.8. Data <strong>An</strong>alysisThere are a number of approaches <strong>to</strong> data analysis, many requiring the use ofadditional ‘known’ samples in the form of a standard curve.In brief:2 - ∆∆ CTmethodThis is based upon an assumption of perfect doubling of <strong>PCR</strong> product percycle and will give a reasonable estimate of expression. <strong>An</strong> R0 value can besimply calculated for each sample:R0 = Threshold value x (2 -CT value )Eg: if threshold is 0.13 and a sample has a CT value of 21.65, then the R0 valuewill be 0.13 x (2^-21.65) = 3.95 x 10 -8 . The R0 values for target gene samples arethen divided by internal control gene R0 values, <strong>to</strong> give a gene expressionratio for each sample. The mean and standard deviation may then beexpressed relative <strong>to</strong> the mean of the experimental control group.Efficiency from Standard CurvesThe use of serial dilutions of cDNA (usually tenfold) can be used <strong>to</strong> moreaccurately determine efficiency for each primer set. This can also be done forcopy number standard curves, and using this efficiency the actual fold changeand variance achieved is mathematically identical <strong>to</strong> that produced fromusing copy numbers (see Peirson et al., 2003).Plot the CT of standards (y-axis) against log copy number or cDNAconcentration (will be negative for dilutions – eg: 100 fold dilution of cDNAgives concentration of 0.01, or –2 log units). Fit a linear regression trend-line<strong>to</strong> give the slope and fit. The correlation coefficient should be greater than0.95 <strong>to</strong> ensure accurate standards.The slope of the standard curve can be used <strong>to</strong> calculate efficiency:Applied efficiency = 10 (-1/slope)So a perfect amplifcation rate of 2 will have a standard curve slope of –3.32.Note: in many publications efficiency is referred <strong>to</strong> as a reaction rate, and isthus on a scale of 0 (no reaction) <strong>to</strong> 1 (maximum reaction). <strong>Using</strong> applied
efficiency will give a scale of 1 (no change in product per cycle) <strong>to</strong> 2 (perfectdoubling). The two are interchangeable – simply add or subtract 1.Kinetic ApproachesRather than use artificial standards, amplification efficiency can bedetermined from the kinetics of the amplification plots produced by everysample. As such, the efficiency of every sample may be determined with noadditional samples required.We have au<strong>to</strong>mated this procedure in a freely-available Excelworkbook named DART-<strong>PCR</strong>, and found it <strong>to</strong> give comparable data <strong>to</strong>existing methods. <strong>An</strong> example data set described in the paper is also available(Peirson et al., 2003). Basically, this workbook performs all the necessarycalculations – those interested are directed <strong>to</strong> the paper for a furtherexplanation!