- Page 1:
Demographicand Health Survey1993-19
- Page 4 and 5:
This report summarizes the findings
- Page 6 and 7:
4.7 Reasons for Selecting Family Pl
- Page 9 and 10: TABLESPageTable 1.1Table 2.1Table 2
- Page 11 and 12: PageTable 5.5Table 5.6Table 5.7Tabl
- Page 13 and 14: FIGURESPageFigure2.1Hguro2.2~gure2.
- Page 15: Secretary,Ministry of Health & Fami
- Page 19: 1993-94 BDHS TECHNICAL REVIEW COMMI
- Page 23 and 24: SUMMARY OF FINDINGSThe 1993-94 Bang
- Page 25 and 26: almost universal in Bangladesh for
- Page 27 and 28: fully vaccinated, a vast improvemen
- Page 29 and 30: CHAPTER 1INTRODUCTION1.1 Geography
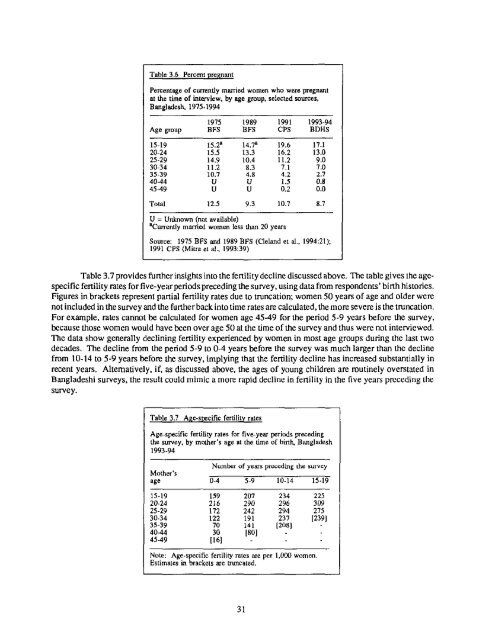
- Page 31 and 32: Fertility in Bangladesh is declinin
- Page 33 and 34: Factors for Program SuccessNumerous
- Page 35 and 36: Foundation, the Bangladesh Bureau o
- Page 37 and 38: CHAPTER 2CHARACTERISTICS OF HOUSEHO
- Page 39 and 40: Figure 2.2Distribution of De Facto
- Page 41 and 42: EducationEducation is a key determi
- Page 43 and 44: with no education and more men than
- Page 45 and 46: The majority (69 percent) of househ
- Page 47 and 48: ~l'able 2.9 Background characterist
- Page 49: Access to MediaWomen were asked if
- Page 52 and 53: for the whole country is 29 births
- Page 54 and 55: Table 3.2 Fertility by background c
- Page 56 and 57: Births per 1,000 Women3oo250 s ~Fig
- Page 61 and 62: Table 3.9 Children ever born and li
- Page 63 and 64: The data show that birth intervals
- Page 65 and 66: Table 3.14 shows the percentage of
- Page 67 and 68: CHAPTER 4FERTILITY REGULATION4.1 Kn
- Page 69 and 70: Table 4.3 Differentials in knowledg
- Page 71 and 72: Ever-use rates vary with the age of
- Page 73 and 74: Table 4.7 Trends in current use of
- Page 75 and 76: Table 4.8 Current use of fJ~,nily p
- Page 77 and 78: Table 4.9 Trends in current use of
- Page 79 and 80: Overall, 41 percent of respondents
- Page 81 and 82: Use of Social Marketing BrandsBangl
- Page 83 and 84: Table 4.16 Quality of pill usePerce
- Page 85 and 86: Table 4.19 Use of condom brandsPerc
- Page 87 and 88: Table4.21 StedlizationregretPercent
- Page 89 and 90: The source a woman uses to obtain c
- Page 91 and 92: Table 4.24 Reasons for discontinuat
- Page 93 and 94: Table 4.26 Reasons for not using co
- Page 95 and 96: Respondents were further asked whet
- Page 97 and 98: Table 4.30 Contact with family plan
- Page 99 and 100: CHAPTER 5OTHER PROXIMATE DETERMINAN
- Page 101 and 102: Figure 5.1Trends in Proportion of W
- Page 103 and 104: Table 5.4 Age at furst marriagePerc
- Page 105 and 106: Table 5.6 indicates that a large ma
- Page 107: 5.7 Termination of Exposure to Preg
- Page 110 and 111:
Table 6.1 Fertility preferences by
- Page 112 and 113:
Table 6.2 Fertility preferences by
- Page 114 and 115:
6.2 Need for Family Planning Servic
- Page 116 and 117:
Table 6.5 Ideal and actual number o
- Page 118 and 119:
Table 6.7 Fertility planning status
- Page 120 and 121:
Table 7.1 Infant and child mortalit
- Page 122 and 123:
Matlab area of Bangladesh. Infant m
- Page 124 and 125:
Table 7.4 Infant and child mortalit
- Page 126 and 127:
Column 3 of Table 7.5 shows the pro
- Page 128 and 129:
Table 8.1 Antenatal carePercent dis
- Page 130 and 131:
Pregnant women who seek antenatal c
- Page 132 and 133:
Table 8.4 Place of deliveryPercent
- Page 134 and 135:
5 percent were assisted by doctors,
- Page 136 and 137:
59 percent of children 12-23 months
- Page 138 and 139:
Trends in Vaccination CoverageA gen
- Page 140 and 141:
Overall, just over one-quarter (28
- Page 142 and 143:
Figure 8.4Percentage of Children un
- Page 144 and 145:
Prevalence of BreastfeedlngTable 8.
- Page 146 and 147:
The results shown in Table 8.13 ind
- Page 148 and 149:
The median duration of breastfeedin
- Page 150 and 151:
Table 9.2 Age differences between s
- Page 152 and 153:
When data on current contraceptive
- Page 154 and 155:
The data indicate that when husband
- Page 156 and 157:
There is a high degree of agreement
- Page 158 and 159:
Table 10.1 Distance to public servi
- Page 160 and 161:
All but a tiny fraction of family p
- Page 162 and 163:
MarriageA review of the role of the
- Page 164 and 165:
Unmet Need for Family PlanningThe f
- Page 166 and 167:
Family Planning Outreach/Satellite
- Page 168 and 169:
should be organized on a priority b
- Page 171 and 172:
REFERENCESArnold, Fred. 1990. Asses
- Page 173:
APPENDIX ASAMPLE IMPLEMENTATION
- Page 177:
APPENDIX BESTIMATES OF SAMPLING ERR
- Page 180 and 181:
The Jacknife repeated replication m
- Page 182 and 183:
Table B.2 Sampling errors - Nationa
- Page 184 and 185:
Table B.4 Sampling errors - Rural s
- Page 186 and 187:
Table B.6 Sampling errors - Chittag
- Page 188 and 189:
Table B.8 Sampling errors - Khuhaa,
- Page 191:
APPENDIX CDATA QUALITY
- Page 194 and 195:
Table C.1 Household age distributio
- Page 196 and 197:
C.2 FertilityThe low level of ferti
- Page 198 and 199:
Figure C.1Births by Calendar Year,
- Page 200 and 201:
This cursory inspection of the qual
- Page 203:
APPENDIX DQUESTIONNAIRES
- Page 206 and 207:
HOUSEHOLD SCHEDULENow we uoutd like
- Page 208 and 209:
NO.GUESTIONS AND FILTERS19 What is
- Page 210 and 211:
182
- Page 212 and 213:
SECTION 1.RESPONDEHTBS BACKGROUNDSK
- Page 214 and 215:
NO.QUESTIONS AND FILTERSCOOING CATE
- Page 216 and 217:
211 Now I would like to talk to you
- Page 218 and 219:
221CONPARE 208 WITH NIJI4BER OF BIR
- Page 220 and 221:
SECTION 3:COBTRACEPTION301 I No~ (
- Page 222 and 223:
NO.315 QhJch method are you using?3
- Page 224 and 225:
NO.J320B IQUESTIONS AND FILTERSSHOW
- Page 226 and 227:
NO.QUESTIONS AND FILTERSCODING CATE
- Page 228 and 229:
331 I would like to ask some questi
- Page 230 and 231:
SECTION 4A.PREGNANCY AND BREASTFEED
- Page 232 and 233:
430 Are you still braastfeedingCNAM
- Page 234 and 235:
442H442I442JAmong the I~rsons with
- Page 236 and 237:
BANELA~ BIRYHNEXT-TO'LAST BIRTHNAME
- Page 238 and 239:
RO. J501 JOUESTIORS AND FILTERSSECT
- Page 240 and 241:
NO.QUESTIONS AND FILTERSCOOING CATE
- Page 242 and 243:
SECTION 7.HUSBAND'S BACKGROUND, RES
- Page 244 and 245:
INTERVIEWER'S OBSERVATIONS(To be fi
- Page 246 and 247:
218
- Page 248 and 249:
SECTION 1.RESPONGENT'S BACKGROUND10
- Page 250 and 251:
~[CT|ON 2.REPROOUCTIOMNo. I 043ESTI
- Page 252 and 253:
SKIPRo. I QUESTIONS AND FILTERS I C
- Page 254 and 255:
NO. IQUESTIONS AND FILTERSCODING CA
- Page 256 and 257:
NO.QUESTIONS AND FILTERSCOOING CATE
- Page 258 and 259:
NO,502CHECK ]15:SECTION 5.FERTILITY
- Page 260 and 261:
INTERVIEWER'S OBSERVATIONS(To be fi
- Page 262 and 263:
i. GENERAL DESCRIPTIONNO.OUESTIONS
- Page 264 and 265:
HO.QUEST lOllSL19 t~hat services do
- Page 266 and 267:
NO.QUESTIONS CCOING CATEGORIES SKIP
- Page 268:
iO.9QUESTIONS COOING CATEGORIES SXI


![Obtaining Informed Consent for HIV Testing [QRS4] - Measure DHS](https://img.yumpu.com/49850117/1/190x245/obtaining-informed-consent-for-hiv-testing-qrs4-measure-dhs.jpg?quality=85)


