Bangladesh 1993-1994 Demographic and Health ... - Measure DHS
Bangladesh 1993-1994 Demographic and Health ... - Measure DHS
Bangladesh 1993-1994 Demographic and Health ... - Measure DHS
- No tags were found...
Create successful ePaper yourself
Turn your PDF publications into a flip-book with our unique Google optimized e-Paper software.
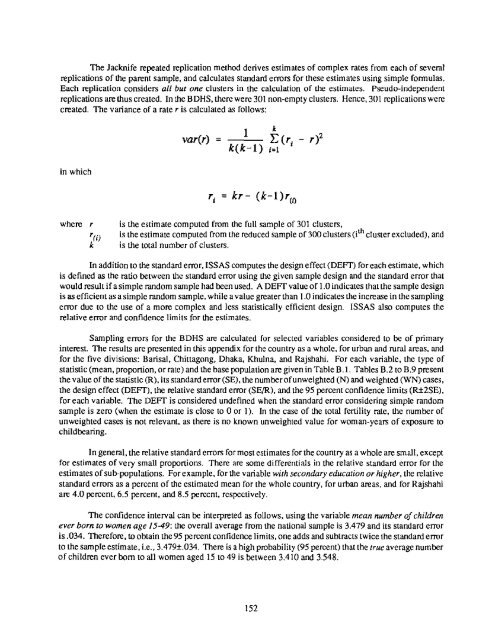
The Jacknife repeated replication method derives estimates of complex rates from each of severalreplications of the parent sample, <strong>and</strong> calculates st<strong>and</strong>ard errors for these estimates using simple formulas.Each replication considers all but one clusters in the calculation of the estimates. Pseudo-independentreplications are thus created. In the B<strong>DHS</strong>, there were 301 non-empty clusters. Hence, 301 replications werecreated. The variance of a rate r is calculated as follows:in whichr I -- kr-kC -lk(k-1)r¢0where ris the estimate computed from the full sample of 301 clusters,is the estimate computed from the reduced sample of 300 clusters (i th cluster excluded), <strong>and</strong>is the total number of clusters.In addition to the st<strong>and</strong>ard error, ISSAS computes the design effect (DEFT) for each estimate, whichis defined as the ratio between the st<strong>and</strong>ard error using the given sample design <strong>and</strong> the st<strong>and</strong>ard error thatwould result if a simple r<strong>and</strong>om sample had been used. A DEFT value of 1.0 indicates that the sample designis as efficient as a simple r<strong>and</strong>om sample, while a value greater than 1.0 indicates the increase in the samplingerror due to the use of a more complex <strong>and</strong> less statistically efficient design. ISSAS also computes therelative error <strong>and</strong> confidence limits for the estimates.Sampling errors for the B<strong>DHS</strong> are calculated for selected variables considered to be of primaryinterest. The results are presented in this appendix for the country as a whole, for urban <strong>and</strong> rural areas, <strong>and</strong>for the five divisions: Barisal, Chittagong, Dhaka, Khulna, <strong>and</strong> Rajshahi. For each variable, the type ofstatistic (mean, proportion, or rate) <strong>and</strong> the base population are given in Table B.1. Tables B.2 to B.9 presentthe value of the statistic (R), its st<strong>and</strong>ard error (SE), the number of unweighted (N) <strong>and</strong> weighted (WN) cases,the design effect (DEFT), the relative st<strong>and</strong>ard error (SE/R), <strong>and</strong> the 95 percent confidence limits (R.-1:2SE),for each variable. The DEFT is considered undefined when the st<strong>and</strong>ard error considering simple r<strong>and</strong>omsample is zero (when the estimate is close to 0 or 1). In the case of the total fertility rote, the number ofunweighted cases is not relevant, as there is no known unweighted value fur woman-years of exposure tochildbearing.In general, the relative st<strong>and</strong>ard errors for most estimates for the country as a whole are small, exceptfor estimates of very small proportions. There are some differentials in the relative st<strong>and</strong>ard error for theestimates of sub-populations. For example, forthe variable with secondary education or higher, the relativest<strong>and</strong>ard errors as a percent of the estimated mean for the whole country, for urban areas, <strong>and</strong> for Rajshahiare 4.0 percent, 6.5 percent, <strong>and</strong> 8.5 percent, respectively.The confidence interval can be interpreted as follows, using the variable mean number of childrenever born to women age 15-49: the overall average from the national sample is 3.479 <strong>and</strong> its st<strong>and</strong>ard erroris .034. Therefore, to obtain the 95 percent confidence limits, one adds <strong>and</strong> subtracts twice the st<strong>and</strong>ard errorto the sample estimate, i.e., 3.479+.034. There is a high probability (95 percent) that the true average numberof children ever bum to all women aged 15 to 49 is between 3.410 <strong>and</strong> 3.548.152


![Obtaining Informed Consent for HIV Testing [QRS4] - Measure DHS](https://img.yumpu.com/49850117/1/190x245/obtaining-informed-consent-for-hiv-testing-qrs4-measure-dhs.jpg?quality=85)


