Acute services - State of Illinois
Acute services - State of Illinois Acute services - State of Illinois
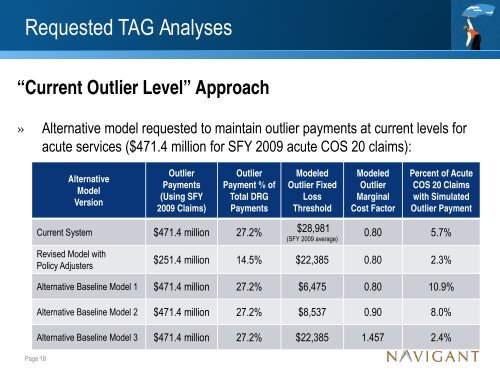
Requested TAG Analyses“Current Outlier Level” Approach» Alternative model requested to maintain outlier payments at current levels foracute services ($471.4 million for SFY 2009 acute COS 20 claims):AlternativeModelVersionOutlierPayments(Using SFY2009 Claims)OutlierPayment % ofTotal DRGPaymentsModeledOutlier FixedLossThresholdModeledOutlierMarginalCost FactorPercent of AcuteCOS 20 Claimswith SimulatedOutlier PaymentCurrent System $471.4 million 27.2% $28,981(SFY 2009 average)Revised Model withPolicy Adjusters0.80 5.7%$251.4 million 14.5% $22,385 0.80 2.3%Alternative Baseline Model 1 $471.4 million 27.2% $6,475 0.80 10.9%Alternative Baseline Model 2 $471.4 million 27.2% $8,537 0.90 8.0%Alternative Baseline Model 3 $471.4 million 27.2% $22,385 1.457 2.4%Page 18
Requested TAG AnalysesTransplant Service Evaluation» Current inpatient methodology pays 60% of charges for transplants(except for kidneys, which are paid under DRGs)» Policy Adjuster Model using SFY 2009 data simulates a per dischargeDRG payment plus outlier for transfer cases› 27.1% modeled pay-to-charge ratio for transplants (using inflatedcharges) under new system compared to 21.8% for acute servicesoverallPage 19
- Page 1 and 2: Illinois Department of Healthcarean
- Page 3 and 4: Revised Inpatient Model withPolicy
- Page 5 and 6: Revised Inpatient Model With Policy
- Page 7 and 8: Revised Inpatient Model With Policy
- Page 9 and 10: Revised Inpatient Model With Policy
- Page 11 and 12: Revised Inpatient Model With Policy
- Page 13 and 14: Shadow Pricing ModelsShadow Pricing
- Page 15 and 16: Shadow Pricing ModelsShadow Pricing
- Page 17: Requested TAG AnalysesRequested ana
- Page 21 and 22: Requested TAG AnalysesCapital Cost
- Page 23 and 24: Alternative Inpatient Model Update
- Page 25 and 26: Transitional CorridorPage 25Example
Requested TAG Analyses“Current Outlier Level” Approach» Alternative model requested to maintain outlier payments at current levels foracute <strong>services</strong> ($471.4 million for SFY 2009 acute COS 20 claims):AlternativeModelVersionOutlierPayments(Using SFY2009 Claims)OutlierPayment % <strong>of</strong>Total DRGPaymentsModeledOutlier FixedLossThresholdModeledOutlierMarginalCost FactorPercent <strong>of</strong> <strong>Acute</strong>COS 20 Claimswith SimulatedOutlier PaymentCurrent System $471.4 million 27.2% $28,981(SFY 2009 average)Revised Model withPolicy Adjusters0.80 5.7%$251.4 million 14.5% $22,385 0.80 2.3%Alternative Baseline Model 1 $471.4 million 27.2% $6,475 0.80 10.9%Alternative Baseline Model 2 $471.4 million 27.2% $8,537 0.90 8.0%Alternative Baseline Model 3 $471.4 million 27.2% $22,385 1.457 2.4%Page 18


