TOOL E3 Measurement and assessment of overweight and obesity ...
TOOL E3 Measurement and assessment of overweight and obesity ...
TOOL E3 Measurement and assessment of overweight and obesity ...

Create successful ePaper yourself
Turn your PDF publications into a flip-book with our unique Google optimized e-Paper software.
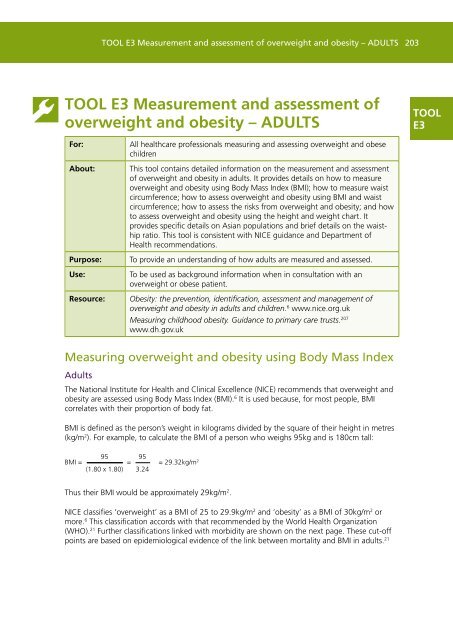
<strong>TOOL</strong> <strong>E3</strong> <strong>Measurement</strong> <strong>and</strong> <strong>assessment</strong> <strong>of</strong> <strong>overweight</strong> <strong>and</strong> <strong>obesity</strong> – ADULTS 203<strong>TOOL</strong> <strong>E3</strong> <strong>Measurement</strong> <strong>and</strong> <strong>assessment</strong> <strong>of</strong><strong>overweight</strong> <strong>and</strong> <strong>obesity</strong> – ADULTS<strong>TOOL</strong><strong>E3</strong>For:About:Purpose:Use:Resource:All healthcare pr<strong>of</strong>essionals measuring <strong>and</strong> assessing <strong>overweight</strong> <strong>and</strong> obesechildrenThis tool contains detailed information on the measurement <strong>and</strong> <strong>assessment</strong><strong>of</strong> <strong>overweight</strong> <strong>and</strong> <strong>obesity</strong> in adults. It provides details on how to measure<strong>overweight</strong> <strong>and</strong> <strong>obesity</strong> using Body Mass Index (BMI); how to measure waistcircumference; how to assess <strong>overweight</strong> <strong>and</strong> <strong>obesity</strong> using BMI <strong>and</strong> waistcircumference; how to assess the risks from <strong>overweight</strong> <strong>and</strong> <strong>obesity</strong>; <strong>and</strong> howto assess <strong>overweight</strong> <strong>and</strong> <strong>obesity</strong> using the height <strong>and</strong> weight chart. Itprovides specific details on Asian populations <strong>and</strong> brief details on the waisthipratio. This tool is consistent with NICE guidance <strong>and</strong> Department <strong>of</strong>Health recommendations.To provide an underst<strong>and</strong>ing <strong>of</strong> how adults are measured <strong>and</strong> assessed.To be used as background information when in consultation with an<strong>overweight</strong> or obese patient.Obesity: the prevention, identification, <strong>assessment</strong> <strong>and</strong> management <strong>of</strong><strong>overweight</strong> <strong>and</strong> <strong>obesity</strong> in adults <strong>and</strong> children. 6 www.nice.org.ukMeasuring childhood <strong>obesity</strong>. Guidance to primary care trusts. 207www.dh.gov.ukMeasuring <strong>overweight</strong> <strong>and</strong> <strong>obesity</strong> using Body Mass IndexAdultsThe National Institute for Health <strong>and</strong> Clinical Excellence (NICE) recommends that <strong>overweight</strong> <strong>and</strong><strong>obesity</strong> are assessed using Body Mass Index (BMI). 6 It is used because, for most people, BMIcorrelates with their proportion <strong>of</strong> body fat.BMI is defined as the person’s weight in kilograms divided by the square <strong>of</strong> their height in metres(kg/m 2 ). For example, to calculate the BMI <strong>of</strong> a person who weighs 95kg <strong>and</strong> is 180cm tall:BMI =95=95= 29.32kg/m 2(1.80 x 1.80) 3.24Thus their BMI would be approximately 29kg/m 2 .NICE classifies ‘<strong>overweight</strong>’ as a BMI <strong>of</strong> 25 to 29.9kg/m 2 <strong>and</strong> ‘<strong>obesity</strong>’ as a BMI <strong>of</strong> 30kg/m 2 ormore. 6 This classification accords with that recommended by the World Health Organization(WHO). 21 Further classifications linked with morbidity are shown on the next page. These cut-<strong>of</strong>fpoints are based on epidemiological evidence <strong>of</strong> the link between mortality <strong>and</strong> BMI in adults. 21
204 Healthy Weight, Healthy Lives: A toolkit for developing local strategiesClassification <strong>of</strong> <strong>overweight</strong> <strong>and</strong> <strong>obesity</strong> among adultsClassification BMI (kg/m 2 ) Risk <strong>of</strong> co-morbidities*Underweight Less than 18.5 Low (but risk <strong>of</strong> other clinicalproblems increased)Healthy weight 18.5–24.9 AverageOverweight (or pre-obese) 25–29.9 IncreasedObesity, class I 30–34.9 ModerateObesity, class II 35–39.9 SevereObesity, class III (severely ormorbidly obese)40 or more Very severeNote: NICE recommends that the BMI measurement should be interpreted with caution because it is not a direct measure <strong>of</strong> adiposity (amount <strong>of</strong> body fat). 6*Co-morbidities are the health risks associated with <strong>obesity</strong>, ie type 2 diabetes, hypertension (high blood pressure), stroke, coronary heart disease, cancer, osteoarthritis <strong>and</strong> dyslipidaemia (imbalance <strong>of</strong> fatty substances in the blood).Source: National Institute for Health <strong>and</strong> Clinical Excellence, 2006, 6 adapted from World Health Organization, 2000 21Adults <strong>of</strong> Asian originThe concept <strong>of</strong> different cut-<strong>of</strong>fs for different ethnic groups has been proposed by the WHO *because some ethnic groups have higher cardiovascular <strong>and</strong> metabolic risks at lower BMIs. Thismay be because <strong>of</strong> differences in body shape <strong>and</strong> fat distribution. Asian populations, in particular,have a higher proportion <strong>of</strong> body fat compared with people <strong>of</strong> the same age, gender <strong>and</strong> BMI inthe general UK population. Thus, the proportion <strong>of</strong> Asian people with a high risk <strong>of</strong> type 2diabetes <strong>and</strong> cardiovascular disease is substantial even at BMIs lower than the existing WHOcut-<strong>of</strong>f point for <strong>overweight</strong>.However, levels <strong>of</strong> morbidity vary between different Asian populations <strong>and</strong> for this reason it isdifficult to identify one clear BMI cut-<strong>of</strong>f point. 209 Thus in the absence <strong>of</strong> worldwide agreement,NICE recommends that the current universal cut-<strong>of</strong>f points for the general adult population (seetable above) be retained for all population groups. 6 This is in agreement with the WHO expertconsultation group which also recommends trigger points for public health action for adults <strong>of</strong>Asian origin – 23kg/m 2 for increased risk <strong>and</strong> 27.5kg/m 2 for high risk. 210 NICE has recommendedthat healthcare pr<strong>of</strong>essionals should use clinical judgement when considering risk factors in Asianpopulation groups, even in people not classified as <strong>overweight</strong> or obese using the current BMIclassification. 6 This approach is supported by the Department <strong>of</strong> Health <strong>and</strong> the Food St<strong>and</strong>ardsAgency.Using the BMI measurement in isolationAlthough BMI is an acceptable approximation <strong>of</strong> total body fat at the population level <strong>and</strong> can beused to estimate the relative risk <strong>of</strong> disease in most people, it is not always an accurate predictor<strong>of</strong> body fat or fat distribution, particularly in muscular individuals, because <strong>of</strong> differences inbody-fat proportions <strong>and</strong> distribution. Some other population groups, such as Asians <strong>and</strong> olderpeople, have co-morbidity risk factors that would be <strong>of</strong> concern at different BMIs (lower for Asianadults as detailed above <strong>and</strong> higher for older people). Therefore, NICE recommends that waistcircumference should be used in addition to BMI to measure central <strong>obesity</strong> <strong>and</strong> disease risk inindividuals with a BMI less than 35kg/m 2 . 6 (See Measuring BMI <strong>and</strong> waist circumference in adultsto assess health risks on page 206.)* The proposed cut-<strong>of</strong>fs are 18.5-22.9kg/m 2 (healthy weight), 23kg/m 2 or more (<strong>overweight</strong>), 23-24.9kg/m 2 (at risk), 25-29.9kg/m 2 (<strong>obesity</strong> I),30kg/m 2 or more (<strong>obesity</strong> II). 208
<strong>TOOL</strong> <strong>E3</strong> <strong>Measurement</strong> <strong>and</strong> <strong>assessment</strong> <strong>of</strong> <strong>overweight</strong> <strong>and</strong> <strong>obesity</strong> – ADULTS 205Measuring waist circumferenceAdultsWaist circumference has been shown to be positively, although not perfectly, correlated to diseaserisk, <strong>and</strong> is the most practical measurement to assess a patient’s abdominal fat content or ‘central’fat distribution. 125 Central <strong>obesity</strong> is linked to a higher risk <strong>of</strong> type 2 diabetes <strong>and</strong> coronary heartdisease.NICE recommends that waist circumference can be used, in addition to BMI, to assess risk inadults with a BMI <strong>of</strong> less than 35kg/m 2 . 6 However, where BMI is greater than 35kg/m 2 , waistcircumference adds little to the absolute measure <strong>of</strong> risk provided by BMI. 6, 126 This is becausepatients who have a BMI <strong>of</strong> 35kg/m 2 will exceed the waist circumference cut-<strong>of</strong>f points (detailedbelow) used to identify people at risk <strong>of</strong> the metabolic syndrome. 125Waist circumference thresholds used to assess health risks in the general populationAt increased risk Male FemaleIncreased risk 94cm (37 inches) or more 80cm (31 inches) or moreGreatly increased risk 102cm (40 inches) or more 88cm (35 inches) or moreSource: National Institute for Health <strong>and</strong> Clinical Excellence, 2006, 6 International Diabetes Federation (2005), 210 WHO/IASO/IOTF (2000), 208World Health Organization (2000) 21Adults <strong>of</strong> Asian originDifferent waist circumference cut-<strong>of</strong>fs for different ethnic groups have been proposed by theWorld Health Organization 208 <strong>and</strong> the International Diabetes Federation. 210 * This is because ethnicpopulations have higher cardiovascular risk factors at lower waist circumferences than Westernpopulations. 211 For example, in South Asians (<strong>of</strong> Pakistani, Bangladeshi <strong>and</strong> Indian origin) living inEngl<strong>and</strong>, a given waist circumference tends to be associated with more features <strong>of</strong> the metabolicsyndrome than in Europeans. 6However, a unique threshold for all Asian populations may not be appropriate because differentAsian populations differ in the level <strong>of</strong> risk associated with a particular waist circumference. Forexample, a study evaluating the average waist circumference <strong>of</strong> more than 30,000 individualsfrom East Asia (China, Hong Kong, Korea, <strong>and</strong> Taiwan), South Asia (India <strong>and</strong> Pakistan) <strong>and</strong>South-east Asia (Indonesia, Malaysia, the Philippines, Singapore, Thail<strong>and</strong> <strong>and</strong> Vietnam) foundthat there were major differences between regions. Thus, the researchers concluded that theimpact <strong>of</strong> <strong>obesity</strong> may begin at different thresholds in different Asian populations. 212Because a globally applicable grading system <strong>of</strong> waist circumference for ethnic populations hasnot yet been developed, NICE does not recommend separate waist circumference cut-<strong>of</strong>fs fordifferent ethnic groups in the UK. 6Using the waist circumference measurement in isolationWaist circumference should never be used in isolation, as a proportion <strong>of</strong> subjects who requireweight management may not be identified. 126 Thus NICE recommends the use <strong>of</strong> the table on thenext page to assess the level <strong>of</strong> weight management required. 6* The International Diabetes Federation (IDF) <strong>and</strong> the World Health Organization have proposed separate waist circumference thresholds foradults <strong>of</strong> Asian origin <strong>of</strong> 90cm (35 inches) or more for men, <strong>and</strong> 80cm (31 inches) or more for women. Note that the IDF definition is for South21, 208, 210Asians <strong>and</strong> Chinese populations only.
206 Healthy Weight, Healthy Lives: A toolkit for developing local strategiesNICE states that: “The level <strong>of</strong> intervention should be higher for patients with comorbidities,regardless <strong>of</strong> their waist circumference.” 6Assessing the level <strong>of</strong> weight management: a guideBMI classification Waist circumference Co-morbidities presentOverweightObesity IObesity IIObesity IIIGeneral advice on healthy weight <strong>and</strong> lifestyleDiet <strong>and</strong> physical activityDiet <strong>and</strong> physical activity; consider drugsLow High Very highDiet <strong>and</strong> physical activity; consider drugs; consider surgerySource: National Institute for Health <strong>and</strong> Clinical Excellence, 2006 6Measuring BMI <strong>and</strong> waist circumference in adults to assesshealth risksThe World Health Organization (WHO) has recommended that an individual’s relative health riskcould be more accurately classified using both BMI <strong>and</strong> waist circumference. 21 This is shownbelow for the general adult population.Combining BMI <strong>and</strong> waist measurement to assess <strong>obesity</strong> <strong>and</strong> the risk <strong>of</strong> type 221, 6, 126diabetes <strong>and</strong> cardiovascular disease – general adult populationClassification BMI (kg/m 2 ) Waist circumference <strong>and</strong> risk <strong>of</strong>co-morbiditiesMen: 94–102cmWomen: 80-88cmMen: More than 102cmWomen: More than 88cmUnderweight Less than 18.5 – –Healthy weight 18.5–24.9 – IncreasedOverweight (or pre-obese) 25–29.9 Increased HighObesity 30 or more High Very highSource: National Institute for Health <strong>and</strong> Clinical Excellence, 2006 6
<strong>TOOL</strong> <strong>E3</strong> <strong>Measurement</strong> <strong>and</strong> <strong>assessment</strong> <strong>of</strong> <strong>overweight</strong> <strong>and</strong> <strong>obesity</strong> – ADULTS 207Measuring waist-hip ratioAdultsWaist-hip ratio is another measure <strong>of</strong> body fat distribution. The waist-hip measurement is definedas waist circumference divided by hip circumference, ie waist girth (in metres) divided by hip girth(in metres). Although there is no consensus about appropriate waist-hip ratio thresholds, a raised6, 208waist-hip ratio is commonly taken to be 1.0 or more in men, <strong>and</strong> 0.85 or more in women.However, neither NICE nor the Department <strong>of</strong> Health recommends the use <strong>of</strong> waist-hip ratio as ast<strong>and</strong>ard measure <strong>of</strong> <strong>overweight</strong> or <strong>obesity</strong>.AssessmentAssessment <strong>of</strong> <strong>overweight</strong> <strong>and</strong> <strong>obesity</strong> using BMI <strong>and</strong> waist circumferenceManagement should begin with the <strong>assessment</strong> <strong>of</strong> <strong>overweight</strong> <strong>and</strong> <strong>obesity</strong> in the patient. BMIshould be used to classify the degree <strong>of</strong> <strong>obesity</strong>, <strong>and</strong> waist circumference may be used in peoplewith a BMI less than 35kg/m 2 to determine the presence <strong>of</strong> central <strong>obesity</strong>. NICE recommendsthat the <strong>assessment</strong> <strong>of</strong> health risks associated with <strong>overweight</strong> <strong>and</strong> <strong>obesity</strong> in adults should bebased on BMI <strong>and</strong> waist circumference as shown below. 6Assessing risks from <strong>overweight</strong> <strong>and</strong> <strong>obesity</strong>BMI classificationWaist circumferenceLow High Very highOverweight No increased risk Increased risk High riskObesity I Increased risk High risk Very high riskFor men, waist circumference <strong>of</strong> less than 94cm is low, 94–102cm is high <strong>and</strong> more than 102cm isvery high.For women, waist circumference <strong>of</strong> less than 80cm is low, 80–88cm is high, <strong>and</strong> more than 88cm isvery high.Source: National Institute for Health <strong>and</strong> Clinical Excellence, 2006 6Assessments also need to include holistic aspects focusing on psychological, social <strong>and</strong>environmental issues. There is a need for training for pr<strong>of</strong>essionals who carry out <strong>assessment</strong>s dueto the sensitive <strong>and</strong> multifaceted nature <strong>of</strong> <strong>overweight</strong> <strong>and</strong> <strong>obesity</strong>. Pr<strong>of</strong>essionals need to beaware <strong>of</strong> patients’ motivations <strong>and</strong> expectations. Effective <strong>assessment</strong> <strong>and</strong> intervention requiresupport, underst<strong>and</strong>ing <strong>and</strong> a non-judgemental approach.
208 Healthy Weight, Healthy Lives: A toolkit for developing local strategiesAssessing <strong>and</strong> classifying <strong>overweight</strong> <strong>and</strong> <strong>obesity</strong> in adultsNICE recommends the following approach to assessing <strong>and</strong> classifying <strong>overweight</strong> <strong>and</strong> <strong>obesity</strong>in adults.Determine degree <strong>of</strong> <strong>overweight</strong> or <strong>obesity</strong>• Use clinical judgement to decide when to measure weight <strong>and</strong> height• Use BMI to classify degree <strong>of</strong> <strong>obesity</strong> ... but use clinical judgement:– BMI may be less accurate in highly muscular people– for Asian adults, risk factors may be <strong>of</strong> concern at lower BMI– for older people, risk factors may become important at higher BMIs• Use waist circumference in people with a BMI less than 35kg/m 2 to assess health risks• Bioimpedance is not recommended as a substitute for BMI• Tell the person their classification, <strong>and</strong> how this affects their risk <strong>of</strong> long-term healthproblems.Assess lifestyle, comorbidities <strong>and</strong> willingness to change, including:• presenting symptoms <strong>and</strong> underlying causes <strong>of</strong> <strong>overweight</strong> or <strong>obesity</strong>• eating behaviour• comorbidities (such as type 2 diabetes, hypertension, cardiovascular disease,osteoarthritis, dyslipidaemia <strong>and</strong> sleep apnoea) <strong>and</strong> risk factors, using the following tests– lipid pr<strong>of</strong>ile <strong>and</strong> blood glucose (both preferably fasting) <strong>and</strong> blood pressure measurement• lifestyle – diet <strong>and</strong> physical activity• psychosocial distress <strong>and</strong> lifestyle, environmental, social <strong>and</strong> family factors – includingfamily history <strong>of</strong> <strong>overweight</strong> <strong>and</strong> <strong>obesity</strong> <strong>and</strong> comorbidities• willingness <strong>and</strong> motivation to change• potential <strong>of</strong> weight loss to improve health• psychological problems• medical problems <strong>and</strong> medication.Source: Reproduced from National Institute for Health <strong>and</strong> Clinical Excellence, 2006 6Assessment <strong>of</strong> <strong>overweight</strong> <strong>and</strong> <strong>obesity</strong> using the height <strong>and</strong> weight chartThe height <strong>and</strong> weight chart shown on the next page can be used as a crude <strong>assessment</strong> <strong>of</strong><strong>overweight</strong> <strong>and</strong> <strong>obesity</strong>. To use the chart follow the simple instructions at the top <strong>of</strong> the chart.Tool E1 provides further information on NICE <strong>and</strong> Department <strong>of</strong> Health guidance for assessing<strong>and</strong> managing <strong>overweight</strong> <strong>and</strong> <strong>obesity</strong> in a clinical setting.Note:The NHS Local Delivery Plan monitoring line on adult <strong>obesity</strong> status requires general practices tomonitor <strong>and</strong> return data on the <strong>obesity</strong> status (BMI) <strong>of</strong> GP-registered adults within the past 15months.
<strong>TOOL</strong> <strong>E3</strong> <strong>Measurement</strong> <strong>and</strong> <strong>assessment</strong> <strong>of</strong> <strong>overweight</strong> <strong>and</strong> <strong>obesity</strong> – ADULTS 209Height <strong>and</strong> weight chartTake a straight line across from the person’s height (without shoes), <strong>and</strong> a line up or down fromtheir weight (without clothes). Put a mark where the two lines meet to find out if the personneeds to lose weight.Weight (in kilos)Height (in feet <strong>and</strong> inches)Height (in metres)Weight (in stones)Underweight (BMI less than 18.5kg/m 2 )A more calorie-dense diet may be needed to maintain current activity levels. In cases <strong>of</strong> very low weight forheight, medical advice should be considered.OK (BMI 18.5 – 24.9kg/m 2 )This is the optimal, desirable or ‘normal’ range. Calorie intake is appropriate for current activity levels.Overweight (BMI 25 – 29.9kg/m 2 )Some loss <strong>of</strong> weight might be beneficial to health.Obese (BMI 30 – 39.9kg/m 2 )There is an increased risk <strong>of</strong> ill health <strong>and</strong> a need to lose weight. Regular health checks are required.Very obese (BMI 40kg/m 2 or above)This is severe or ‘morbid’ <strong>obesity</strong>. There is a greatly increased risk <strong>of</strong> developing complications <strong>of</strong> <strong>obesity</strong> <strong>and</strong> anurgent need to lose weight. Specialist advice should be sought.