Monitoring MPA visitor uses handbook
Monitoring MPA visitor uses handbook
Monitoring MPA visitor uses handbook
- No tags were found...

Create successful ePaper yourself
Turn your PDF publications into a flip-book with our unique Google optimized e-Paper software.
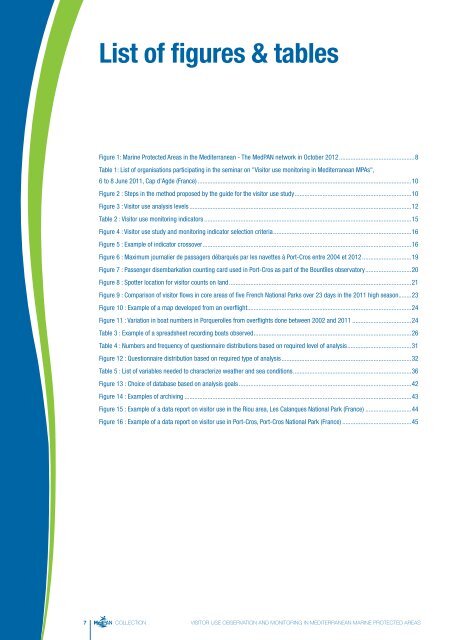
List of figures & tablesFigure 1: Marine Protected Areas in the Mediterranean - The MedPAN network in October 2012...............................................8Table 1: List of organisations participating in the seminar on "Visitor use monitoring in Mediterranean <strong>MPA</strong>s",6 to 8 June 2011, Cap d’Agde (France)...................................................................................................................................10Figure 2 : Steps in the method proposed by the guide for the <strong>visitor</strong> use study........................................................................10Figure 3 : Visitor use analysis levels........................................................................................................................................12Table 2 : Visitor use monitoring indicators...............................................................................................................................15Figure 4 : Visitor use study and monitoring indicator selection criteria.....................................................................................16Figure 5 : Example of indicator crossover................................................................................................................................16Figure 6 : Maximum journalier de passagers débarqués par les navettes à Port-Cros entre 2004 et 2012...............................19Figure 7 : Passenger disembarkation counting card used in Port-Cros as part of the Bountîles observatory.............................20Figure 8 : Spotter location for <strong>visitor</strong> counts on land................................................................................................................21Figure 9 : Comparison of <strong>visitor</strong> flows in core areas of five French National Parks over 23 days in the 2011 high season ........23Figure 10 : Example of a map developed from an overflight ....................................................................................................24Figure 11 : Variation in boat numbers in Porquerolles from overflights done between 2002 and 2011.....................................24Table 3 : Example of a spreadsheet recording boats observed.................................................................................................26Table 4 : Numbers and frequency of questionnaire distributions based on required level of analysis........................................31Figure 12 : Questionnaire distribution based on required type of analysis................................................................................32Table 5 : List of variables needed to characterize weather and sea conditions.........................................................................36Figure 13 : Choice of database based on analysis goals..........................................................................................................42Figure 14 : Examples of archiving...........................................................................................................................................43Figure 15 : Example of a data report on <strong>visitor</strong> use in the Riou area, Les Calanques National Park (France).............................44Figure 16 : Example of a data report on <strong>visitor</strong> use in Port-Cros, Port-Cros National Park (France)...........................................457 COLLECTION VISITOR USE OBSERVATION AND MONITORING IN MEDITERRANEAN MARINE PROTECTED AREAS