- Page 1:
w Orcina Ltd. Daltongate Ulverston
- Page 4 and 5:
Contents 4 w 3.4 Libraries 40 3.4.1
- Page 6 and 7:
Contents 6 w 5.6 Dynamic Analysis 1
- Page 8 and 9:
Contents 8 w 6.5.23 Wave Scatter Co
- Page 10 and 11:
Contents 10 w 8.12 Results 444 8.13
- Page 12 and 13:
Introduction, Installing OrcaFlex
- Page 14 and 15:
Introduction, Parallel Processing M
- Page 16 and 17:
Introduction, References and Links
- Page 18 and 19:
Introduction, References and Links
- Page 21 and 22:
w 2 TUTORIAL 2.1 GETTING STARTED 21
- Page 23 and 24:
w 23 Tutorial, Dynamic Analysis sha
- Page 25 and 26:
w 3 USER INTERFACE 3.1 INTRODUCTION
- Page 27 and 28: w Simulation Paused 27 User Interfa
- Page 29 and 30: w Keys on Main Window New model Ope
- Page 31 and 32: w Rotate viewpoint left (decrement
- Page 33 and 34: w General: StaticsMethod: Whole Sys
- Page 35 and 36: w A text data file saved by OrcaFle
- Page 37 and 38: w 37 User Interface, Model Browser
- Page 39 and 40: w Cut/Copy Cut or Copy the selected
- Page 41 and 42: w 3.4.1 Using Libraries 41 User Int
- Page 43 and 44: w 43 User Interface, Libraries Once
- Page 45 and 46: w 3.5.1 File Menu New Deletes all o
- Page 47 and 48: w New Vessel New Line New 6D Buoy N
- Page 49 and 50: w 3.5.5 View Menu Change Graphics M
- Page 51 and 52: w Preferences 51 User Interface, Me
- Page 53 and 54: w 53 User Interface, 3D Views 3D Vi
- Page 55 and 56: w 55 User Interface, 3D Views � D
- Page 57 and 58: w 57 User Interface, 3D Views a lin
- Page 59 and 60: w 59 User Interface, 3D Views � F
- Page 61 and 62: w Replay Period 61 User Interface,
- Page 63 and 64: w Frame interval in real time 63 Us
- Page 65 and 66: w Numeric 65 User Interface, Data F
- Page 67 and 68: w � For lines you must specify th
- Page 69 and 70: w 69 User Interface, Results this i
- Page 71 and 72: w 71 User Interface, Results Let th
- Page 73 and 74: w 73 User Interface, Results remain
- Page 75 and 76: w Results 75 User Interface, Result
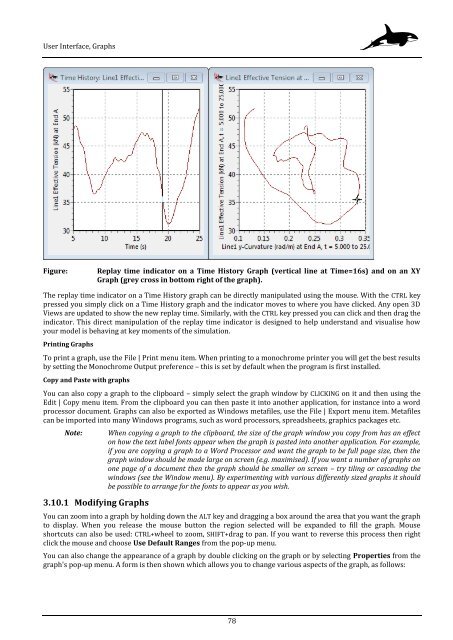
- Page 77: w Replays 77 User Interface, Graphs
- Page 81 and 82: w Command Line Parameters 81 User I
- Page 83: w Wire Frame Graphics Codec 83 User
- Page 86 and 87: Automation, Batch Processing Multi-
- Page 88 and 89: Automation, Batch Processing 88 w N
- Page 90 and 91: Automation, Batch Processing Assign
- Page 92 and 93: Automation, Batch Processing Line T
- Page 94 and 95: Automation, Batch Processing SHEAR7
- Page 96 and 97: Automation, Batch Processing PolarT
- Page 98 and 99: Automation, Batch Processing Figure
- Page 100 and 101: Automation, Text Data Files Data in
- Page 102 and 103: Automation, Text Data Files Selecte
- Page 104 and 105: Automation, Text Data Files SHEAR7L
- Page 106 and 107: Automation, Text Data Files 4.3.2 A
- Page 108 and 109: Automation, Post-processing 108 w F
- Page 110 and 111: Automation, Post-processing 110 w N
- Page 112 and 113: Automation, Post-processing 112 w N
- Page 114 and 115: Automation, Post-processing Referen
- Page 116 and 117: Automation, Post-processing Command
- Page 118 and 119: Automation, Post-processing 118 w N
- Page 120 and 121: Automation, Post-processing Figure:
- Page 123 and 124: w 5 THEORY 5.1 COORDINATE SYSTEMS 1
- Page 125 and 126: w 125 Theory, Object Connections Di
- Page 127 and 128: w 127 Theory, Static Analysis Final
- Page 129 and 130:
w 129 Theory, Static Analysis metho
- Page 131 and 132:
w 131 Theory, Dynamic Analysis for
- Page 133 and 134:
w Static Starting Position Simulati
- Page 135 and 136:
w 135 Theory, Friction Theory The n
- Page 137 and 138:
w where μ = magnitude of the vecto
- Page 139 and 140:
w 139 Theory, Extreme Value Statist
- Page 141 and 142:
w where σ = GPD scale parameter ξ
- Page 143 and 144:
w 143 Theory, Environment Theory Th
- Page 145 and 146:
w where Pu(z) = Nc(z/D)su(z)D Pu-su
- Page 147 and 148:
w 147 Theory, Environment Theory
- Page 149 and 150:
w Repenetration Offset After Uplift
- Page 151 and 152:
w 151 Theory, Environment Theory sp
- Page 153 and 154:
w Extrapolation Stretching 153 Theo
- Page 155 and 156:
w 155 Theory, Environment Theory st
- Page 157 and 158:
w 157 Theory, Vessel Theory individ
- Page 159 and 160:
w 159 Theory, Vessel Theory RAOs ca
- Page 161 and 162:
w 161 Theory, Vessel Theory Notes:
- Page 163 and 164:
w 163 Theory, Vessel Theory ω is t
- Page 165 and 166:
w surge/sway/heave M M.L roll/pitch
- Page 167 and 168:
w 167 Theory, Vessel Theory that co
- Page 169 and 170:
w 169 Theory, Vessel Theory separat
- Page 171 and 172:
w 171 Theory, Vessel Theory At this
- Page 173 and 174:
w Segment 1 Segment 2 Segment 3 Act
- Page 175 and 176:
w 175 Theory, Line Theory � If to
- Page 177 and 178:
w where component of M2 in the Sx2
- Page 179 and 180:
w The hysteresis model is described
- Page 181 and 182:
w � (90,90,90) sets Ex along -GX,
- Page 183 and 184:
w = v1 + p' + ω×p Therefore its a
- Page 185 and 186:
w y End A Stress ID z Stress OD O S
- Page 187 and 188:
w 5.12.16 Hydrodynamic and Aerodyna
- Page 189 and 190:
w 189 Theory, Line Theory Another w
- Page 191 and 192:
w Drag Chain Seabed Interaction 191
- Page 193 and 194:
w 193 Theory, Line Theory OrcaFlex
- Page 195 and 196:
w 195 Theory, 6D Buoy Theory clashi
- Page 197 and 198:
w 197 Theory, 6D Buoy Theory For Lu
- Page 199 and 200:
w 199 Theory, 6D Buoy Theory (due t
- Page 201 and 202:
w 201 Theory, 6D Buoy Theory Note:
- Page 203 and 204:
w α is the angle between the relat
- Page 205 and 206:
w 5.13.6 Contact Forces Contact For
- Page 207 and 208:
w Dynamic Analysis 207 Theory, Winc
- Page 209:
w 209 Theory, Shape Theory Finally,
- Page 212 and 213:
System Modelling: Data and Results,
- Page 214 and 215:
System Modelling: Data and Results,
- Page 216 and 217:
System Modelling: Data and Results,
- Page 218 and 219:
System Modelling: Data and Results,
- Page 220 and 221:
System Modelling: Data and Results,
- Page 222 and 223:
System Modelling: Data and Results,
- Page 224 and 225:
System Modelling: Data and Results,
- Page 226 and 227:
System Modelling: Data and Results,
- Page 228 and 229:
System Modelling: Data and Results,
- Page 230 and 231:
System Modelling: Data and Results,
- Page 232 and 233:
System Modelling: Data and Results,
- Page 234 and 235:
System Modelling: Data and Results,
- Page 236 and 237:
System Modelling: Data and Results,
- Page 238 and 239:
System Modelling: Data and Results,
- Page 240 and 241:
System Modelling: Data and Results,
- Page 242 and 243:
System Modelling: Data and Results,
- Page 244 and 245:
System Modelling: Data and Results,
- Page 246 and 247:
System Modelling: Data and Results,
- Page 248 and 249:
System Modelling: Data and Results,
- Page 250 and 251:
System Modelling: Data and Results,
- Page 252 and 253:
System Modelling: Data and Results,
- Page 254 and 255:
System Modelling: Data and Results,
- Page 256 and 257:
System Modelling: Data and Results,
- Page 258 and 259:
System Modelling: Data and Results,
- Page 260 and 261:
System Modelling: Data and Results,
- Page 262 and 263:
System Modelling: Data and Results,
- Page 264 and 265:
System Modelling: Data and Results,
- Page 266 and 267:
System Modelling: Data and Results,
- Page 268 and 269:
System Modelling: Data and Results,
- Page 270 and 271:
System Modelling: Data and Results,
- Page 272 and 273:
System Modelling: Data and Results,
- Page 274 and 275:
System Modelling: Data and Results,
- Page 276 and 277:
System Modelling: Data and Results,
- Page 278 and 279:
System Modelling: Data and Results,
- Page 280 and 281:
System Modelling: Data and Results,
- Page 282 and 283:
System Modelling: Data and Results,
- Page 284 and 285:
System Modelling: Data and Results,
- Page 286 and 287:
System Modelling: Data and Results,
- Page 288 and 289:
System Modelling: Data and Results,
- Page 290 and 291:
System Modelling: Data and Results,
- Page 292 and 293:
System Modelling: Data and Results,
- Page 294 and 295:
System Modelling: Data and Results,
- Page 296 and 297:
System Modelling: Data and Results,
- Page 298 and 299:
System Modelling: Data and Results,
- Page 300 and 301:
System Modelling: Data and Results,
- Page 302 and 303:
System Modelling: Data and Results,
- Page 304 and 305:
System Modelling: Data and Results,
- Page 306 and 307:
System Modelling: Data and Results,
- Page 308 and 309:
System Modelling: Data and Results,
- Page 310 and 311:
System Modelling: Data and Results,
- Page 312 and 313:
System Modelling: Data and Results,
- Page 314 and 315:
System Modelling: Data and Results,
- Page 316 and 317:
System Modelling: Data and Results,
- Page 318 and 319:
System Modelling: Data and Results,
- Page 320 and 321:
System Modelling: Data and Results,
- Page 322 and 323:
System Modelling: Data and Results,
- Page 324 and 325:
System Modelling: Data and Results,
- Page 326 and 327:
System Modelling: Data and Results,
- Page 328 and 329:
System Modelling: Data and Results,
- Page 330 and 331:
System Modelling: Data and Results,
- Page 332 and 333:
System Modelling: Data and Results,
- Page 334 and 335:
System Modelling: Data and Results,
- Page 336 and 337:
System Modelling: Data and Results,
- Page 338 and 339:
System Modelling: Data and Results,
- Page 340 and 341:
System Modelling: Data and Results,
- Page 342 and 343:
System Modelling: Data and Results,
- Page 344 and 345:
System Modelling: Data and Results,
- Page 346 and 347:
System Modelling: Data and Results,
- Page 348 and 349:
System Modelling: Data and Results,
- Page 350 and 351:
System Modelling: Data and Results,
- Page 352 and 353:
System Modelling: Data and Results,
- Page 354 and 355:
System Modelling: Data and Results,
- Page 356 and 357:
System Modelling: Data and Results,
- Page 358 and 359:
System Modelling: Data and Results,
- Page 360 and 361:
System Modelling: Data and Results,
- Page 362 and 363:
System Modelling: Data and Results,
- Page 364 and 365:
System Modelling: Data and Results,
- Page 366 and 367:
System Modelling: Data and Results,
- Page 368 and 369:
System Modelling: Data and Results,
- Page 370 and 371:
System Modelling: Data and Results,
- Page 372 and 373:
System Modelling: Data and Results,
- Page 374 and 375:
System Modelling: Data and Results,
- Page 376 and 377:
System Modelling: Data and Results,
- Page 378 and 379:
System Modelling: Data and Results,
- Page 380 and 381:
System Modelling: Data and Results,
- Page 382 and 383:
System Modelling: Data and Results,
- Page 384 and 385:
System Modelling: Data and Results,
- Page 386 and 387:
System Modelling: Data and Results,
- Page 388 and 389:
System Modelling: Data and Results,
- Page 390 and 391:
System Modelling: Data and Results,
- Page 392 and 393:
System Modelling: Data and Results,
- Page 394 and 395:
System Modelling: Data and Results,
- Page 396 and 397:
System Modelling: Data and Results,
- Page 398 and 399:
System Modelling: Data and Results,
- Page 400 and 401:
System Modelling: Data and Results,
- Page 402 and 403:
System Modelling: Data and Results,
- Page 404 and 405:
System Modelling: Data and Results,
- Page 406 and 407:
System Modelling: Data and Results,
- Page 408 and 409:
System Modelling: Data and Results,
- Page 410 and 411:
System Modelling: Data and Results,
- Page 412 and 413:
System Modelling: Data and Results,
- Page 414 and 415:
System Modelling: Data and Results,
- Page 416 and 417:
System Modelling: Data and Results,
- Page 418 and 419:
System Modelling: Data and Results,
- Page 420 and 421:
System Modelling: Data and Results,
- Page 422 and 423:
System Modelling: Data and Results,
- Page 424 and 425:
System Modelling: Data and Results,
- Page 426 and 427:
System Modelling: Data and Results,
- Page 428 and 429:
System Modelling: Data and Results,
- Page 430 and 431:
System Modelling: Data and Results,
- Page 432 and 433:
Modal Analysis, Theory 432 w For si
- Page 434 and 435:
Modal Analysis, Theory 434 w This h
- Page 436 and 437:
Fatigue Analysis, Commands 436 w Fo
- Page 438 and 439:
Fatigue Analysis, Load Cases Data f
- Page 440 and 441:
Fatigue Analysis, Load Cases Data f
- Page 442 and 443:
Fatigue Analysis, Analysis Data 442
- Page 444 and 445:
Fatigue Analysis, Integration Param
- Page 446 and 447:
Fatigue Analysis, Fatigue Points Ba
- Page 448 and 449:
Fatigue Analysis, How Damage is Cal
- Page 450 and 451:
VIV Toolbox, Frequency Domain Model
- Page 452 and 453:
VIV Toolbox, Frequency Domain Model
- Page 454 and 455:
VIV Toolbox, Frequency Domain Model
- Page 456 and 457:
VIV Toolbox, Frequency Domain Model
- Page 458 and 459:
VIV Toolbox, Frequency Domain Model
- Page 460 and 461:
VIV Toolbox, Time Domain Models 460
- Page 462 and 463:
VIV Toolbox, Time Domain Models Fil
- Page 464 and 465:
VIV Toolbox, Time Domain Models Wak
- Page 466 and 467:
VIV Toolbox, Time Domain Models Our
- Page 468 and 469:
VIV Toolbox, Time Domain Models 468
- Page 470 and 471:
VIV Toolbox, Time Domain Models 470
- Page 472:
VIV Toolbox, Time Domain Models 472