Technical Note: Fluorescence In Situ Hybridization (FISH ... - Dako
Technical Note: Fluorescence In Situ Hybridization (FISH ... - Dako
Technical Note: Fluorescence In Situ Hybridization (FISH ... - Dako

Create successful ePaper yourself
Turn your PDF publications into a flip-book with our unique Google optimized e-Paper software.
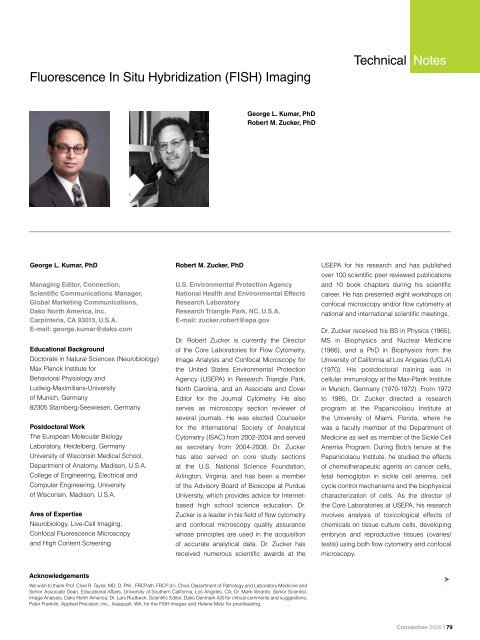
<strong>Fluorescence</strong> <strong>In</strong> <strong>Situ</strong> <strong>Hybridization</strong> (<strong>FISH</strong>) Imaging<strong>Technical</strong> <strong>Note</strong>sGeorge L. Kumar, PhDRobert M. Zucker, PhDGeorge L. Kumar, PhDManaging Editor, Connection,Scientific Communications Manager,Global Marketing Communications,<strong>Dako</strong> North America, <strong>In</strong>c.Carpinteria, CA 93013, U.S.A.E-mail: george.kumar@dako.comEducational BackgroundDoctorate in Natural Sciences (Neurobiology)Max Planck <strong>In</strong>stitute forBehavioral Physiology andLudwig-Maximilians-Universityof Munich, Germany82305 Starnberg-Seewiesen, GermanyPostdoctoral WorkThe European Molecular BiologyLaboratory, Heidelberg, GermanyUniversity of Wisconsin Medical School,Department of Anatomy, Madison, U.S.A.College of Engineering, Electrical andComputer Engineering, Universityof Wisconsin, Madison, U.S.A.Area of ExpertiseNeurobiology, Live-Cell Imaging,Confocal <strong>Fluorescence</strong> Microscopyand High Content ScreeningRobert M. Zucker, PhDU.S. Environmental Protection AgencyNational Health and Environmental EffectsResearch LaboratoryResearch Triangle Park, NC, U.S.A.E-mail: zucker.robert@epa.govDr. Robert Zucker is currently the Directorof the Core Laboratories for Flow Cytometry,Image Analysis and Confocal Microscopy forthe United States Environmental ProtectionAgency (USEPA) in Research Triangle Park,North Carolina, and an Associate and CoverEditor for the Journal Cytometry. He alsoserves as microscopy section reviewer ofseveral journals. He was elected Counselorfor the <strong>In</strong>ternational Society of AnalyticalCytometry (ISAC) from 2002-2004 and servedas secretary from 2004-2008. Dr. Zuckerhas also served on core study sectionsat the U.S. National Science Foundation,Arlington, Virginia, and has been a memberof the Advisory Board of Bioscope at PurdueUniversity, which provides advice for <strong>In</strong>ternetbasedhigh school science education. Dr.Zucker is a leader in his field of flow cytometryand confocal microscopy quality assurancewhose principles are used in the acquisitionof accurate analytical data. Dr. Zucker hasreceived numerous scientific awards at theUSEPA for his research and has publishedover 100 scientific peer reviewed publicationsand 10 book chapters during his scientificcareer. He has presented eight workshops onconfocal microscopy and/or flow cytometry atnational and international scientific meetings.Dr. Zucker received his BS in Physics (1965),MS in Biophysics and Nuclear Medicine(1966), and a PhD in Biophysics from theUniversity of California at Los Angeles (UCLA)(1970). His postdoctoral training was incellular immunology at the Max-Plank <strong>In</strong>stitutein Munich, Germany (1970-1972). From 1972to 1985, Dr. Zucker directed a researchprogram at the Papanicolaou <strong>In</strong>stitute atthe University of Miami, Florida, where hewas a faculty member of the Department ofMedicine as well as member of the Sickle CellAnemia Program. During Bob’s tenure at thePapanicolaou <strong>In</strong>stitute, he studied the effectsof chemotherapeutic agents on cancer cells,fetal hemoglobin in sickle cell anemia, cellcycle control mechanisms and the biophysicalcharacterization of cells. As the director ofthe Core Laboratories at USEPA, his researchinvolves analysis of toxicological effects ofchemicals on tissue culture cells, developingembryos and reproductive tissues (ovaries/testis) using both flow cytometry and confocalmicroscopy.AcknowledgementsWe wish to thank Prof. Clive R. Taylor, MD, D. Phil., FRCPath, FRCP (Ir), Chair, Department of Pathology and Laboratory Medicine andSenior Associate Dean, Educational Affairs, University of Southern California, Los Angeles, CA; Dr. Mark Verardo, Senior Scientist,Image Analysis, <strong>Dako</strong> North America; Dr. Lars Rudbeck, Scientific Editor, <strong>Dako</strong> Denmark A/S for critical comments and suggestions;Peter Franklin, Applied Precision, <strong>In</strong>c., Issaquah, WA, for the <strong>FISH</strong> images and Helene Metz for proofreading.Connection 2008 | 79
<strong>In</strong>troductionThe <strong>Fluorescence</strong> <strong>In</strong> <strong>Situ</strong> <strong>Hybridization</strong> (<strong>FISH</strong>) is a powerful techniquefor detecting chromosomal changes in tumor cells and is one of themost frequently used techniques in the study of structural cytology ofthe cell nucleus. It provides a reliable means for studying the geneticcomposition of cells in mitosis as well as in interphase. As of today, thetechnique has reached high detection sensitivity, (i.e. individual genescan be detected), and high multiplicity (i.e. several probes can beapplied to the same nucleus) (1-3). The most common methods for <strong>FISH</strong>visualization are: Flow cytometry systems and slide-based systems.<strong>In</strong> flow systems, <strong>FISH</strong>-stained cells are prepared in suspension, andthe suspension flows in a narrow stream across a laser beam whereinthe detector records their fluorescent intensities (4). <strong>In</strong> slide-basedsystems, <strong>FISH</strong>-stained cells are fixed to a conventional wide-field ora confocal fluorescence microscope slide and observed as a staticimage. Depending on the sophistication of both systems, a laser or anon-laser light source is used. <strong>In</strong> this technical note, we will discuss themost important microscope and instrument associated factors that arecrucial for obtaining good <strong>FISH</strong> images- assuming that the sample hasbeen well-prepared and a highly efficient fluorophore with high quantumyield is selected. Since there is not enough room in this short technicalnote to fully describe each term, where appropriate, we will providehyperlinks that will guide the reader to detailed explanations, animationsand other useful material.Optimization of the Microscope for Obtaining Good <strong>FISH</strong> ImagesObtaining good <strong>FISH</strong> images depends on various factors, such as the“Numerical Aperture (NA) of the objective, Köhler illumination or fieldillumination of the lens, the refractive index of the embedding medium,the coverslip thickness, the stability of the light source, depth of theobjects observed below the coverslip, and the ratio between emissionand excitation wavelengths. These factors influence the basic featuresof the optical system, such as the “Point Spread Function (PSF)”, theresolution (see appendix), optical sectioning (or confocality in case ofa confocal microscope, please refer to http://www.olympusmicro.com/primer/techniques/confocal/index.html), the light throughput, and thedegree of monochromatic and chromatic aberrations. <strong>In</strong> addition, it iscritical to have a lens that colocalizes the fluorescence pixels. <strong>In</strong> bothwide field and confocal systems, this is highly dependent on the qualityof the lens and the proper alignment of the system (5-11).Before the advent of digital imaging, lenses were evaluatedsubjectively,i.e. the image looks good or the image looks bad. So fromthese pretty pictures, it was very difficult to access the quality of theselenses from the point of lens aberrations (i.e. chromatic or spherical) soit was not clear, if one had a good lens or an imperfect lens. With theadvent of sophisticated microscope XYZ stages, digital cameras andconfocal microscopy, it has become easier to check the quality of thelenses by way of measuring PSF, spectral registration and colocalization(i.e. the degree of overlap between two different fluorescent labels, eachwith a separate emission wavelength and with the two “targets” locatedin the same area or very near to one another). The later three factors areespecially critical in order to resolve hybridization dots (i.e. <strong>FISH</strong>-stainedgenes), taking into consideration that hybridization dots are quite smallin size and occupy miniscule volumes inside the nuclei (e.g. 103 nmwith a volume of 5.7 × 10 -4 µm 3 for c-myc, 119 nm with a volume of 8.9× 10 -4 µm 3 for p53 and 123 nm with a volume of 9.7 × 10 -4 µm 3 for p58,respectively) (12). <strong>In</strong> this technical note, we shall discuss all of the aboveissues in brief.Numerical Aperture (NA) of the Objective<strong>In</strong> its simplest form, the NA of an objective is its light gatheringcapacity. The higher the NA, the higher its light gathering capacity. Asa result, an objective that is marked to have a high NA will collect moreemission wavelength coming out of the <strong>FISH</strong> (dots or sample). A 60xPlan Apochromat objective with a 1.4 NA will produce better results(depending on the detector) in contrast to a 40x objective with a 0.95NA. <strong>In</strong> terms of resolution, a 100x 1.4 NA objective will produce the sameresults as a 60x 1.4 NA objective, except that it will be dimmer, becauseImage Brightness (<strong>Fluorescence</strong>) a (NA 4 / M 2 ). However, a 100x objectiveis a more complex lens and will provide higher magnification of the <strong>FISH</strong>dot (when a digital camera is used) which may be desirable in somespecialized applications (e.g. microtubule dynamics in yeast or bacterialcell division). The higher NA lens will also have provide more resolutionthan the lower NA lens which will be essential to distinguish <strong>FISH</strong> pixels. Ahigher NA lens will also have less field depth so objects of slightly differentplanes may be out of focus inciting the need for a confocal microscopeor an epifluorescence microscope capable of obtaining optical sections.For a Java tutorial of NA, please refer to: http://www.microscopyu.com/tutorials/java/objectives/nuaperture/index.html.Köhler Illumination or Field Illumination of the LensA first demand for analysis of <strong>FISH</strong> objects or ratio-labeled objects isKöhler illumination (named after the German inventor August Köhler) oralso called field illumination. This is a technique that provides optimumresolution and contrast in a light microscope by aligning and focusingthe illumination light source and critically setting the apertures of themicroscope to best match the numerical aperture of the objective lens.This type of lighting provides even illumination on the object (i.e. <strong>FISH</strong>spots) also when there are irregularities in the brightness of the lightemittingsurface. Improper setting of this illumination makes it impossibleto use the full resolving power of the objectives thus resulting in nonoptimal<strong>FISH</strong> images (Fig. 1, 2). <strong>In</strong> addition to optimal <strong>FISH</strong> imaging,homogeneous illumination is critical for relative quantitation, such ascomparing the signal intensity between one region of interest to anotherand absolute quantitation, i.e. knowing the exact number of targetmolecules present in the sample of interest by the use of linear detectorssuch as cooled CCD cameras and PhotoMultiplier Tubes (PMT).The refractive index of the medium between the objective and coverslip:There is more light collected with oil immersion optics than with dryoptics (Fig. 3).Oil objectives usually have a higher numerical aperture, a sharper airy80 | Connection 2008
disk (see http://www.microscopyu.com/tutorials/java/imageformation/airyna/ and appendix) and higher resolution than an air lens. <strong>In</strong> otherwords, the light path of the optic changes the light gathering power.Oil immersion objectives improve light gathering power as less lightis lost. For example, the refractive index (h) of the glass that makes amicroscope objective and a glass coverslip that is over the specimensample is ~ 1.5. If the h of oil that goes between the objective andcoverslip is also ~ 1.5, then there is no refractive index mismatch. <strong>In</strong>this case, most of the light is collected. On the other hand, if oil thathas a wrong refractive index (h) is used (e.g. 1.36) or air that has ah of ~ 1.00 is used between the objective and coverslip, then thereis a refractive index mismatch. This can lead to emission light loss,spherical aberration and a reduced resolution of the <strong>FISH</strong> spot. <strong>In</strong>addition to these precautions, it is also important to make sure that thereare no air bubbles in the immersion oil that could act as a “lens”. For aJava tutorial, please refer to: http://www.microscopyu.com/tutorials/java/objectives/immersion/index.html. <strong>In</strong> a nutshell, the best <strong>FISH</strong> images areobtained when there is minimal or no refractive index mismatch betweenthe objective, coverslip and the sample.The CoverslipThis is the least expensive optical component, but very important andthe most likely to be carelessly chosen. Many objectives are designedand marked to be used with coverslips of a certain thickness, usually0.17 mm (or ~ 170 ±5 μm), which corresponds to a thickness grade of1.5. Ideally, for obtaining the best <strong>FISH</strong> images, it is recommended thatan oil immersion lens is used and these lenses almost always requirea 1.5 coverslip for optimal resolution. Any deviation from this thicknessleads to spherical aberration, loss in resolution and results in larger anddimmer <strong>FISH</strong> spots.The Stability of the Light SourceUsually, the illumination light source consists of a mercury arc or aproprietary pre-aligned high-efficiency light source such as Exfo http://www.exfo-xcite.com/, xenon arc or lasers.a) Mercury/Xenon arc lamp: If the arc is not focused sharply on theback aperture, the specimen plane will be unevenly illuminated. <strong>In</strong>addition, fluctuations in the illumination intensity of the lamp will alsoresult in variable intensity over the whole field of view. <strong>In</strong> order to avoidthis, it is better to consider a fluorescence microscope wherein the lightcoming from the mercury/xenon lamp goes through a quartz opticalfiber for light scrambling, resulting in an even illumination and lessfluctuations (Fig. 4).Mercury arc light sources have a lifetime of 200-300 hours whileproprietary pre-aligned high-efficiency light sources such as EXFO has alife time of 2000 hours. For <strong>FISH</strong> imaging, it is better to use light sourcesUV field IlluminationField Illumination - 20x Objective100X Objective (1.4 NA)Figure 1. UV field illumination of a Plan Apo 100x lens (1.4 NA) derivedwith a fluorescent plastic slide and the intensity measurement of 10-micronSpherotech beads (obtained from Spherotech, Libertyville, IL, U.S.A.). Thisillustrates the problem of using a lens with improper field illumination to makecomparative measurements on a sample. The field illumination pattern showsa bull’s eye intensity pattern slightly off-center and the five beads locatedin different parts of the field to illustrate the variation in intensity occurringby using a lens that has improper field illumination. The intensity of beadswas derived by a small Region of <strong>In</strong>terest (ROI) inside the bead. The fivebeads show a decrease in intensity relative to the bead in the center of theillumination. Although this figure was obtained with UV optics, it represents thetype of field illumination that can also occur with visible light excitation. Thispattern is also unacceptable, if a confocal laser scanning microscope opticalsystem is used for a <strong>FISH</strong> study, as the maximum intensity should be in thecenter of the objective and not in the corner.Figure 2. Field illumination. Field illumination patterns of visible (A) and UV(B) excitation using a 20x (Plan Apo, NA 0.7) lens. The visible field illuminationshows uniform illumination with the brightest intensity located in the centerof the objective. The line running diagonally in panels A and B measuresthe histogram intensity of the field illumination graphically represented inFigures C and D. The variation in intensity from the left to right side of thefield is less than 10% for visible excitation and over 150% for UV excitation.Acceptable field illumination has brightest intensity in the center of theobjective decreasing less than 25% across the field. The intensity regionswere prepared by using Image Pro Plus to divide the Grey Scale Value (GSV)into 10 equal regions and a median filter was used for additional processing.The field illumination test slides used in this study were from Applied Precision<strong>In</strong>c., Issaquah, WA, U.S.A, and consists of three fluorescent plastic slideswith excitation peak wavelengths of 408 nm (blue), 488 nm (orange), and 590nm (red), and emission peak wavelengths of 440 nm, 519 nm, and 650 nm,respectively. The blue slides (408nm) were used for UV field illumination andalignment while the orange slides were used for 488/ 568nm field illuminationand alignment. (For a Java tutorial of Köhler illumination, please refer to:http://micro.magnet.fsu.edu/primer/anatomy/kohler.html).Connection 2008 | 81
when they are more stable and at their peak, i.e. at the beginning orin the middle of their lifetime rather than using them at the end of thelifetime when there are more power fluctuations and more instability inthe bulb and decreases in power.Laser unit: Argon gas, helium neon gas and diode lasers are usuallyvery stable with less than 1% power fluctuations. However, if the heatis not dissipated adequately or there are other forms of inadequatecooling, the result can be large laser power fluctuations (Fig. 5).These fluctuations also occur when there are temperature or instabiltyproblems in the Acousto Optical Transmissions Filter (AOTF) of LaserScanning Confocal Microscopes (LSCM), or when there is incorrectalignment of the fiber (8-11). When such fluctuations occur, weaklyfluorescent structures (such as <strong>FISH</strong> spots) cannot be properly acquiredor quantified (13).Use of Laser Scanning Confocal Microscopes (LSCM) for<strong>FISH</strong> ImagingLSCM (see glossary) equipped with PMT are becoming common in<strong>FISH</strong> imaging (14). <strong>In</strong> general, good <strong>FISH</strong> images are obtained withLSCM that are properly aligned and calibrated. Furthermore, <strong>FISH</strong>images can also be improved by: (a) Adjusting the pinhole to maximizephoton capture; (b) Decreasing the laser power and thereby reducingphotobleaching; (c) Choosing optimum filters and dichroics to get themaximum excitation and emission; (d) Reducing the scan speed foracquiring more photons and (e) frame averaging (see Fig. 6). The latternot only reduces photobleaching of faint <strong>FISH</strong> spots, but also reducesthe noise in the system.Spectral RegistrationThe ability of light from different lasers and different fluorochromes tocolocalize given points in an X, Y and Z plane is defined as spectralregistration. For <strong>FISH</strong> it is crucial that this occurs so one can determine,if the fluorochromes representing <strong>FISH</strong> probes are colocalized or, if theyare separated. Confocal systems that do not have spectral registrationbetween the blue light and the other visible lines can provide inaccurateresults (Fig. 7). Therefore, it is important for a <strong>FISH</strong> imaging setupthat the system of lasers and lenses be checked with FocalCheckmicrospheres (<strong>In</strong>vitrogen, Carlsbad, California) to insure the systemshows the correct spectral registration at all wavelengths (Fig. 8).<strong>FISH</strong> ColocalizationColocalization can only be ascertained in the absence of “cross-talk”between or “bleed-through” from selected fluorochromes. Accuratecolocalization can only occur, if emission spectra are sufficientlyseparated between fluorochromes and, if correct filter sets are usedduring the acquisition step. Choosing fluorochromes with well-separatedexcitation and emission spectra is, therefore, critical for multiple labeling(multiple fluorochromes) and colocalization (15, 16). <strong>In</strong> addition, it isimportant to consider the microscope setup because in an improperlyaligned microscope moving different filter cubes into the image path cancause lateral and focus shifts, thereby leading to misregistration of thecolocalization images. As a note of caution, colocalization never showsthat two fluorescent probes are interacting. Colocalization only indicatesthat two probes are located within close proximity. It is the technique of“Förster Resonance Energy Transfer (abbreviated FRET) that actuallyshows protein/protein or protein/nucleic acid or nucleic acid/nucleicacid interaction.Resolution affects colocalization analysis. If the distance separating twofluorochromes is below the resolution of the imaging system (by the useof low NA objectives, e.g. 10x magnification/0.25 NA objective), theymay appear colocalized. On the other hand, if a high resolution systemis used (e.g. 100x magnification/1.45 NA objective), what did appearas colocalized may now be actually separate spots and not actuallycolocalized. Therefore, the NA of the objective lens, good refractiveindex match, and appropriate sampling frequency (or intervals) (i.e.small pixel sizes of the camera matched with magnification of theobjective lenses and high NA lenses) will all affect resolution and,consequently, colocalization analysis.Figure 3. Paths of light rays through a dry and oil-immersion objective lenses.The red circle at the origin of the light rays is the sample. If the refractive indexof the immersion oil ( 1.52) is matched to the glass coverslip and the objectivelens, then an optically homogenous light path is created, preventing distortion.Figure modified after Bruce Alberts et.al. Molecular Biology of the Cell. GarlandPublishers 2008.Figure 4. The integrated photosensor measures light intensity delivered to eachindividual image. All images acquired in a series, 2D or 3D, are then normalizedand balanced. Courtesy: DeltaVision ® High Resolution Imaging System ofApplied Precision, <strong>In</strong>c. Issaquah, WA: U.S.A.82 | Connection 2008
StandardsThe epifluorescence and confocal laser-scanning microscopes haveenormous potential in many biological fields apart from <strong>FISH</strong> imaging.When tests are made to evaluate the performance of these microscopes,the usual subjective assessment is accomplished by using a histologicaltest slide to create an image. However, without the use of functional testsand standards to measure a microscope performance, many of themachines may be working at sub-optimal performance levels, deliveringmisleading colocalization and <strong>FISH</strong> data. <strong>In</strong> order to replace thesubjectivity in evaluating these microscopes, standards are necessaryfor evaluating machine performance. Depending on the sophistication ofthe user, different parameters are usually used in evaluating microscopeperformance, such as spectral registration, axial resolution or fieldillumination (Fig. 7. 8). One such standard is a microscopic tool box thatincludes slides that can be used for various tests. For field illumination, itis better to use a set of four fluorescence slides provided by microscopefilter companies (e.g. Omega Optical <strong>Fluorescence</strong> Reference SlideSet: https://www.omegafilters.com/index.php?page=omega/Prod/prod_rslides_chart or Chroma Technology Corporation Slides: http://www.chroma.com (8-11). The red slide from such a set can be excited at allwavelengths and is used to measure field illumination (see Fig. 2). For“Point Spread Function” (PSF) generation (see Appendix) to facilitatethe calibration of epifluorescence microscopes and LSCM for multicolorapplications and associated image-processing equipment, kits from<strong>In</strong>vitrogen: http://probes.invitrogen.com/media/pis/mp07279.pdf or fromPolyScience (Warrington, PA, U.S.A.):http://www.polysciences.com/Catalog/Department/Product/98/productId__1598/categoryId__50/) can be used. For more details,please refer to references 5-11.XY and Z Stage DriftMechanical drift at the microscope stage can cause the plane of theobject image to change with time (Fig. 9).This can lead to false artifactsin colocalization and/or <strong>FISH</strong>, and such artifacts can be avoided by usinga high-speed servo or piezoelectric-driven objective or stage insert, orwith a built-in motorized z-axis controller housed within the microscopestand. Stage drifts can also be avoided by using a high-quality vibrationisolation table and by temperature regulation around the table.Other FactorsA number of other factors will affect the image quality and the amount ofphotons recorded by the detectors. These include:efficiency of the optical couplingalignment and reflection characteristics of laser mirrors andtemperature of the detector (i.e. cooled PMT or a cooled CCDcamera).All of these factors can be synthesized into the following principle:More photons will hit the detector in aligned systems that have thecorrect filters. With dim <strong>FISH</strong> signals it is necessary to increase theexposure time and averaging. It is important not to bleach the samplewith excessive light. The use of possible antifade reagents (i.e. ProlongVectoshield) on fixed samples will reduce the bleaching and preservethe probe (8-11).CCD Camera as A Detector for <strong>FISH</strong> ImagingMany users use CCD cameras for <strong>FISH</strong> (and H&E) imaging (17-19). Theseare widely used in wide field and laser scanning confocal microscopesPower Stability 488 and 568 excitation3.2 hrEffects of frame averaging on noiseFigure 5. Visible laser stability. The laser power fluctuations using a 488 nm(blue) and 568 nm (red) lasers were determined using a 10x objective and aChroma red slide. The fluorescence was sequentially measured every 30 sec(400 times) for total time duration of 3.33 hrs. The variation of the peak to peakusing 488 nm or 568 nm excitation was approximately 25%. The fluctuatingpower intensity line suggests that the system scanning and detectiondevices are yielding large power fluctuations that will affect the illuminationof the sample. The Acousto Optical Transmission Filter (AOTF) is probablycontributing to this 488-568 nm sinusoidal pattern.Figure. 6. A confocal image was acquired with and without averaging themean intensity at channel 135. The coefficient of variation or CV (CV = Mean/Standard Deviation) was calculated for the images acquired with averaging of2, 4, and 16 frames, respectively. The distribution seen here is actually a pixeldistribution of intensities from the image. It shows a distribution of different pixelintensities that decrease as the averaging increases. The narrow distributionsare from more averaging and result in better image quality. <strong>In</strong> other words, thefigure shows that for obtaining ideal image quality it is better to average moretimes so as to increase the signal to noise ratio.Connection 2008 | 83
and can usually be purchased separately from the microscope. The userhas the discretion to choose from a large number of models providedby a variety of manufacturers. Although we will not describe in detail theoperation of a CCD camera, nor other details such as sources of noise,gain, linearity, offset gamma, full-well capacity and image time (pleasesee JB Pawley book for more details or please refer to: http://www.microscopyu.com/tutorials/java/digitalimaging/signaltonoise/index.html.<strong>In</strong> the next chapter, we will provide some useful hints on how to select asuitable camera and use it for <strong>FISH</strong> imaging.Quantum Efficiency (QE): <strong>FISH</strong> spots are often faint. It is, therefore,best to select a camera with a high QE corresponding to thewavelength of interest. What is QE? QE is defined as the proportionof the photons arriving at the detector that actually contribute to theoutput signal that is linearly proportional to the photon input. QE isoften a strong function of the wavelength l of the detected photons(see the book by Pawley 2006). <strong>In</strong> very simple terms, if 100 photonsof a certain l entering the imaging pixel generate 100 electrons and, if100 units of electrons are detected, then the CCD camera has a 100%QE (which is an ideal situation). Although it is technically impossibleto achieve a 100% QE, there are newer cameras available thathave a high QE (80-90% range). Highly recommended are ElectronMultiplying CCD (EMCCD) cameras which are highly sensitive anduse an on-chip amplification technology to amplify the signal abovethe read noise floor. The advantage of the EMCCD camera is twofold:(1) Its flexibility to operate as a high standard Quantum Efficiency(QE) CCD or as a single photon-sensitive powerhorse when thesignal is weak and/or exposure times need to be reduced; and (2)Its ability to preserve labeled <strong>FISH</strong> specimens from the effects ofphoto-bleaching by filtering the power of the illumination light andcompensating with higher Electron Multiplying gain, please refer to:http://www.andor.com/learn/applications/?docid=95 and http://www.emccd.com/what_is_emccd/emccd_tutorial/Q3_<strong>In</strong>%20Practice_How_Is_EM_Gain_Applied_to_Multiply_The_Signal.Pixel size: If a precise gene position determination is to be performedthen, in general, a high powered objective (60x or 100x magnification,1.4 NA) combined with a small pixel size (6-10 μm) camera should beused. This not only helps to improve the spatial resolution, but alsoincreases the sampling frequency (see appendix), dynamic rangeand signal-to-noise ratio. However, if the <strong>FISH</strong> spots are faint, then anEMCCD camera is recommended. For technical details on samplingfrequency and pixel size, please refer to the book of Pawley (2006) andto reference Chen et al. (2000) (17).Dynamic range: This refers to the ability of a CCD camera to detect finedifferences in the intensity levels of the signal. The dynamic range isuseful for determining the digitization requirements for a given signal.<strong>In</strong> general, for <strong>FISH</strong> imaging, a 12-bit (or 2 12 = 4,096 grey levels) CCDcamera is sufficient. Furthermore, cameras with lower values (8-bit or 2 8FocalCheck microspheresFigure 7. Spectral and axial resolution of a 1 μm bead obtained at threedifferent wavelengths. The figure shows an image of a bead taken using threewavelengths of light – 488 nm (FITC), 568 nm (TRITC) and 647 nm (Cy5).The XZ image was converted into an outline of the bead using Image Pro Plussoftware (Media Cybernetics, <strong>In</strong>c., Bethesda, MD, U.S.A.). The distribution ofintensities can be made in the XZ (long axis) direction and this value can becompared to the XY (short axis) value to determine, if all the three colors registercorrectly and, if they show a good axial resolution. The more circular the beadimage is and the more they are registered, the better the spectral registrationand axial resolution.Figure 8. FocalCheck microspheres (<strong>In</strong>vitrogen, Carlsbad, CA, U.S.A.)were used to monitor the laser alignment for the Zeiss 510 laser scanningconfocal microscope. FocalCheck microspheres have rings in three differentfluorescent colors that can be excited by the 488 nm, 543 nm and 633 nmlasers contained in the confocal system. If the lasers are aligned properly, theemission fluorescence will be superimposed and only one mixed color (yellow)for Rhodamine and FITC (543 nm and 488 nm) will be observed (left). However,if the lasers and the system is misaligned (right), then the colors will not besuperimposed and individual colors will be observed in the image. This wasobserved in the alignment of the 633 nm and 488 nm lasers by the emissionof Cy5 and FITC, respectively. The misaligned system shows reduced spectralregistration and, therefore, one can observe green, pink and the overlap of thetwo dyes designated as white instead of only white superimposed colors.84 | Connection 2008
= 256 grey levels or 10-bit = 1,024 grey levels) are usually insufficient.As a note of caution, the dynamic range should not be higher than thetotal gray levels for optimum representation of the different intensitylevels. Higher values do not improve the image quality anymore due tolow light levels from the sample. For low light levels, photon shot noisecaused by statistical fluctuations of the acquired signal levels does notallow accurate determination of fluorescence level.Readout speed (in units of MHz): This refers to how fast the accumulatedelectrons in each pixel can be transferred and digitized into a signal.The readout speed affects the readout noise.<strong>In</strong> general, the higherthe readout speed the higher the readout noise. Since all of the <strong>FISH</strong>imaging is static with pathology samples, a slower readout speed isbetter suited for this imaging. For instance, if a camera has two readoutspeeds, 10 MHz and 20 MHz, it is better to use a 10 MHz speed thanto use a 20 MHz speed.Binning: CCD are versatile devices and their readout pattern can bemanipulated to achieve various effects. Binning allows charges fromadjacent pixels to be combined and thus can offer benefits in fasterreadout speeds and improved signal to noise ratios albeit at the expenseof a reduced special resolution. Binning also increases sensitivity forquantitation and imaging at very low light levels. Depending on theintensity and resolution requirement of the <strong>FISH</strong> spot, one can trybinning twice. (Hint: The sample will look brighter at the expense of areduced special resolution). For more details on this topic, please visitthe “Microscopy Resource Center”:h t t p : / / w w w. o l y m p u s m i c r o . c o m / p r i m e r / d i g i t a l i m a g i n g /digitalimagingdetectors.html and http://www.microscopyu.com/tutorials/java/digitalimaging/pixelcalculator/index.html.The problem of spherical aberration; Wavelengths of light have differentcolors and focus through a lens at different positions. If the lens iscarefully made, it is possible to make blue, green and red light focus atthe same point. If the lens is of a cheaper quality or, if there is a defect,then chromatic aberrations occur. <strong>In</strong> simple terms, this means the redblue and green light does not focus at the same point or pixel. It is avery serious problem as interpretations of molecules represented byfluorochromes may be misinterpreted due to their proximity in a sample(see also Fig. 7, 8). As shown below (Fig. 10), the 170 nm point spreadTetraspec beads ( <strong>In</strong>vitrogen) should show wavelengths of emitted lightthat colocalize to the same point, if the system is aligned and functioningproperly. If the system is misaligned, the light from the different laserlines will occur at different points in the X, Y and Z planes.Importance of the wavelength of exciting light and emission filters: Oneway to increase the intensity of <strong>FISH</strong> fluorescence is to use a widebandexciter. This way, more photons capable of exciting the fluorophore arecaptured. However, the drawback is noise or crosstalk with anotherfluorophore. <strong>In</strong> these situations, narrowband exciters become useful.But again, the disadvantage is that there are less photons availablefor the detector which increases the noise in the system. The only wayto overcome the problem of using a wideband exciter vs. narrowbandexciter is by experimenting by trial and error, i.e. try to estimate howmuch fluorescence is available from the sample, how sensitive is thedetector (camera vs. PMT), objective magnifications, etc.Emission filters: Broadband emission will produce a larger signal andshould always be used except when there is crosstalk with the emissionof another fluorophore in the same sample. For more details, please referto: http://www.chroma.com, http://www.omegafilters.com/or http://www.semrock.com/Catalog/BrightlineCatalog.htm.Figure 10. The figure shows the Tetraspec beads excited with a 365 nmUV and 568 nm visible laser. The emitted fluorescence does not appearat the same point in a misaligned system that shows two distinct images(blue and red) (Fig. 10a) representing the emission from the two beads.However, in an aligned system only one point of colocalized emitted lightis observed (purple) (Fig. 10b).Figure 9. Beads (similar to <strong>FISH</strong> spots) were excited every minutesequentially with a 488 nm and a 568 nm laser. The mean intensity of the beadwas measured every minute for 3.3 hours (200 sample times). The patternshows periodic fluctuations in intensity over time indicating an unstable system(6-11). The mean intensity also drops over time, which implies that the sampleis either going out of focus, is emitting less light or is bleaching and emittingless light. Newer microscopes have controls that can correct such a stage drift.Connection 2008 | 85
Practical tip: The order of imaging dim objects such as <strong>FISH</strong> hybridizationspots: Shorter wavelengths of light have more energy compared tolonger wavelengths of light. Therefore, it is always advisable to image<strong>FISH</strong> spots in the following order: Longer excitation wavelengths firstfollowed by shorter excitation wavelengths (e.g. Rhodamine followedby FITC and DAPI). This reduces the possibility of bleaching the fartherred samples.Improving <strong>FISH</strong> Images by 3D Deconvolution MicroscopyThe use of an epifluorescence or a confocal microscope that uses a Zstage to create a stack of 2D images in a dataset and/or 3D images issuggested for <strong>FISH</strong> imaging. For more details, please refer to:http://www.olympusfluoview.com/theory/index.html andhttp://www.olympusconfocal.com/java/confocalvswidefield/index.html.DeconvolutionStacks of three-dimensional <strong>FISH</strong> images obtained by optical sectioningcan undergo an improvement in contrast and reduction in blur by themethod of image deconvolution (see cartoon below and Fig. 11 and 12).Image deconvolution is an algorithm-based process used to reversethe effects of convolution on recorded data. <strong>In</strong> non-mathematical terms,deconvolution is the converse of convolution. For instance, if a perfectlycircular subdiffraction (100 nanometer) fluorescent bead is viewedunder a microscope, it will not appear as a circular structure, but ratheras an elongated structure (see cartoon below). The circular structureSchematic concept of Convolution/ DeconvolutionBecause it can be difficult to interpret the data from a single 2D imagedue to the lack of continuity of the labels that may not be easy to assessin other planes, it is better to construct a 3D dataset from 2D <strong>FISH</strong>images for refined analysis. Why 3D imaging? 3D imaging technologyis far superior to conventional 2D imaging It enables practitioners tobetter identify potential problems in <strong>FISH</strong> images, such as artifactsin the probe localization (see Fig. 10 and the section “Science inPictures” for an example of 3D <strong>FISH</strong> images). Please also refer to:http://www.olympusmicro.com/primer/digitalimaging/deconvolution/deconintro.html.<strong>In</strong> addition, 3D imaging also allows the trained eye to identify otherimportant parameters such as e.g. the distance between the probes andwhether the probes are colocalized (2D systems simply cannot revealthis). Furthermore, the documented improved accuracy and precision of3D images help avoid potential mistakes such as image distortion andmagnification common with 2D imaging technology.appears elongated (or convoluted) due to the diffraction of light withinthe microscope and photon noise, i.e. inherent natural variation of theincident photon flux. The process of deconvolution is the converseof convolution or making the elongated (convoluted) structure into aspherical (deconvoluted) structure using deconvolution computationalalgorithms. (For more details, please refer to: http://www.olympusmicro.com/primer/digitalimaging/deconvolution/deconvolutionhome.html. Youmay also refer to the section “Science in Pictures” in this issue).<strong>In</strong> the last few years, deconvolution computational algorithms havebeen extended and developed by a number of commercial softwareFigure 11. Analysis of <strong>FISH</strong> signals using awidefield deconvolution microscope. Seenin this image are xy (top), xz (bottom), andyz (right) projections of deconvolved data.The colocalized <strong>FISH</strong> signals (yellow) areeasily seen in XY and XZ images. Imagecourtesy. Peter Franklin. Applied Precision<strong>In</strong>c, Issaquah, WA, U.S.A.Figure 12. Metaphase cell hybridized with <strong>FISH</strong> probes. (a) Widefield fluorescencemicroscopy without deconvolution and (b) Widefield fluorescence microscopy withdeconvolution. The chromosomes are seen in blue. The chromosome that is labeled with<strong>FISH</strong> probes shows green and red spots which are sharper in the deconvolved image(right) compared to the image without deconvolution (left). Image courtesy, Peter Franklin,Applied Precision <strong>In</strong>c., Issaquah, WA, U.S.A.86 | Connection 2008
vendors (please refer to: http://www.olympusmicro.com/primer/resources/deconvolutionweb.html and http://www.olympusmicro.com/primer/digitalimaging/deconvolution/deconalgorithms.html. Althoughmost of these methods remain proprietary and the differences betweenvarious algorithms can be difficult to understand at times, they all workto improve the contrast of the image (see Fig. 12a and b). As a user thebest approach is to test different deconvolution algorithms on imagesthat are familiar to you and to assess the performance for yourself.ConclusionThe fluorescent and confocal microscopes are sophisticated instrumentswith enormous potential in solving biological questions. They are fastbecoming the foundation for 21st century biology research. <strong>In</strong> order toutilize the great potential of these fantastic tools, it is important for theuser to be knowledgeable of some of the components that constitutethe microscope as well as understand how it works. We feel that it isimportant to understand the characteristics of objectives, detectors,illumination sources, XYZ stages and other imaging equipment inorder to collect optimal <strong>FISH</strong> images. It is important for the scientiststo understand the components that comprise this technology so thatthey can resolve the cause of poor image quality. We have found thatwhen the equipment does not function optimally one of the componentsoften is not working correctly. Utilization of software remains one of themost important tools that must be mastered to use this technology foroptimum result.The importance of proper instrument and experimental standards toevaluate the machine performance and experimental variables shouldnot be underestimated. We recommend to check for even illumination,PSF, system/laser stability and correct deviations, when necessary,using proper procedures such as fluorescence slides and triple ordouble-labeled fluorescence beads containing defined amounts offluorophores.There is a wealth of information resources online about microscopesand confocal microscopes that has been assembled by Mike Davidsonof Florida State University. It can be accessed on the Web sites of Nikonor Olympus.Basic microscopy and confocal microscopy concepts aredescribed on the following Web site: http://www.olympusmicro.com/primer/techniques/fluorescence/fluorhome.html. <strong>In</strong> addition, the followingWeb site offers basic and advanced microscopy courses: http://www.olympusfluoview.com/resources/courses.html. Central imaging facilitiescan provide more advanced information required for <strong>FISH</strong> imaging andother specific applications.Glossary and AppendixLaser Scanning Confocal Microscope: Afluorescence microscope achieving improveddepth discrimination and contrast by blockingfluorescence that originates outside the planeof focus by use of a ‘confocal’ pinhole.Figure Courtesy:Dr. Jochen Tham.Carl ZeissMicroImaging, <strong>In</strong>c.Epifluorescence Microscope: Anepifluorescent microscope (below)using anobjective lens to perform two tasks: To focuslight upon the specimen being observed andto collect light being emitted by that specimen,which is fluorescent.Epifluorescence Microscope.The diagramshows the working of an upright epifluorescentmicroscope. The excitation beam (black ray)from the arc lamp passes through the excitationfilter and dichroic mirror and directed towardthe specimen.The return beam of emittedfluorescence wavelength (red, green and blackrays) is reflected of the dichroic filter, emissionfilter, ocular and goes to the detector (eye orcamera). Courtesy of Prof. J. Paul Robinson,Ph.D., Director of Purdue University CytometryLaboratory, Purdue University, West Lafayette-IN, USA.Point Spread Function (PSF): If a tinypopulation of 100 nm fluorescent beadssandwiched between a coverslip anda microscope slide are examined at highresolution (i.e. at 100x objective magnification,1.4 NA. and in a correctly matched refractiveindex of oil), it can actually show a tiny set ofrings in the horizontal (XY) view (also calledan airy disk (see Fig. below). This airy diskcannot be avoided due to diffraction andthe wave nature of light. If a specimen isoptically sectioned and projected in a vertical(XZ) view (see Fig. xx), a set of concentricrings will flare from the center. When athree-dimensional image of this specimen iscollected, a complete point spread function issaid to be recorded for each bead. The (PSF)From left to right. Excitation light beam excitesa fluorescent bead. The excited bead emitsfluorescence in all directions. A fraction of theemitted light is collected by microscope lens,filtered and focussed into an image plane whereit appears as an airy disk. Figure modified afterDr. E.H.K.Stelzer. EMBL, Heidelberg Germany.Practical Limits to Resolution in <strong>Fluorescence</strong> LightMicroscopy; Imaging Neurons: A Laboratory Manual.Cold Spring Harbor Laboratory Press. 2000.Connection 2008 | 87
is based on an infinitely small point sourceof light originating in the specimen (i.e. fromeach fluorescent bead) in object space. ThePSF is a description of what happens to eachpoint source of light from that single beadafter it passes through the imaging system.This concept is of fundamental importance tothe process of deconvolution andshould be clearly understood inorder to avoid imaging artifacts.For more details, please refer to:http://www.olympusmicro.com/primer/digitalimaging/deconvolution/deconintro.html.<strong>In</strong> this figure airy disks of fluorescent beadscan be seen in the XY (horizontal) plane (left)and the XZ (vertical) plane (right). Courtesy ofApplied Precision, <strong>In</strong>c., Issaquah, WA, U.S.A.)An Airy disk (named after George BiddellAiry) is the central bright circular region ofthe pattern produced by light diffracted whenpassing through a small circular aperture.The central disk is surrounded by less intenseconcentric rings.ResolutionResolution is defined by the ability todemonstrate contrast between two points.For an animation, please see: http://micro.magnet.fsu.edu/primer/java/imageformation/rayleighdisks.The lateral (XY) and axial (Z) resolutions ina fluorescence microscope are calculatedas: d xy= 0.61 l / NA and d z= 2 (l n/NA 2 ),respectively.Sampling FrequencyA perfect reconstruction of a signal is possiblewhen the sampling frequency is greater thantwice (~ 2.3x) the maximum frequency of thesignal being sampled.Laser Power MeterA laser power meter is used to measure thepower coming form the individual lines usinga 10x lens. The power detector is placed onthe stage, the zoom is set to 10x or higher andthe system is set for bidirectional scanning.The value obtained allows you to determine,if the system is performing properly as powertransmission is related to the alignment andfunction of the system.Laser Power MeasurementFor example,if l = 488 nm and NA = 1.4 NA, thenthe lateral resolution is ~ 212 nm or 0.212μm.if l = 488 nm, NA = 1.4 NA and n = 1.515= refractive index, then the axial resolutionis ~ 754.40 nm or 0.755 μm.Power MeterDetector (UV or Vis.)Government DisclaimerAlthough the research described in this article is supportedby the United States Environmental Protection Agency, it hasnot been subjected to Agency review and, therefore, doesnot necessarily reflect the views of the Agency and no officialendorsement should be inferred. Mention of trade names orcommercial products does not constitute endorsement orrecommendation for use. This report does not necessarilyreflect EPA policy.References1. T. Cremer, P. Lichter, J. Borden, D. C. Ward, and L.Manuelidis (1988). Detection of chromosome aberrationsin metaphase and interphase tumor cells by in situhybridization using chromosome-specific library probes.Hum Genet 80: 235-246.2. Kozubek Michal. Confocal and two-photon microscopy:Foundations, applications, and advances, <strong>FISH</strong> Imaging,pages 389-429. New York: Wiley-Liss, 2001. ISBN:0-471-40920-0.3. Walter J, Joffe B, Bolzer A, Albiez H, Benedetti PA,Müller S, Speicher MR, Cremer T, Cremer M, Solovei I(2006) Towards many colors in <strong>FISH</strong> on 3D-preservedinterphase nuclei. Cytogenet Genome Res 114: 367-378.4. Baerlocher GM, Vulto I, Gary de Jong & Peter MLansdorp PM (2006). Flow cytometry and <strong>FISH</strong> tomeasure the average length of telomeres (flow <strong>FISH</strong>).Nature Protocols 1, 2365 – 2376.5. Zucker, R.M. Rigby P, Clements I; Salmon W, Chua, P.Reliability of Confocal Spectral Imaging Systems: Useof Multispectral Beads. Cytometry V71A: 174-189 2007(COVER).6. Zucker, R.M.<strong>Technical</strong> note: Whole insects andMammalian Embryo Imaging with Confocal Microscopy:Morphology and Apoptosis. Cytometry 2006 69A: 1143-1152 (COVER).7. Zucker, R.M. and Jeffay SC. Confocal Laser ScanningMicroscopy of Whole Mouse Ovaries: ExcellentMorphology with Apoptosis Detection and Spectroscopy.Cytometry 2006 69A August 2006 930-939 (COVER).8. Zucker RM Confocal Slide Based System: Performance.Cytometry 2006 69 A 659-676.9. Zucker RM Confocal Microscopy Slide Based Systems:<strong>In</strong>stability. Cytometry 2006 69A 677-690.10. Zucker RM and Lerner J: Wavelength and Alignment testsfor Confocal Imaging systems Microscopy Research andTechnique. 68:5 307-319 (2005).11. Zucker, R.M. Evaluation of Confocal Microscopy SystemPerformance. Cell Imaging Techniques. Douglas Taajetseditor Humana Press Chapter 5 77-135 2005.12. Hildenbrand G, Rapp A, Spori U, Wagner C, CremerC, Hausmann M (2005). Nano-Sizing of Specific GeneDomains in <strong>In</strong>tact Human Cell Nuclei by SpatiallyModulated Illumination Light Microscopy. BiophysicalJournal 88; 4312–4318.13. Swedlow JR, Hu K, Andrews PD, Roos DS, Murray JM(2002). Measuring tubulin content in toxoplasma gondii:A comparison of laser-scanning confocal and wide-fieldfluorescence microscopy. Proc. Natl. Acad. Sci 99:2014–2019 (2002).14. Itoh H, Miyajima Y, Umemura S, Osamura RY (2008).Lower HER-2/Chromosome Enumeration Probe 17 Ratioin Cytologic HER-2 <strong>Fluorescence</strong> in <strong>Situ</strong> <strong>Hybridization</strong>for Breast Cancers. Three-dimensional Analysis of<strong>In</strong>tranuclear Localization of Centromere 17 and HER-2Signals. Cancer (Cancer Cytopathol) 114:134–40.15. Smallcombe, A. (2001). Multicolor imaging: the importantquestion of co-localization. Biotechniques. 30:1240–1242, 1244–1246.16. North AJ (2006). Seeing is believing? A beginners’ guideto practical pitfalls in image acquisition. J. Cell. Biol.172(1), 9-18.17. Chen, T.; Catryssee, P.; El Gamal, A.; Wandell, B. (2000):How small should pixel size be? Proc. SPIE; vol. 3965;pp. 451-459. Sensors and Camera Systems for Scientific,<strong>In</strong>dustrial, and Digital Photography Applications, MorleyM. Blouke; Nitin Sampat; George M. Williams; ThomasYeh; Eds.18. J Konsti, J Lundin, M Jumppanen, M Lundin, A Viitanenand J Isola (2008). A public-domain image processingtool for automated quantification of fluorescence in situhybridization signals. J. Clin. Pathol. 2008; 61;278-282.19. Rauser S, Weis R, Braselmann H, Feith M, Stein HJ,Langer R, Hutzler P, Hausmann M, Lassmann S, SiewertJR, Hofler H, Werner M, Walch A (2007). Significanceof HER2 Low-Level Copy Gain in Barrett’s Cancer:Implications for <strong>Fluorescence</strong> <strong>In</strong> situ <strong>Hybridization</strong>Testing in Tissues. (Imaging, Diagnosis, Prognosis). ClinCancer Res 2007;5115 13(17).Microscopy Books1. Douglas B. Murphy. Fundamentals of Light Microscopyand Electronic Imaging. Wiley-Liss. 2001.2. Greenfield Sluder and David E. Wolf (Editors). DigitalMicroscopy. A second edition of video microscopy.Elsevier- Academic Press. 2003.3. Alan R. Hibbs. Confocal Microscopy for Biologists.Kluwer Academic Publishers. 2004.4. Robert D. Goldman and David L. Spector (Editors). LiveCell Imaging. A Laboratory Manual. 2005.5. Julian P. Heath. Dictionary of Microscopy. John Wiley &Sons Ltd. 2005.6. James Pawley (Editor). Handbook of Biological ConfocalMicroscopy. Academic Publishers. 2006.7. D. Stephens (Editor). Cell Imaging. Scion Publishing Ltd.2006.88 | Connection 2008