Food-niche overlap between arctic and red foxes
Food-niche overlap between arctic and red foxes
Food-niche overlap between arctic and red foxes

Create successful ePaper yourself
Turn your PDF publications into a flip-book with our unique Google optimized e-Paper software.
1274<strong>Food</strong>-<strong>niche</strong> <strong>overlap</strong> <strong>between</strong> <strong>arctic</strong> <strong>and</strong> <strong>red</strong> <strong>foxes</strong>Bodil Elmhagen, Magnus Tannerfeldt, <strong>and</strong> Anders AngerbjörnAbstract: Arctic <strong>foxes</strong> (Alopex lagopus) in Fennosc<strong>and</strong>ia have retreated to higher altitudes on the mountain tundra,possibly because of increased competition with <strong>red</strong> <strong>foxes</strong> (Vulpes vulpes) at lower altitudes. In this study we comparesummer food <strong>niche</strong>s of the two species in mountain tundra habitat. Arctic <strong>foxes</strong> consumed lemmings more often than<strong>red</strong> <strong>foxes</strong> did, while <strong>red</strong> <strong>foxes</strong> consumed field voles <strong>and</strong> birds more often. Yet despite substantial variation in the dietof each species among summers, food-<strong>niche</strong> <strong>overlap</strong>s <strong>between</strong> the species were consistently high in most summers, as<strong>arctic</strong> <strong>and</strong> <strong>red</strong> <strong>foxes</strong> responded similarly to temporal changes in prey availability. Occurrences of field voles <strong>and</strong> birdsin fox scats were negatively correlated with altitude, while the occurrences of lemmings tended to increase with altitude.Since <strong>arctic</strong> <strong>foxes</strong> b<strong>red</strong> at higher altitudes than <strong>red</strong> <strong>foxes</strong>, the differences <strong>between</strong> <strong>arctic</strong> <strong>and</strong> <strong>red</strong> fox diets werebetter explained by altitudinal segregation than by differences <strong>between</strong> their fundamental food <strong>niche</strong>s. Arctic <strong>foxes</strong>should therefore endeavour to use the more productive hunting grounds at the lower altitudes of their former range, butinterference competition with <strong>red</strong> <strong>foxes</strong> might decrease their access to these areas, <strong>and</strong> consequently cause a decreasein the size of in their realised <strong>niche</strong>.Résumé : En Fennosc<strong>and</strong>ie, les renards arctiques (Alopex lagopus) se sont réfugiés à des altitudes plus élevées dans latoundra de montagne, probablement à cause de la compétition plus gr<strong>and</strong>e des renards roux (Vulpes vulpes) aux altitudesplus faibles. Nous comparons ici les <strong>niche</strong>s alimentaires des deux espèces en été dans la toundra montagneuse. Lesrenards arctiques consomment plus de lemmings que les renards roux, alors que les renards roux capturent plus decampagnols des champs et d’oiseaux. Pourtant, en dépit de la variation importante dans le régime alimentaire des deuxespèces d’un été à l’autre, les <strong>niche</strong>s alimentaires des deux espèces se chevauchent considérablement la plupart desétés, alors que les animaux des deux espèces ont des réactions semblables aux variations temporelles dans la disponibilitédes proies. La présence de campagnols des champs ou d’oiseaux dans les fèces des renards est en corrélation négativeavec l’altitude, alors que la présence des lemmings a tendance à augmenter avec l’altitude. Étant donné que lesrenards arctiques se reproduisent à des altitudes plus élevées que les renards roux, les différences entre les régimes alimentairesdes deux espèces s’expliquent plutôt par la ségrégation spatiale que par des différences dans les <strong>niche</strong>s alimentairesfondamentales. Les renards arctiques auraient donc intérêt à chercher à utiliser les zones productives dechasse aux altitudes plus basses qu’ils occupaient auparavant, mais la compétition d’interférence avec les renards rouxpourrait limiter leur accès à ces zones, et conséquemment, causer une diminution de leur <strong>niche</strong> réalisée.[Traduit par la Rédaction] 1285IntroductionElmhagen et al.Competition is usually classified as either exploitative orinterference (Park 1962). Interspecific competition can influencehabitat use <strong>and</strong> a superior species may exclude an inferiorone from parts of its fundamental <strong>niche</strong> or, in extremecases, make it go extinct. The <strong>arctic</strong> fox (Alopex lagopus)has a circumpolar distribution covering the <strong>arctic</strong> tundra ofNorth America <strong>and</strong> Eurasia, the Fennosc<strong>and</strong>ian mountaintundra, Greenl<strong>and</strong>, <strong>and</strong> Icel<strong>and</strong> (Macpherson 1969). The <strong>red</strong>fox (Vulpes vulpes) is distributed through North America,Europe, <strong>and</strong> Russia, but does not penetrate the High Arctic(Larivière <strong>and</strong> Pasitschniak-Arts 1996). Consequently, <strong>arctic</strong><strong>and</strong> <strong>red</strong> <strong>foxes</strong> are sympatric in a relatively narrow <strong>overlap</strong>zone in the Low Arctic. The <strong>red</strong> fox is larger than the <strong>arctic</strong>Received 22 January 2002. Accepted 27 June 2002. Publishedon the NRC Research Press Web site at http://cjz.nrc.ca on23 August 2002.B. Elmhagen, 1 M. Tannerfeldt, <strong>and</strong> A. Angerbjörn.Department of Zoology, Stockholm University, Stockholm,Sweden S-106 91.1 Corresponding author (e-mail: Bodil.Elmhagen@zoologi.su.se).fox <strong>and</strong> the northern distribution limit of the <strong>red</strong> fox couldbe determined by resource availability, while the southerndistribution limit of the <strong>arctic</strong> fox could be determined byinterspecific competition with the <strong>red</strong> fox (Hersteinsson <strong>and</strong>Macdonald 1982, 1992).During the last century, the <strong>red</strong> fox spread northwards inNorth America <strong>and</strong> Russia (Marsh 1938; Macpherson 1964;Chirkova 1968), <strong>and</strong> the number of <strong>red</strong> <strong>foxes</strong> increased onthe mountain tundra in Fennosc<strong>and</strong>ia (Østbye et al. 1978;Kaikusalo <strong>and</strong> Angerbjörn 1995). In Fennosc<strong>and</strong>ia there isalso evidence of a concurrent <strong>red</strong>istribution of the <strong>arctic</strong> fox.It has retreated to peripheral areas <strong>and</strong> dens at higher altitudeswithin its former range (Østbye et al. 1978; Linnell etal. 1999; Dalerum et al. 2002; Tannerfeldt et al. 2002). Atthe beginning of the 20th century the Fennosc<strong>and</strong>ian <strong>arctic</strong>fox population declined drastically as a result of hunting(Lönnberg 1927). The population has not recove<strong>red</strong>, despitecomplete protection since 1940, <strong>and</strong> increased competitionwith <strong>red</strong> <strong>foxes</strong> might have contributed to the non-recovery(Hersteinsson et al. 1989). However, <strong>niche</strong> <strong>overlap</strong> is a prerequisitefor competition. If <strong>arctic</strong> <strong>and</strong> <strong>red</strong> <strong>foxes</strong> have differenthabitat or prey preferences, the <strong>red</strong>istribution could haveresulted instead from changes in the distribution of prey orother changes in the environment (Chirkova 1968; Linnell etCan. J. Zool. 80: 1274–1285 (2002) DOI: 10.1139/Z02-108 © 2002 NRC Canada
Elmhagen et al. 1275al. 1999). To assess the importance of competition <strong>between</strong><strong>arctic</strong> <strong>and</strong> <strong>red</strong> <strong>foxes</strong>, it is therefore necessary to study their<strong>niche</strong> <strong>overlap</strong>, <strong>and</strong> food <strong>niche</strong> is one dimension.Arctic <strong>foxes</strong> in Fennosc<strong>and</strong>ia <strong>and</strong> other inl<strong>and</strong> habitatstypically use lemmings as their primary prey, but they alsoinclude voles, birds, eggs, hares, insects, berries, <strong>and</strong> carcassesof reindeer or caribou (Rangifer tar<strong>and</strong>us) in theirdiet (Macpherson 1969; Angerbjörn et al. 1999; Str<strong>and</strong> et al.1999; Dalerum <strong>and</strong> Angerbjörn 2000; Elmhagen et al. 2000).Voles are usually the most important prey for <strong>red</strong> <strong>foxes</strong>in Sweden <strong>and</strong> northern Europe, but birds, eggs, roe deer(Capreolus capreolus), lagomorphs, insects, fruit, <strong>and</strong> berriesare also fed upon (Englund 1965; Lindström 1989; Goszczynski1974; Leckie et al. 1998; O’Mahony et al. 1999). In a review,Hersteinsson <strong>and</strong> Macdonald (1982) concluded thatboth <strong>arctic</strong> <strong>and</strong> <strong>red</strong> <strong>foxes</strong> are highly opportunistic, <strong>and</strong> suggestedthat the more limited prey base in <strong>arctic</strong> areas is theonly reason why <strong>arctic</strong> fox populations often have a less varieddiet than <strong>red</strong> fox populations. This assumption is supportedby the results of a feeding experiment in which <strong>foxes</strong>could choose <strong>between</strong> already dead prey of different species:neither <strong>red</strong> <strong>foxes</strong> nor <strong>arctic</strong> <strong>foxes</strong> showed a preference forvoles or lemmings (Barth et al. 2000). On the contrary, threedietary studies involving sympatric <strong>arctic</strong> <strong>and</strong> <strong>red</strong> <strong>foxes</strong> showedthat <strong>arctic</strong> <strong>foxes</strong> generally eat more lemmings <strong>and</strong> fewervoles than <strong>red</strong> <strong>foxes</strong> do, <strong>and</strong> it was suggested that <strong>red</strong> <strong>foxes</strong>could be more generalistic feeders (Smits et al. 1989; Frafjord1995; Frafjord 2000). However, the samples in the two earlierstudies were very small <strong>and</strong> none of the studies providedany data on prey availability. Thus, it is not possible to determinewith certainty what causes the observed dietary differences.Either <strong>arctic</strong> <strong>and</strong> <strong>red</strong> <strong>foxes</strong> could have differenthunting behaviours that result in different prey preferences,or they could be segregated on a small spatial scale <strong>and</strong>therefore have access to different prey bases in areas wherethey are regarded as sympatric. Differences in prey preferencesindicate that there is food-<strong>niche</strong> separation <strong>between</strong>the fox species <strong>and</strong> that competition may be of less importance.However, if there are no fundamental food-<strong>niche</strong> differences,spatial segregation could result from interspecificcompetition.The best way to determine if two species compete is tocompare “actual” <strong>and</strong> “virtual” <strong>niche</strong> <strong>overlap</strong>s, these beingthe local population equivalents of the realised <strong>and</strong> fundamental<strong>niche</strong>s of an entire species (Colwell <strong>and</strong> Futuyma1970). For example, food competition <strong>between</strong> mink (Mustelavision) <strong>and</strong> otter (Lutra lutra) was investigated throughcomparisons of food-<strong>niche</strong> breadths <strong>and</strong> food-<strong>niche</strong> <strong>overlap</strong>sunder sympatric <strong>and</strong> allopatric conditions (Clode <strong>and</strong> Macdonald1995). In Fennosc<strong>and</strong>ia there are no areas of mountaintundra where <strong>red</strong> <strong>foxes</strong> are absent to the extent that wecould study the “virtual diet” of the <strong>arctic</strong> fox. However, wecan test whether there is small-scale spatial segregation <strong>between</strong>the species with respect to altitude, an important habitatvariable. Further, lemming <strong>and</strong> vole populations fluctuateover time <strong>and</strong> relative abundances change from year to yearat all altitudes (Oksanen et al. 1999). Thus, we can alsostudy how <strong>arctic</strong> <strong>and</strong> <strong>red</strong> <strong>foxes</strong> respond to differences in preyspecies composition. If there are species-specific differencesin prey preferences, i.e., if <strong>arctic</strong> <strong>and</strong> <strong>red</strong> <strong>foxes</strong> have differenthunting behaviours, they will respond differently to changesin the composition of the prey community. Consequently,the degree of <strong>niche</strong> <strong>overlap</strong> will vary <strong>between</strong> years. If, instead,they use prey similarly, <strong>niche</strong> <strong>overlap</strong>s should be relativelyconstant in time. There are four possible scenariosdepending on the existence of spatial segregation <strong>and</strong> (or)species-specific prey use: (1) No spatial segregation, no differencesin prey preferences: <strong>arctic</strong> <strong>and</strong> <strong>red</strong> <strong>foxes</strong> have thesame diets, i.e., food-<strong>niche</strong> <strong>overlap</strong> is 100%. (2) No spatialsegregation, different prey preferences: <strong>arctic</strong> <strong>and</strong> <strong>red</strong> <strong>foxes</strong>have different diets <strong>and</strong> the degree of food-<strong>niche</strong> <strong>overlap</strong>changes <strong>between</strong> years. (3) Spatial segregation, no differencesin prey preferences: <strong>arctic</strong> <strong>and</strong> <strong>red</strong> <strong>foxes</strong> have differentdiets, owing to differences in the composition of the preycommunity at different altitudes, but the degree of food<strong>niche</strong><strong>overlap</strong> is consistent <strong>between</strong> years. (4) Spatial segregation,different prey preferences: <strong>arctic</strong> <strong>and</strong> <strong>red</strong> <strong>foxes</strong> havedifferent diets <strong>and</strong> the degree of food-<strong>niche</strong> <strong>overlap</strong> changes<strong>between</strong> years.In this study we investigated the summer diets of sympatric<strong>arctic</strong> <strong>and</strong> <strong>red</strong> <strong>foxes</strong> over 4 years to find out which scenariois enacted on the Fennosc<strong>and</strong>ian mountain tundra. We testfor dietary differences <strong>between</strong> <strong>arctic</strong> <strong>and</strong> <strong>red</strong> <strong>foxes</strong>, foraltitudinal segregation <strong>between</strong> these species, <strong>and</strong> for an effectof altitude on the occurrence of different prey species intheir diets. We also study whether food-<strong>niche</strong> <strong>overlap</strong> <strong>and</strong>food-<strong>niche</strong> breadth change <strong>between</strong> years. Finally, we discussthe implications of <strong>arctic</strong> <strong>and</strong> <strong>red</strong> fox food <strong>niche</strong>s forthe degree of interspecific competition.Materials <strong>and</strong> methodsStudy areaThe study area cove<strong>red</strong> 1300 km 2 of mountain tundra inthe Vindelfjällen Nature Reserve in Swedish Lapl<strong>and</strong> (66°N,16°E). The main vegetation types were dry heath, grass heath,<strong>and</strong> dry fen. Plant-species diversity was low, except for somerelatively rich patches (Rune 1981). Arctic <strong>foxes</strong> b<strong>red</strong> onlyabove the tree line, which was situated at 750 m asl. Most<strong>red</strong> <strong>foxes</strong> breed below the tree line, in birch <strong>and</strong> coniferousforests, but all <strong>red</strong> <strong>foxes</strong> included in this study inhabited former<strong>arctic</strong> fox dens on the mountain tundra. These dens arehereinafter refer<strong>red</strong> to as <strong>red</strong> fox dens. Prey species availableto the <strong>foxes</strong> were Norwegian lemming (Lemmus lemmus), fieldvole (Microtus agrestis), bank vole (Clethrionomys glareolus),grey-sided vole (Clethrionomys rufocanus), shrews (Sorex spp.),mountain hare (Lepus timidus), reindeer, rock ptarmigan(Lagopus mutus), willow ptarmigan (Lagopus lagopus), passerines(Passeriformes), ducks (Anseriformes), gulls, <strong>and</strong> waders(Charadriiformes).Lemming <strong>and</strong> vole populations are generally cyclic in <strong>arctic</strong><strong>and</strong> mountain tundra areas (Elton 1924; Hanski et al.1991; Angerbjörn et al. 2001), but there have been occasionalprolonged interruptions in the cycle in Fennosc<strong>and</strong>ia(Angerbjörn et al. 2001). During these, lemming populationsfluctuate with a periodicity resembling the normal cycle, butthe amplitude is smaller than usual. The interruptions havetherefore been described as periods without peak years, sincethe highest lemming densities are about 10 times lower th<strong>and</strong>uring “real” peaks (Angerbjörn et al. 2001; Tannerfeldt etal. 2002). The last lemming peak in Sweden occur<strong>red</strong> in1982, consequently our study was carried out during one of© 2002 NRC Canada
1276 Can. J. Zool. Vol. 80, 2002these periods. However, trapping data from our study areashowed that lemming abundance fluctuated <strong>between</strong> years<strong>and</strong> the highest summer density was at least 20 times higherthan during population low phases (Ecke et al. 2001). Theabundance of nesting birds does not change significantly <strong>between</strong>years, although nesting success can vary (Svensson etal. 1984). We have no information on fluctuations in thereindeer <strong>and</strong> hare populations. Other p<strong>red</strong>ators in the areathat could interact with the fox species were wolverines(Gulo gulo) <strong>and</strong> golden eagles (Aquila chrysaëtos).Collection of scats <strong>and</strong> scat analysisWe have surveyed <strong>arctic</strong> fox dens in our study area since1985. We regard a den as inhabited when we observe foxcubs <strong>and</strong> (or) adult <strong>foxes</strong> regularly returning to <strong>and</strong> stayingat it. We also regard a den as inhabited when the amount offresh scats, prey remains, recently excavated openings, <strong>and</strong>wear <strong>and</strong> tear on the vegetation surrounding the openings indicatesthat the den is used to this extent, even though no<strong>foxes</strong> are seen. Arctic <strong>and</strong> <strong>red</strong> fox families occasionally moveduring summer (Tannerfeldt et al. 2002). In such cases weonly used scats from one of the dens in our analyses. Thus,within the same summer, scats collected at different densrepresent different <strong>foxes</strong>.In the summers of 1993 <strong>and</strong> 1996–1998, we collectedscats from all dens inhabited by <strong>arctic</strong> or <strong>red</strong> <strong>foxes</strong>. Lemmingnest counts <strong>and</strong> snap-trapping data showed that thelemming population was in the low phase in 1993, increasedin 1996, decreased (crashed) in 1997, <strong>and</strong> remained low in1998 (Ecke et al. 2001; Tannerfeldt et al. 2002). Scats werealso collected in 1994 <strong>and</strong> 1995, but most were unfortunatelylost during storage, owing to a non-underst<strong>and</strong>ingmother. Most of the <strong>arctic</strong> fox scats collected in 1996 <strong>and</strong>1997 were also included in an earlier study on <strong>arctic</strong> fox diet(Elmhagen et al. 2000).We separated fresh scats, i.e., collected during the currentsummer, from older ones by their colour, position in the vegetation,<strong>and</strong> smell (Macpherson 1969; Birks <strong>and</strong> Penford1990). We made visual observations of <strong>foxes</strong> at all <strong>arctic</strong> foxdens but at only 6 of 10 <strong>red</strong> fox dens. When we did not seeany <strong>foxes</strong>, we relied on the presence of tracks <strong>and</strong> fur <strong>and</strong>the size of openings of newly excavated dens to determinewhich species used the den. We collected scats only at inhabiteddens, so there was little risk of confusing <strong>arctic</strong> <strong>and</strong><strong>red</strong> fox scats. There were cubs in all dens where we saw<strong>foxes</strong>, except in 1997, when the lemming population was inthe crash phase. In that year, one cub that died early wasseen at one of three dens inhabited by <strong>arctic</strong> <strong>foxes</strong>, whilethere were cubs at one of two dens inhabited by <strong>red</strong> <strong>foxes</strong>.There can be differences <strong>between</strong> the prey eaten by adult<strong>foxes</strong> themselves <strong>and</strong> those they bring to their cubs (Lindström1994). However, Frafjord (2000) found only one significantdifference in <strong>foxes</strong>’ diets <strong>between</strong> dens with <strong>and</strong> withoutcubs: insects occur<strong>red</strong> more often in scats from <strong>red</strong> fox denswith cubs, though insects were not an important prey item.We therefore assumed that the scats from each den gave afair representation of the prey caught by the adult <strong>foxes</strong>, independentlyof the proportion of adult to juvenile scats.Scats were dried at 105°C prior to analysis. Small or fragmentedscats were combined, so the analysed volume ofeach sample was approximately that of one medium-sizedscat. Such samples are hereinafter refer<strong>red</strong> to as single scats.When more than 20 scats had been collected from a den, wer<strong>and</strong>omly picked 20 for analysis. The total sample consistedof 293 <strong>arctic</strong> fox scats <strong>and</strong> 177 <strong>red</strong> fox scats from 15 <strong>and</strong> 9dens, respectively.We fragmented individual scats by h<strong>and</strong> under a magnifyingglass. We noted occurrences of different prey items <strong>and</strong>estimated the percent dry volume of mammal fur <strong>and</strong> bones,feathers, eggshells, insects, <strong>and</strong> vegetation by eye. We convertedthese volume estimates to “whole-scat equivalents” asdescribed by Angerbjörn et al. (1999). We summarized thepercent volumes of each food category in the scats collectedat the same den.Fur was identified as reindeer, hare, fox, or small mammalby means of a reference collection <strong>and</strong> microscopic charactersdescribed by Day (1966). We igno<strong>red</strong> single fox hairs<strong>and</strong> small tufts of fox hair that probably resulted from grooming.We determined lemming <strong>and</strong> vole species using descriptionsof molars in Niethammer <strong>and</strong> Krapp (1982). We didnot distinguish <strong>between</strong> bank vole <strong>and</strong> grey-sided vole, butused the category Clethrionomys spp. Shrews were also identifiedby the presence of teeth, but we did not discriminate<strong>between</strong> species. When teeth from more than one smallmammalspecies were found in the same scat, we used thenumber of teeth from each species to partition the volumesof fur <strong>and</strong> small-mammal bones among them. When therewere no teeth in a scat, small-mammal fur was classified as“unidentified small mammals” (Tables 1 <strong>and</strong> 3). For estimatingvolume, calculating <strong>niche</strong> <strong>overlap</strong> <strong>and</strong> <strong>niche</strong> breadth, <strong>and</strong>correlating the frequencies of occurrence of different preyitems with altitude, we assumed that the total volumes ofunidentified small mammals in the scats were in the sameproportions as the total volumes of small-mammal specieswhich had been identified at each den (Figs. 1 <strong>and</strong> 2, Table4). Consequently, unidentified small mammals were distributedin these categories accordingly.During the analyses we noted that teeth from small mammalsoccur<strong>red</strong> less frequently relative to the presence ofsmall-mammal fur in some years, <strong>and</strong> generally less often in<strong>red</strong> fox scats than in <strong>arctic</strong> fox scats (Tables 1 <strong>and</strong> 3). Thisappea<strong>red</strong> to be related to the proportion of voles to lemmings.If <strong>foxes</strong> h<strong>and</strong>le lemmings differently from voles, theuse of teeth for estimating proportions of different smallmammals in the scats could result in a bias. However, if it isappropriate to use this method, the estimated proportions oflemmings, voles, <strong>and</strong> shrews should be approximately thesame if fur is used for identification. The fur of the Norwegianlemming is largely black <strong>and</strong> yellow, while the fur ofvoles <strong>and</strong> shrews is brown or greyish. We made coarse estimatesof the proportions of lemming <strong>and</strong> vole/shrew fur in25% steps from 0 to 100% for each scat. We compa<strong>red</strong> theresults obtained through identifying teeth (where unidentifiedsmall mammals were distributed in the categories ofidentified small-mammal species) with the estimates obtainedfrom fur using Spearman’s rank-correlation tests, where eachden was treated as one unit. The two methods gave very similarresults, with significant correlations for both <strong>arctic</strong> <strong>foxes</strong>(lemmings: p < 0.001, r S = 0.85, n = 15; voles/shrews: p
Elmhagen et al. 1277Table 1. The diets of <strong>arctic</strong> <strong>foxes</strong> (Alopex lagopus) <strong>and</strong> <strong>red</strong> <strong>foxes</strong> (Vulpes vulpes) in the Vindelfjällen Nature Reserve in different years.Arctic <strong>foxes</strong> Red <strong>foxes</strong>1993(n = 15, 1 den)1996(n = 139, 7 dens)1997(n = 60, 3 dens)1998(n = 79, 4 dens)1993(n = 20, 1 den)1996(n = 18, 1 den)1997(n = 40, 2 dens)1998(n = 99, 5 dens)WSE Frequency WSE Frequency WSE Frequency WSE Frequency WSE Frequency WSE Frequency WSE Frequency WSE FrequencySmall mammals 66.7 86.7 92.8 98.6 88.3 100 87.3 88.6 50.0 80.0 94.4 100 92.5 100 82.8 99.0Lemmus lemmus 13.3 20.0 83.5 91.4 83.3 90.0 31.6 51.9 15.0 20.0 50.0 72.2 30.0 40.0 12.1 24.2Microtus agrestis 6.7 6.7 1.4 3.6 — — 29.1 44.3 5.0 5.0 11.1 22.2 35.0 42.5 29.3 49.5Clethrionomys spp. — — — — — — 2.5 5.1 — — 5.6 11.1 — 2.5 3.0 9.1Sorex spp. — 6.7 — — — — 2.5 5.1 — — — — — — — —Unidentified 46.7 66.7 7.9 10.8 5.0 10.0 21.5 34.2 30.0 60.0 27.8 44.4 27.5 32.5 38.4 60.6Birds 13.3 66.7 1.4 27.3 3.3 26.7 12.7 65.8 10.0 35.0 5.6 83.3 5.0 60.0 11.1 76.8Passeriformes 13.3 53.3 1.4 12.9 3.3 8.3 5.1 32.9 10.0 20.0 5.6 66.7 2.5 17.5 3.0 22.2Galliformes — 13.3 — — — 1.7 1.3 8.9 — 5.0 — 5.6 — 10.0 3.0 13.1Anseriformes — — — — — — 1.3 1.3 — — — — — 5.0 — —Unidentified — 6.7 — 13.7 — 16.7 3.8 19.0 — 15.0 — 16.7 2.5 27.5 5.1 32.3Reindeer (R. tar<strong>and</strong>us) 20.0 46.7 0.7 7.2 1.7 23.3 — 19.0 40.0 65.0 — 11.1 2.5 15.0 2.0 14.1Other mammals — — 2.2 2.9 — — — — — 5.0 — — — 5.0 3.0 4.0Lepus timidus — — — — — — — — — 5.0 — — — — 1,0 1.0Red fox or <strong>arctic</strong> fox* — — 2.2 2.9 — — — — — — — — — — 2,0 3.0Unidentified — — — — — — — — — — — — — 5.0 — —Eggshells — — — 0.7 — 3.3 — 2.5 — — — — — — — 1.0Insects — 13.3 — 13.7 1.7 18.3 — 15.2 — 5.0 — 16.7 — 12.5 — 10.1Vegetation — 73.3 2.9 76.3 5.0 70.0 — 70.9 — 70.0 — 66.7 — 77.5 — 76.8Note: Values shown are percent whole-scat equivalents (WSE) <strong>and</strong> percent frequency of occurrence. WSE is a measure that takes the volume of prey remains from each fox species into account. InFigs. 1 <strong>and</strong> 2, unidentified small mammals are distributed among categories of small-mammal species in the proportions suggested by the identified material.*We igno<strong>red</strong> single fox hairs or small tufts of fox hair that probably resulted from grooming. The larger quantities of fox hairs included in the table occur<strong>red</strong> once for each fox species. In both yearsthe fur appea<strong>red</strong> to be from cubs <strong>and</strong> the colours indicated that it resulted from cannibalism.© 2002 NRC Canada
1278 Can. J. Zool. Vol. 80, 2002Table 2. <strong>Food</strong>-<strong>niche</strong> <strong>overlap</strong>s <strong>and</strong> food-<strong>niche</strong> breadths for 1993<strong>and</strong> 1996–1998, calculated from the volumes of prey items in thescats (see Fig. 1).1993 1996 1997 1998<strong>Food</strong>-<strong>niche</strong> <strong>overlap</strong>Percent <strong>overlap</strong> 79.6 79.6 44.2 75.1Horn’s index 0.93 0.92 0.63 0.93<strong>Food</strong>-<strong>niche</strong> breadthArctic fox 0.41 0.026 0.023 0.33Red fox 0.33 0.12 0.20 0.29Lemming phase Low Increase Crash LowLemming index — 0.94 0.25 0.01Field vole index — 0.88 0.41 0.22Note: Lemming <strong>and</strong> vole indices show the number of animals trappedper 100 trap-nights in our study area (data from Ecke et al. 2001).are eaten in the same way by the <strong>foxes</strong> <strong>and</strong> that the numbersof teeth in the scats are proportional to the ingested proportionsof voles <strong>and</strong> lemmings. This assumption is also supportedby Lockie’s (1959) feeding experiment with <strong>red</strong><strong>foxes</strong>, where the number of teeth of different small-mammalspecies in the scats was proportional to the ingested proportionof each species. Thus, the method described above shouldnot yield a biased result.We identified bird feathers to the orders Passeriformes,Galliformes, <strong>and</strong> Anseriformes using the keys of Brom (1986)<strong>and</strong> Day (1966). According to these keys, Charadriiformescan be identified through the absence of some characters thatdistinguish Passeriformes. However, the number of feathersin the scats was generally low <strong>and</strong> the feathers were in poorcondition. Absence of characters could be caused by degradationof the feathers during digestion, therefore we did notattempt to identify Charadriiformes. We did not include microscopicfragments when we estimated percent dry volumefor each prey category, but we sometimes used them to identifybird orders when macroscopic remains were present. Wedid not attempt to further classify eggshells, insects, or plantmaterial.We used log-linear likelihood tests on frequency of occurrencedata to test for dietary differences <strong>between</strong> <strong>arctic</strong> <strong>and</strong><strong>red</strong> <strong>foxes</strong>, as recommended by Reynolds <strong>and</strong> Aebischer (1991).We could test thereby the separate effects of fox species <strong>and</strong>year on each dietary category. Owing to the large number ofcomparisons (12 dietary categories), we adjusted the level ofsignificance to 0.0042 with a Bonferroni correction. We pooledthe scats from each species <strong>and</strong> year. In years when morethan one den was represented in the sample, there were always19 or 20 scats from each den. Thus, there was no biastowards any particular den.<strong>Food</strong>-<strong>niche</strong> <strong>overlap</strong> <strong>and</strong> food-<strong>niche</strong> breadthThere has been much controversy over how to measure<strong>niche</strong> <strong>overlap</strong> (Abrams 1980; Krebs 1989). Percent <strong>overlap</strong>(Schoener’s measure) is the most commonly used (Schoener1970; Krebs 1989) <strong>and</strong> is recommended by Abrams (1980).However, Schoener’s measure is sensitive to unequal samplesizes <strong>and</strong> Horn’s index may be a better alternative in suchcases (Krebs 1989). To estimate food-<strong>niche</strong> <strong>overlap</strong>, we thereforecalculated both percent <strong>overlap</strong> (p jk ), <strong>and</strong> Horn’s index(R 0 ), i.e., the <strong>overlap</strong>s <strong>between</strong> species j <strong>and</strong> k, where p ij <strong>and</strong>p ik are the proportions of resource i in the diets of the species,<strong>and</strong> there are n different resources.R0=∑⎡ n⎤p jk = ⎢pij p ⎥ik⎣⎢∑ ( minimum , ) 100⎦⎥( p + p ) log( p + p ) −∑p log p −∑ p log p2 log 2ij ik ij ik ij ij ik ikFor each year we calculated food-<strong>niche</strong> <strong>overlap</strong> from theaverage volumes of prey remains in the scats. Three preycategories, eggs, insects, <strong>and</strong> vegetation, were present onlyin trace amounts <strong>and</strong> other studies have shown that they areof negligible importance in fox diets in this area (Elmhagenet al. 2000; Frafjord 2000). If there are many resource states,<strong>niche</strong> <strong>overlap</strong>s become biased (Smith <strong>and</strong> Zaret 1982). Forthese two reasons we excluded eggs, insects, <strong>and</strong> vegetationfrom the calculations. Fox was also excluded. Large volumesof fox hairs were found in scats at one <strong>red</strong> <strong>and</strong> one <strong>arctic</strong> foxden, but the hair colours indicated that they had resultedfrom cannibalism. Consumption of already dead cubs hasbeen observed earlier in <strong>arctic</strong> <strong>foxes</strong> (Frafjord 1993; Dalerum<strong>and</strong> Angerbjörn 2000). Dead cubs are a food resource forsurviving siblings <strong>and</strong> their parents, but they are not prey inthe same sense as other species are.To compare the dietary variation <strong>between</strong> species with thevariation within species each summer, we did pairwise calculationsof food-<strong>niche</strong> <strong>overlap</strong> <strong>between</strong> dens inhabited by<strong>arctic</strong> <strong>and</strong> <strong>red</strong> <strong>foxes</strong>. Only years with more than one den inthe sample could be included. Because sample sizes werethe same at each den, we calculated only percent <strong>overlap</strong>.We then calculated the average food-<strong>niche</strong> <strong>overlap</strong> withineach species each year. We also did pairwise calculations offood-<strong>niche</strong> <strong>overlap</strong> <strong>between</strong> years within <strong>and</strong> <strong>between</strong> species.Sample sizes varied among years, so we calculatedboth percent <strong>overlap</strong> <strong>and</strong> Horn’s index.Niche breadth is a measure of the degree of specializationof a species, <strong>and</strong> to estimate food-<strong>niche</strong> breadth, we usedLevin’s measure, B A , st<strong>and</strong>ardized on a scale from 0 to 1,where p i is the proportion of resource i in a diet consistingof n resources (Hurlbert 1978; Krebs 1989):BA =⎡⎢⎛ ⎢⎜⎣⎝∑1p2i⎞ ⎤n⎟ − 1⎥( − 1)⎠ ⎥⎦For each year we calculated food-<strong>niche</strong> breadth from theaverage volumes of prey remains in the scats. We includedthe same prey categories as for calculations of food-<strong>niche</strong><strong>overlap</strong>.Effect of altitudeWe tested for a difference in altitude <strong>between</strong> the <strong>arctic</strong><strong>and</strong> <strong>red</strong> fox dens included in this study (logistic regression).We also performed Spearman’s rank-correlation tests to comparethe frequencies of occurrence of the most importantprey species with altitude.ResultsSmall mammals, particularly lemmings <strong>and</strong> field voles,were the most important prey of both <strong>arctic</strong> <strong>and</strong> <strong>red</strong> <strong>foxes</strong>,© 2002 NRC Canada
Elmhagen et al. 1279Table 3. The separate effects (partial associations) of fox species <strong>and</strong> year on the occurrenceof different prey categories in a log-linear likelihood test.Prey category Effect df χ 2 pSmall mammals (total) Year 3 21.7
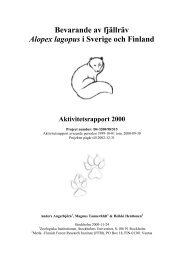
1280 Can. J. Zool. Vol. 80, 2002Fig. 1. The diets of <strong>arctic</strong> <strong>foxes</strong> (Alopex lagopus) (a) <strong>and</strong> <strong>red</strong> <strong>foxes</strong> (Vulpes vulpes) (b) in different summers. Unidentified remains ofsmall mammals (see Table 1) are distributed among categories of identified small-mammal species according to the distribution ofthose species in the scats.often in <strong>arctic</strong> fox scats than in <strong>red</strong> fox scats in 1993, whilethe reverse was true in other years (Tables 1 <strong>and</strong> 3). Passerines,ptarmigans, <strong>and</strong> ducks were all utilized by both foxspecies. Passerines were consumed most often, while duckswere eaten on only a few occasions. On average, <strong>red</strong> <strong>and</strong><strong>arctic</strong> <strong>foxes</strong> ate passerines equally often. However, <strong>red</strong> <strong>foxes</strong>ate passerines more often than <strong>arctic</strong> <strong>foxes</strong> did in 2 years,while the reverse was true in the other 2 years. Therefore,the three-way interaction <strong>between</strong> year, species, <strong>and</strong> passerineswas significant, although there were no significant twowayinteractions. There were no effects of fox species oryear on the occurrence of ptarmigan <strong>and</strong> ducks in the scats(Tables 1 <strong>and</strong> 3).There were no effects of fox species or year on the occurrenceof eggshells, insects, or vegetation in the scats (p >0.28). Eggshells <strong>and</strong> insects occur<strong>red</strong> infrequently <strong>and</strong> innegligible volumes. Vegetation occur<strong>red</strong> frequently in thescats, but only in trace amounts (Table 1).To summarize, there were three important differences <strong>between</strong><strong>arctic</strong> <strong>and</strong> <strong>red</strong> fox diets: lemmings occur<strong>red</strong> more oftenin the diet of <strong>arctic</strong> <strong>foxes</strong>, while field voles <strong>and</strong> birdsoccur<strong>red</strong> more often in the diet of <strong>red</strong> <strong>foxes</strong>. However, thesummer diets of both species varied over time <strong>and</strong> the frequenciesof occurrence of lemmings, field voles, reindeer,<strong>and</strong> birds in the diets varied significantly among years.<strong>Food</strong>-<strong>niche</strong> breadth <strong>and</strong> food-<strong>niche</strong> <strong>overlap</strong>The diets of both fox species varied considerably amongyears <strong>and</strong> this was reflected by large variations in food-<strong>niche</strong><strong>overlap</strong> within species among years. The average percent© 2002 NRC Canada
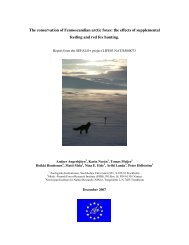
Elmhagen et al. 1281Fig. 2. Frequencies of occurrence of different prey species at<strong>arctic</strong> <strong>and</strong> <strong>red</strong> fox dens at different altitudes. Solid symbols denotedens inhabited by <strong>arctic</strong> <strong>foxes</strong> <strong>and</strong> open symbols denotedens inhabited by <strong>red</strong> <strong>foxes</strong>. For the two species <strong>and</strong> all yearscombined, there was a tendency towards a positive correlation<strong>between</strong> altitude <strong>and</strong> occurrence of lemmings (a), but there weresignificant negative correlations <strong>between</strong> altitude <strong>and</strong> occurrenceof field voles (b) <strong>and</strong> birds (c).100806040200100806040200100806040200(a)199319961997800 850 900 950 1000 1050 1100(b)199319961997800 850 900 950 1000 1050 1100(c)199319961997800 850 900 950 1000 1050 1100<strong>overlap</strong> <strong>between</strong> summers was 60.8% for <strong>arctic</strong> <strong>foxes</strong> <strong>and</strong>58.5% for <strong>red</strong> <strong>foxes</strong> (Table 4). Using Horn’s index, the averagefor <strong>arctic</strong> <strong>foxes</strong> was 0.79 (range 0.68–0.98). The averagefor <strong>red</strong> <strong>foxes</strong> was also 0.79 (range 0.68–0.93). Nevertheless,food-<strong>niche</strong> <strong>overlap</strong> <strong>between</strong> <strong>arctic</strong> <strong>and</strong> <strong>red</strong> <strong>foxes</strong> was consistentlyhigh in three out of four summers (percent <strong>overlap</strong>75.1–79.6%; Horn’s index 0.92–0.93), with a smaller <strong>overlap</strong>in 1997 (44.2% <strong>and</strong> 0.63, respectively; Fig. 1, Tables 2<strong>and</strong> 4). In 1997, however, food-<strong>niche</strong> <strong>overlap</strong> was smallerwithin <strong>red</strong> <strong>foxes</strong> than <strong>between</strong> <strong>arctic</strong> <strong>and</strong> <strong>red</strong> <strong>foxes</strong>. The<strong>overlap</strong> within <strong>arctic</strong> <strong>foxes</strong> seemed to be higher than <strong>between</strong>species when the lemming population was in the increase<strong>and</strong> crash phases, while <strong>overlap</strong>s within <strong>and</strong> <strong>between</strong>species were similar during the lemming low phase in 1998(Table 4).Arctic <strong>foxes</strong> had narrower food-<strong>niche</strong> breadths than <strong>red</strong><strong>foxes</strong> during the lemming increase <strong>and</strong> crash phases (1996–1997), while both fox species were relatively generalisticwhen the lemming population was in the low phase (1993,1998; Fig. 1, Table 2).Effect of altitudeWe found small-scale spatial segregation <strong>between</strong> the foxspecies. Dens inhabited by <strong>arctic</strong> <strong>foxes</strong> were situated at higheraltitudes than those inhabited by <strong>red</strong> <strong>foxes</strong> (logistic regression,p < 0.001, χ 2 = 18.7, df = 1, n = 24). Dens used exclusivelyby <strong>red</strong> <strong>foxes</strong> were found <strong>between</strong> 800 <strong>and</strong> 900 m asl,while those used solely by <strong>arctic</strong> <strong>foxes</strong> were found at 880–1100 m asl. Two dens situated at 900 <strong>and</strong> 920 m asl wereused alternately by both fox species. However, <strong>red</strong> <strong>foxes</strong>were never found at higher altitudes than <strong>arctic</strong> <strong>foxes</strong> duringthe same summer (Fig. 2).For <strong>arctic</strong> <strong>and</strong> <strong>red</strong> <strong>foxes</strong> combined, there were significantnegative relationships <strong>between</strong> altitude <strong>and</strong> the occurrence offield voles (p = 0.013, r S = –0.50, Fig. 2b) <strong>and</strong> birds (p =0.024, r S = –0.57; Fig. 2c) in the diets. There was also a tendencytowards a positive relationship <strong>between</strong> the occurrenceof lemmings <strong>and</strong> altitude (p = 0.057, r S = 0.39; Fig. 2a).None of the relationships were significant if the fox specieswere treated separately. There was no relationship <strong>between</strong>the occurrence of reindeer in the diets <strong>and</strong> altitude (p = 0.41,r S = 0.18).DiscussionLemmings, field voles, birds, <strong>and</strong> reindeer were the essentialprey species for both <strong>arctic</strong> <strong>and</strong> <strong>red</strong> <strong>foxes</strong> in the VindelfjällenNature Reserve. However, lemmings occur<strong>red</strong> more frequentlyin <strong>arctic</strong> fox scats than in <strong>red</strong> fox scats, while field voles <strong>and</strong>birds occur<strong>red</strong> more often in <strong>red</strong> fox scats than in <strong>arctic</strong> foxscats. Reindeer occur<strong>red</strong> equally often in the scats of bothfox species. Other prey items, i.e., Clethrionomys spp., shrews,mountain hare, eggs, <strong>and</strong> insects, occur<strong>red</strong> infrequently <strong>and</strong>were probably of little importance to either fox species. Shrewsoccur<strong>red</strong> only in the scats of <strong>arctic</strong> <strong>foxes</strong>, but both <strong>arctic</strong> <strong>and</strong><strong>red</strong> <strong>foxes</strong> generally dislike <strong>and</strong> avoid eating shrews (Lockie1959; Chesemore 1968; Barth et al. 2000). Hares occur<strong>red</strong>only in the scats of <strong>red</strong> <strong>foxes</strong>, but other studies have shownthat <strong>arctic</strong> <strong>foxes</strong> sometimes include hares in their diet(Macpherson 1969; Birks <strong>and</strong> Penford 1990; Str<strong>and</strong> et al.1999; Frafjord 2000). Thus, the absence of shrews in <strong>red</strong> foxscats <strong>and</strong> hares in <strong>arctic</strong> fox scats may not be related to foxspecies, but to r<strong>and</strong>om occurrences of rare prey.© 2002 NRC Canada
1282 Can. J. Zool. Vol. 80, 2002Table 4. Percent <strong>overlap</strong>s <strong>between</strong> <strong>and</strong> within fox species in different summers.Within speciesYearLemmingphase Between species Arctic fox Red fox1993 Low 79.6 — —1996 Increase 79.6 91.9 (83–100) —1997 Crash 44.2 90.6 (88–94) 28.71998 Low 75.1 79.3 (71–85) 75.9 (54–92)Between summers 54.7 (28.8–84.2) 60.8 (46–97) 58.5 (45–83)Note: For years when there were scats from more than one den, food-<strong>niche</strong> <strong>overlap</strong>s within speciesare shown as the average from pairwise calculations of <strong>overlap</strong> <strong>between</strong> the dens. The last row showsthe average of pairwise calculations of <strong>overlap</strong> <strong>between</strong> summers. Numbers in parentheses are ranges.There was spatial segregation <strong>between</strong> the fox specieswith respect to altitude. Our dataset is therefore representativeof what appears to be the general pattern on the mountaintundra in Fennosc<strong>and</strong>ia: <strong>arctic</strong> <strong>foxes</strong> use dens at relativelyhigh altitudes, while <strong>red</strong> <strong>foxes</strong> occupy dens at lower altitudes(Østbye et al. 1978; Linnell et al. 1999; Dalerum et al. 2002).For the two species combined, consumption of field voles<strong>and</strong> birds decreased with increasing altitude, while consumptionof lemmings increased with altitude. These results areconsistent with those of Frafjord (2000). Field voles preferproductive tundra habitats <strong>and</strong> are generally more abundantat lower altitudes, while lemmings are more common in unproductivehabitats <strong>and</strong> at relatively higher altitudes (Oksanen<strong>and</strong> Oksanen 1992; Oksanen et al. 1999). Birds are far lessabundant in unproductive than in productive tundra habitat(Svensson et al. 1984). Productivity generally decreases withincreasing altitude, so the observed relationships probablyreflect changes in prey abundance.Two dens were used alternately by <strong>arctic</strong> <strong>and</strong> <strong>red</strong> <strong>foxes</strong>.Although a small number of individuals were involved, theirdiets are interesting, since the species hunted in approximatelythe same territories, i.e., at the same altitude. Thefirst den, at 900 m asl, was inhabited by <strong>arctic</strong> <strong>foxes</strong> duringthe year of the lemming increase phase (1996) <strong>and</strong> by <strong>red</strong><strong>foxes</strong> during a lemming low phase (1998). Lemmings occur<strong>red</strong>more often in <strong>arctic</strong> fox scats than in <strong>red</strong> fox scats,while the reverse was true for field voles <strong>and</strong> birds (Fig. 2).The second den, at 920 m asl, was inhabited by <strong>arctic</strong> <strong>foxes</strong>in 1996–1998 <strong>and</strong> by <strong>red</strong> <strong>foxes</strong> during the lemming lowphase in 1993. Lemmings occur<strong>red</strong> frequently in <strong>arctic</strong> foxscats during the lemming increase- <strong>and</strong> crash-phase years(1996–1997), while occurrences of lemmings dropped markedlyduring the low-phase years, 1998 <strong>and</strong> 1993, when theden was inhabited by <strong>arctic</strong> <strong>and</strong> <strong>red</strong> <strong>foxes</strong>, respectively. Fieldvoles rarely occur<strong>red</strong> in the scats of either species, exceptfor 1998, when there was a marked increase in the occurrenceof field voles in <strong>arctic</strong> fox scats (Fig. 2).For each year, occurrences of different prey in scats atthese dens were similar to those that would be expectedbased on the general patterns of diet composition <strong>and</strong> preyavailability in these years. This indicates that interspecificdifferences in diet can be p<strong>red</strong>icted on the basis of preyavailability only, <strong>and</strong> do not require differences in prey preferenceto explain them.Since <strong>arctic</strong> <strong>and</strong> <strong>red</strong> <strong>foxes</strong> were spatially segregated, neitherscenario 1 nor 2, described in the Introduction, explainsthe differences <strong>between</strong> <strong>arctic</strong> <strong>and</strong> <strong>red</strong> fox diets. However,we found significant temporal differences in <strong>foxes</strong>’ diets <strong>and</strong>this variation was reflected in relatively low average food<strong>niche</strong><strong>overlap</strong> <strong>between</strong> years within each species (60.8 <strong>and</strong>58.5% for <strong>arctic</strong> <strong>and</strong> <strong>red</strong> <strong>foxes</strong>, respectively). Despite this,food-<strong>niche</strong> <strong>overlap</strong> <strong>between</strong> the species was consistently highin 3 out of 4 years (75.1–79.6%). During the lemming increasephase, <strong>arctic</strong> <strong>and</strong> <strong>red</strong> <strong>foxes</strong> mainly consumed lemmings.During lemming low phases, food-<strong>niche</strong> <strong>overlap</strong> remainedhigh, owing to increased consumption of the same alternativeprey: reindeer, voles, <strong>and</strong> birds in 1993 <strong>and</strong> voles <strong>and</strong>birds in 1998. In one year, 1997, <strong>foxes</strong> deviated from thispattern, but the variation within <strong>red</strong> <strong>foxes</strong> was larger thanthe variation <strong>between</strong> the species. This may indicate that denwas a more important factor for diet than species. Eitherway, the dominant pattern was that <strong>arctic</strong> <strong>and</strong> <strong>red</strong> <strong>foxes</strong> respondedsimilarly to changes in prey availability, <strong>and</strong> <strong>niche</strong><strong>overlap</strong> was relatively constant <strong>between</strong> years, which supportsscenario 3. Thus, <strong>arctic</strong> <strong>and</strong> <strong>red</strong> <strong>foxes</strong> have similarprey preferences, while the spatial segregation <strong>between</strong> themcould have caused the observed differences in diets.Our samples were larger than that in two earlier comparisonsof <strong>arctic</strong> <strong>and</strong> <strong>red</strong> fox diets (Smits et al. 1989; Frafjord1995), but were still small in some years. There are severalreasons why samples were small despite our large studyarea. The <strong>arctic</strong> fox in Sweden is threatened with extinction.Further, since <strong>arctic</strong> <strong>foxes</strong>’ reproduction depends heavily onlemming availability (Str<strong>and</strong> et al. 1999; Elmhagen et al.2000), only a few dens were inhabited in years when lemmingdensity was low. On the other h<strong>and</strong>, the number ofdens inhabited by <strong>red</strong> <strong>foxes</strong> on the mountain tundra is independentof lemming phase but positively correlated withvole availability in surrounding forests (unpublished data).This is also reflected in our sample sizes. The numerical responsesof <strong>arctic</strong> <strong>and</strong> <strong>red</strong> <strong>foxes</strong> to lemming <strong>and</strong> vole availabilityled to skewed samples <strong>between</strong> both years <strong>and</strong> foxspecies. However, since <strong>arctic</strong> <strong>and</strong> <strong>red</strong> fox diets are affectedby temporal variation in lemming <strong>and</strong> vole availability, thetemporal aspect should be included in comparisons of theirdiets. Frafjord’s (2000) study on <strong>arctic</strong> <strong>and</strong> <strong>red</strong> fox diets inFennosc<strong>and</strong>ia over 5 years involved a large sample but wasskewed <strong>between</strong> years <strong>and</strong> fox species. He did not considervariation in prey availability. He concluded that environmentalfactors explained most of the differences <strong>between</strong> <strong>red</strong> <strong>and</strong><strong>arctic</strong> fox diets in Fennosc<strong>and</strong>ia, but suggested that <strong>arctic</strong><strong>foxes</strong> depended more on lemmings than <strong>red</strong> <strong>foxes</strong> at thesame altitude did. Thus, he suggested that <strong>arctic</strong> <strong>and</strong> <strong>red</strong><strong>foxes</strong> would use similar prey bases differently. Although our© 2002 NRC Canada
Elmhagen et al. 1283sample was small in some years, the overall pattern indicatesthat <strong>arctic</strong> <strong>and</strong> <strong>red</strong> <strong>foxes</strong> would use similar prey bases similarly.Differences <strong>between</strong> the species at the same altitudeswere more likely due to temporal variations in prey availability,since they were never found at the same altitude inthe same year.<strong>Food</strong>-<strong>niche</strong> breadths varied substantially among years forboth species. Arctic <strong>foxes</strong> showed a higher degree of specializationthan <strong>red</strong> <strong>foxes</strong> when the lemming population wasin the increase <strong>and</strong> crash phases. During lemming low phases,both fox species were relatively generalistic. These variationsin food-<strong>niche</strong> breadth are probably consequences ofopportunistic feeding behaviours. When lemmings are abundant,both species use them to a large extent, but when lemmingdensities are low they find other prey. Since <strong>arctic</strong><strong>foxes</strong> were found at altitudes where lemmings should makeup a relatively larger proportion of the prey community, theyshowed more pronounced shifts <strong>between</strong> specialized <strong>and</strong>generalized feeding strategies.The opportunistic feeding behaviour of <strong>arctic</strong> <strong>foxes</strong> is welldocumented. Arctic <strong>foxes</strong> in coastal habitats have access tomore types of prey than inl<strong>and</strong> <strong>foxes</strong> do, <strong>and</strong> have a more diversifieddiet (Chesemore 1968; Fay <strong>and</strong> Stephenson 1989;Birks <strong>and</strong> Penford 1990; Hersteinsson <strong>and</strong> Macdonald 1996;Kapel 1999; Anthony et al. 2000). Foxes near bird coloniesincrease their consumption of birds <strong>and</strong> eggs upon the arrivalof migrating birds (Stickney 1991; Bantle <strong>and</strong> Alisauskas1998), while <strong>foxes</strong> in areas where prey are locally abundantadjust their use of habitat according to seasonal changes inprey distribution (Jepsen et al. 2002).Red <strong>foxes</strong> in southern Sweden have more diversified dietsthan those in northern Sweden (Englund 1965; Lindström1982). Red fox populations are also relatively stable in thesouth. No direct relationship has been demonstrated <strong>between</strong>reproduction <strong>and</strong> the availability of any particular prey species,<strong>and</strong> southern <strong>red</strong> fox populations are likely to be sociallyregulated. In contrast, the sizes of northern populations varymarkedly with the vole cycle (Englund 1970; Lindström 1989).Thus, just as <strong>arctic</strong> <strong>foxes</strong> in inl<strong>and</strong> <strong>and</strong> coastal habitats havedifferent feeding strategies, there appears to be a south–north gradient in the feeding strategies of <strong>red</strong> <strong>foxes</strong>. Alongthe gradient of decreasing productivity in Sweden, from northernforests to low-production mountain tundra, <strong>red</strong> <strong>foxes</strong>should have progressively less varied diets. This is supportedby Englund’s (1965) finding that <strong>red</strong> <strong>foxes</strong> on the mountaintundra consumed fewer birds than those in the forest.Because of their larger body size, <strong>red</strong> <strong>foxes</strong> require higherprey densities to sustain themselves than <strong>arctic</strong> <strong>foxes</strong> do(Hersteinsson <strong>and</strong> Macdonald 1992), <strong>and</strong> <strong>red</strong> <strong>foxes</strong> are usuallyfound in dens at lower altitudes, i.e., in more productiveareas. However, if <strong>arctic</strong> <strong>and</strong> <strong>red</strong> <strong>foxes</strong> are equally opportunistic<strong>and</strong> there are no differences <strong>between</strong> their virtual food<strong>niche</strong>s, it is difficult to see why <strong>arctic</strong> <strong>foxes</strong> would notendeavour to use the lower parts of their former range. Further,avoidance of lower altitudes, which has also been indicatedby radio-tracking of <strong>arctic</strong> <strong>foxes</strong> in Fennosc<strong>and</strong>ia (L<strong>and</strong>a etal. 1998), is the opposite of the behaviour of <strong>arctic</strong> <strong>foxes</strong> onSvalbard, where productive habitats are favou<strong>red</strong> <strong>and</strong> morebarren areas avoided (Jepsen et al. 2002). Instead, competitionwith <strong>red</strong> <strong>foxes</strong> may explain why <strong>arctic</strong> <strong>foxes</strong> have retreatedto higher altitudes, <strong>and</strong> the high degree of food-<strong>niche</strong><strong>overlap</strong> indicates that <strong>arctic</strong> <strong>and</strong> <strong>red</strong> <strong>foxes</strong> should competefor the same areas, as suggested by Hersteinsson <strong>and</strong> Macdonald(1982, 1992).What competitive mechanisms, then, may be important?Arctic <strong>and</strong> <strong>red</strong> <strong>foxes</strong> are territorial towards each other(Tannerfeldt et al. 2002) <strong>and</strong> it is unlikely that <strong>red</strong> <strong>foxes</strong> severely<strong>red</strong>uce prey densities in areas outside their territorialborders. Exploitative competition should therefore be of littleconsequence on a larger scale. Instead, observations inthe wild <strong>and</strong> experiments involving penned individuals haveshown that <strong>red</strong> <strong>foxes</strong> p<strong>red</strong>ominate over <strong>arctic</strong> <strong>foxes</strong> <strong>and</strong> cankill both adults <strong>and</strong> juveniles (Rudzinski et al. 1982; Schamel<strong>and</strong> Tracy 1986; Frafjord et al. 1989; Korhonen et al. 1997;Tannerfeldt et al. 2002). Arctic <strong>foxes</strong> also seem to avoid reproducingin dens near reproducing <strong>red</strong> <strong>foxes</strong>, which indicatesthat there is a competitive mechanism by which <strong>red</strong><strong>foxes</strong> can influence the distribution pattern of <strong>arctic</strong> <strong>foxes</strong>(Tannerfeldt et al. 2002). Interference competition, mediatedthrough territorial <strong>and</strong> encounter competition (Schoener 1983),could therefore be a mechanism of habitat segregation, with<strong>red</strong> <strong>foxes</strong> occupying the more productive habitats. The restrictedprey base in unproductive habitat will make <strong>arctic</strong><strong>foxes</strong> more dependent on lemmings than <strong>red</strong> <strong>foxes</strong> are.Therefore, competition <strong>between</strong> <strong>red</strong> <strong>and</strong> <strong>arctic</strong> <strong>foxes</strong> must beconside<strong>red</strong> in efforts to conserve the <strong>arctic</strong> fox population inFennosc<strong>and</strong>ia (Löfgren <strong>and</strong> Angerbjörn 1998).We conclude that <strong>arctic</strong> <strong>and</strong> <strong>red</strong> <strong>foxes</strong> on the Swedishmountain tundra have similar virtual food <strong>niche</strong>s. Observeddifferences in <strong>arctic</strong> <strong>and</strong> <strong>red</strong> fox diets appear to be consequencesof spatial segregation that may, in turn, be causedby interference competition. The <strong>red</strong> fox is the strongercompetitor <strong>and</strong> might exclude the <strong>arctic</strong> fox from more productiveareas. Thus, an expansion of the range of the <strong>red</strong> foxduring the 20th century might have led to a <strong>red</strong>uction in theactual <strong>niche</strong> of the <strong>arctic</strong> fox.AcknowledgementsWe are grateful for funding from Oscar <strong>and</strong> Lili Lammsstiftelse, Carl Tryggers stiftelse, foundations at the RoyalSwedish Academy of Science, Magnus Bergvalls stiftelse,European Union LIFE-Nature, <strong>and</strong> World Wildlife Fund Sweden.Fjällräven AB, AB Dogman, Campbell’s, Milko, CloettaFazer, <strong>and</strong> Tågkompaniet supplied products that were usedin this project. We are also grateful for all the hard work putin by voluntary field workers.ReferencesAbrams, P. 1980. Some comments on measuring <strong>niche</strong> <strong>overlap</strong>.Ecology, 61: 44–49.Angerbjörn A., Tannerfeldt, M., <strong>and</strong> Erlinge, S. 1999. P<strong>red</strong>ator–prey relations: <strong>arctic</strong> <strong>foxes</strong> <strong>and</strong> lemmings. J. Anim. Ecol. 68:34–49.Angerbjörn, A., Tannerfeldt, M., <strong>and</strong> Lundberg, H. 2001. Geographical<strong>and</strong> temporal patterns of lemming population dynamicsin Fennosc<strong>and</strong>ia. Ecography, 24: 298–308.Anthony, R.M., Barten, N.L., <strong>and</strong> Seiser, P.E. 2000. <strong>Food</strong>s of <strong>arctic</strong><strong>foxes</strong> (Alopex lagopus) during winter <strong>and</strong> spring in western Alaska.J. Mammal. 81: 820–828.Bantle, J.L., <strong>and</strong> Alisauskas, R.T. 1998. Spatial <strong>and</strong> temporal patternsin <strong>arctic</strong> fox diets at a large goose colony. Arctic, 51: 231–236.© 2002 NRC Canada
1284 Can. J. Zool. Vol. 80, 2002Barth, L., Angerbjörn, A., <strong>and</strong> Tannerfeldt, M. 2000. Are Norwegianlemmings Lemmus lemmus avoided by <strong>arctic</strong> Alopex lagopus or<strong>red</strong> Vulpes vulpes <strong>foxes</strong>? A feeding experiment. Wildl. Biol. 6:101–109.Birks, J.D.S., <strong>and</strong> Penford, N. 1990. Observations on the ecologyof <strong>arctic</strong> <strong>foxes</strong> Alopex lagopus in Eqalummiut Nunaat, WestGreenl<strong>and</strong>. Medd. Groenl. Biosci. 32: 1–26.Brom, T.G. 1986. Microscopic identification of feathers <strong>and</strong> featherfragments of Pale<strong>arctic</strong> birds. Bijdr. Dierkd. 56: 181–204.Chesemore, D.L. 1968. Notes on the food habits of <strong>arctic</strong> <strong>foxes</strong> innorthern Alaska. Can. J. Zool. 46: 1130–1227.Chirkova, A.F. 1968. The relationship <strong>between</strong> <strong>arctic</strong> fox <strong>and</strong> <strong>red</strong>fox in the far north. Probl. North, 11: 129–131.Clode, D., <strong>and</strong> Macdonald, D.W. 1995. Evidence for food competition<strong>between</strong> mink (Mustela vision) <strong>and</strong> otter (Lutra lutra) onScottish isl<strong>and</strong>s. J. Zool. (Lond.), 237: 435–444.Colwell, R.K., <strong>and</strong> Futuyma, D.J. 1970. On the measurement of<strong>niche</strong> breadth <strong>and</strong> <strong>overlap</strong>. Ecology, 52: 567–576.Dalerum, F., <strong>and</strong> Angerbjörn, A. 2000. Arctic fox (Alopex lagopus)diet in Karupelv valley, East Greenl<strong>and</strong>, during a summer withlow lemming diversity. Arctic, 53: 1–8.Dalerum, F., Tannerfeldt, M., Elmhagen, B., Becker, D., <strong>and</strong>Angerbjörn, A. 2002. Distribution, morphology <strong>and</strong> use of densin northern Sweden. Wildl. Biol. 8. In press.Day, M.G. 1966. Identification of hair <strong>and</strong> feather remains in thegut <strong>and</strong> faeces of stoats <strong>and</strong> weasels. J. Zool. (1965–1984), 148:201–217.Ecke, F., Löfgren, O., Hörnfeldt, B., Eklund, U., Ericsson, P., <strong>and</strong>Sörlin, D. 2001. Abundance <strong>and</strong> diversity of small mammals inrelation to structural habitat factors. Ecol. Bull. 49: 165–171.Elmhagen, B., Tannerfeldt, M., Verucci, P., <strong>and</strong> Angerbjörn, A.2000. The <strong>arctic</strong> fox (Alopex lagopus)—an opportunistic specialist.J. Zool. (Lond.), 251: 139–149.Elton, C.S. 1924. Periodic fluctuations in the numbers of animals:their causes <strong>and</strong> effects. Br. J. Exp. Biol. (1923–1929), 2: 119–163.Englund, J. 1965. Studies on food ecology of the <strong>red</strong> fox (Vulpesvulpes) in Sweden. [In Swedish with English summary.] Viltrevy(Stockh.), 3: 377–485.Englund, J. 1970. Some aspects of reproduction <strong>and</strong> mortality ratesin Swedish <strong>foxes</strong> (Vulpes vulpes) 1961–63 <strong>and</strong> 1966–69. [InSwedish with English summary.] Viltrevy (Stockh.) 8: 1–82.Fay, F.H., <strong>and</strong> Stephenson, R.O. 1989. Annual, seasonal <strong>and</strong> habitatrelatedvariation in feeding habits of the <strong>arctic</strong> fox (Alopex lagopus)on St. Lawrence Isl<strong>and</strong>, Bering Sea. Can. J. Zool. 67: 1986–1994.Frafjord, K. 1993. <strong>Food</strong> habits of <strong>arctic</strong> <strong>foxes</strong> (Alopex lagopus) onthe western coast of Svalbard. Arctic, 46: 49–54.Frafjord, K. 1995. Summer food habits of <strong>arctic</strong> <strong>foxes</strong> in the alpineregion of southern Sc<strong>and</strong>inavia, with a note on sympatric <strong>red</strong><strong>foxes</strong>. Ann. Zool. Fenn. 32: 111–116.Frafjord, K. 2000. Do <strong>arctic</strong> <strong>and</strong> <strong>red</strong> <strong>foxes</strong> compete for food? Z.Saeugetierkd. 65: 350–359.Frafjord, K., Becker, D., <strong>and</strong> Angerbjörn, A. 1989. Interactions<strong>between</strong> <strong>arctic</strong> <strong>and</strong> <strong>red</strong> <strong>foxes</strong> in Sc<strong>and</strong>inavia—p<strong>red</strong>ation <strong>and</strong>aggression. Arctic, 42: 354–356.Goszczynski, J. 1974. Studies on the food of <strong>foxes</strong>. Acta Theriol.19: 1–18.Hanski, I., Hansson, L., <strong>and</strong> Henttonen, H. 1991. Specialist p<strong>red</strong>ators,generalist p<strong>red</strong>ators, <strong>and</strong> the microtine cycle. J. Anim. Ecol. 60:535–367.Hersteinsson, P., <strong>and</strong> Macdonald, D.W. 1982. Some comparisons<strong>between</strong> <strong>red</strong> <strong>and</strong> <strong>arctic</strong> <strong>foxes</strong>, Vulpes vulpes <strong>and</strong> Alopex lagopus,as revealed by radio tracking. Symp. Zool. Soc. Lond. No. 49.pp. 259–289.Hersteinsson, P., <strong>and</strong> Macdonald, D.W. 1992. Interspecific competition<strong>and</strong> the geographical distribution of <strong>red</strong> <strong>and</strong> <strong>arctic</strong> <strong>foxes</strong>Vulpes vulpes <strong>and</strong> Alopex lagopus. Oikos, 64: 505–515.Hersteinsson, P., <strong>and</strong> Macdonald, D.W. 1996. Diet of <strong>arctic</strong> <strong>foxes</strong>(Alopex lagopus) in Icel<strong>and</strong>. J. Zool. (Lond.), 240: 457–474.Hersteinsson, P., Angerbjörn, A., Frafjord, K., <strong>and</strong> Kaikusalo, A.1989. The <strong>arctic</strong> fox in Fennosc<strong>and</strong>ia <strong>and</strong> Icel<strong>and</strong>: managementproblems. Biol. Conserv. 49: 67–81.Hurlbert, S.H. 1978. The measurement of <strong>niche</strong> <strong>overlap</strong> <strong>and</strong> somerelatives. Ecology, 59: 67–77.Jepsen, J.U., Eide, N.E., Prestrud, P., <strong>and</strong> Jacobsen, L.B. 2002. Theimportance of prey distribution in habitat use by <strong>arctic</strong> <strong>foxes</strong>(Alopex lagopus). Can. J. Zool. 80: 418–429.Kaikusalo, A., <strong>and</strong> Angerbjörn, A. 1995. The <strong>arctic</strong> fox populationin Finnish Lapl<strong>and</strong> during 30 years, 1964–93. Ann. Zool. Fenn.32: 69–77.Kapel, C.M.O. 1999. Diet of <strong>foxes</strong> (Alopex lagopus) in Greenl<strong>and</strong>.Arctic, 52: 289–293.Korhonen, H., Alasuutari, S., Mäkinen, A., <strong>and</strong> Niemelä, P. 1997.Inter- <strong>and</strong> intraspecific competition <strong>between</strong> the fox species Alopexlagopus <strong>and</strong> Vulpes vulpes: an evaluation trial under pennedconditions. Polar Biol. 17: 330–336.Krebs, C.J. 1989. Ecological methodology. Harper & Row, NewYork.L<strong>and</strong>a, A., Str<strong>and</strong>, O., Linnell, J.D.C., <strong>and</strong> Skogl<strong>and</strong>, T. 1998.Home-range sizes <strong>and</strong> altitude selection for <strong>arctic</strong> <strong>foxes</strong> <strong>and</strong>wolverines in an alpine environment. Can. J. Zool. 76: 448–457.Larivière, S., <strong>and</strong> Pasitschniak-Arts, M. 1996. Vulpes vulpes. Mamm.Species No. 537. pp. 1–11.Leckie, F.M., Thirgood, S.J., May, R., <strong>and</strong> Redpath, S.M. 1998.Variation in the diet of <strong>red</strong> <strong>foxes</strong> on Scottish moorl<strong>and</strong> in relationto prey abundance. Ecography, 21: 599–604.Lindström, E. 1982. Population ecology of the <strong>red</strong> fox (Vulpesvulpes) in relation to food supply. Ph.D. thesis, University ofStockholm, Stockholm, Sweden.Lindström, E. 1989. <strong>Food</strong> limitation <strong>and</strong> social regulation in a <strong>red</strong>fox population. Holarct. Ecol. 12: 70–79.Lindström, E. 1994. Large prey for small cubs—on crucial resourcesof a boreal <strong>red</strong> fox population. Ecography, 17: 17–22.Linnell, J.D.C., Str<strong>and</strong>, O., <strong>and</strong> L<strong>and</strong>a, A. 1999. Use of dens by <strong>red</strong>Vulpes vulpes <strong>and</strong> <strong>arctic</strong> Alopex lagopus <strong>foxes</strong> in alpine environments:Can interspecific competition explain the non-recoveryof Norwegian <strong>arctic</strong> fox populations? Wildl. Biol. 5: 167–176.Lockie, J.D. 1959. The estimation of the food of <strong>foxes</strong>. J. Wildl.Manag. 23: 224–227.Löfgren, S., <strong>and</strong> Angerbjörn, A. 1998. Åtgärdsprogram för fjällräv.[With English summary.] Rep. No. 620–9906, Swedish EnvironmentalProtection Agency, Stockholm.Lönnberg, E. 1927. Fjällrävsstammen i Sverige 1926. K. Sven.Vetenskapsakad. Skr. Naturskyddsarenden No. 7.Macpherson, A.H. 1964. A northward range extension of the <strong>red</strong>fox in the eastern Canadian Arctic. J. Mammal. 45: 138–140.Macpherson, A.H. 1969. The dynamics of Canadian <strong>arctic</strong> fox populations.Can. Wildl. Serv. Rep. Ser. No. 8.Marsh, D.B. 1938. The influx of the <strong>red</strong> fox <strong>and</strong> its colour phasesinto the Barren L<strong>and</strong>s. Can. Field-Nat. 52: 60–61.Niethammer, J., <strong>and</strong> Krapp, F. 1982. H<strong>and</strong>buch der Säugetiere Europas.B<strong>and</strong> 2/1. Nagetiere II. Akademische Verlagsgesellschaft, Wiesbaden,Germany.Oksanen, L., <strong>and</strong> Oksanen, T. 1992. Long-term microtine dynamicsin north Fennosc<strong>and</strong>ian tundra: the vole cycle <strong>and</strong> the lemmingchaos. Ecography, 15: 226–236.© 2002 NRC Canada
Elmhagen et al. 1285Oksanen, T., Schneider, M., Rammul, Ü., Hambäck, P., <strong>and</strong> Aunapuu,M. 1999. Population fluctuations of voles in north Fennosc<strong>and</strong>iantundra: contrasting dynamics in adjacent areas with differenthabitat composition. Oikos, 86: 463–478.O’Mahony, D.O., Lambin, X., MacKinnon, J.L., <strong>and</strong> Coles, C.F.1999. Fox p<strong>red</strong>ation on cyclic field vole populations in Britain.Ecography, 22: 575–581.Park, T. 1962. Beetles, competition <strong>and</strong> populations. Science(Washington, D.C.), 138: 1369–1375.Reynolds, J.C., <strong>and</strong> Aebischer, N.J. 1991. Comparison <strong>and</strong> quantificationof carnivore diet by faecal analysis: a critique, with recommendations,based on a study of the fox Vulpes vulpes.Mammal Rev. 21: 97–122.Rudzinski, D.R., Graves, H.B., Sargeant, A.B., <strong>and</strong> Strom, G.L.1982. Behavioral interactions of penned <strong>red</strong> <strong>and</strong> <strong>arctic</strong> <strong>foxes</strong>.J. Wildl. Manag. 46: 877–844.Rune, O. 1981. Floran inom Vindelfjällens naturreservat. Meddel<strong>and</strong>e3. Länsstyrelsen, Västerbottens län, Umeå, Sweden.Schamel, D., <strong>and</strong> Tracy, D.M. 1986. Encounters <strong>between</strong> <strong>arctic</strong><strong>foxes</strong>, Alopex lagopus, <strong>and</strong> <strong>red</strong> <strong>foxes</strong>, Vulpes vulpes. Can. Field-Nat. 100: 562–563.Schoener, T.W. 1970. Non-synchronous spatial <strong>overlap</strong> of lizardsin patchy habitats. Ecology, 51: 408–418.Schoener, T.W. 1983. Field experiments on interspecific competition.Am. Nat. 122: 240–285.Smith, E.P., <strong>and</strong> Zaret, T.M. 1982. Bias in estimating <strong>niche</strong> <strong>overlap</strong>.Ecology, 63: 1248–1253.Smits, C.M.M., Slough, B.G., <strong>and</strong> Yasui, C.A. 1989. Summer foodhabits of sympatric <strong>arctic</strong> <strong>foxes</strong>, Alopex lagopus, <strong>and</strong> <strong>red</strong> <strong>foxes</strong>,Vulpes vulpes, in the northern Yukon Territory. Can. Field-Nat.103: 363–367.Stickney, A. 1991. Seasonal patterns of prey availability <strong>and</strong> theforaging behaviour of <strong>arctic</strong> <strong>foxes</strong> (Alopex lagopus) in a waterfowlnesting area. Can. J. Zool. 69: 2853–2859.Str<strong>and</strong>, O., Linnell, J.D.C., Krogstad, S., <strong>and</strong> L<strong>and</strong>a, A. 1999. Dietary<strong>and</strong> reproductive responses of <strong>arctic</strong> <strong>foxes</strong> to changes insmall rodent abundance. Arctic, 52: 272–278.Svensson, S., Carlsson, U.T., <strong>and</strong> Liljedahl, G. 1984. Structure <strong>and</strong>dynamics of an alpine bird community, a 20-year study. Ann.Zool. Fenn. 21: 339–350.Tannerfeldt, M., Elmhagen, B., <strong>and</strong> Angerbjörn, A. 2002. Exclusionby interference competition? The interspecific relation <strong>between</strong><strong>red</strong> <strong>and</strong> <strong>arctic</strong> <strong>foxes</strong>. Oecologia, 132: 213–220.Østbye, E., Skar, H.-J., Svalastog, D., <strong>and</strong> Westby, K. 1978. Arcticfox (Alopex lagopus) <strong>and</strong> <strong>red</strong> fox (Vulpes vulpes) on Hardangervidda:den ecology, distribution <strong>and</strong> population status. [In Norwegianwith English summary.] Medd. Nor. Viltforsk. 3: 1–66.© 2002 NRC Canada