Experiment HC-3: Pulse Wave Velocity - iWorx
Experiment HC-3: Pulse Wave Velocity - iWorx
Experiment HC-3: Pulse Wave Velocity - iWorx

Create successful ePaper yourself
Turn your PDF publications into a flip-book with our unique Google optimized e-Paper software.
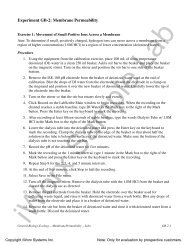
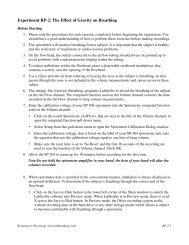
in which to save the file, like your lab group folder). Designate the file type as *.iwxdata. Clickon the Save button to save the data file.Figure <strong>HC</strong>-3-L1: An ECG and pulse recording displayed on the Main window.Data Analysis1. Scroll through the recording and find the data recorded when the pulse plethysmograph was onthe brachial artery. Select a section of data with five or six exemplary ECG/pulse cycles insuccession.2. Use the Display Time icons to adjust the Display Time of the Main window to show at leastfour complete ECG/<strong>Pulse</strong> cycles on the Main window. Four adjacent ECG/<strong>Pulse</strong> cycles can alsobe selected by:• Placing the cursors on either side of a group of four complete ECG/<strong>Pulse</strong> cycles.• Clicking the Zoom between Cursors button on the LabScribe toolbar to expand thesegment with the four selected ECG/<strong>Pulse</strong> cycles to the width of the Main window.3. Click on the Analysis window icon in the toolbar (Figure <strong>HC</strong>-3-L2) or select Analysis from theWindows menu to transfer the data displayed in the Main window to the Analysis window(Figure <strong>HC</strong>-3-L3).4. Look at the Function Table that is above the uppermost channel displayed in the Analysiswindow. The name of the mathematical function used in the analysis, T2-T1, appears in thistable. The only value that you need to record, T2-T1, is seen on the table across the top marginof each channel.<strong>iWorx</strong> Sample LabHuman Circulation – <strong>Pulse</strong> <strong>Wave</strong> <strong>Velocity</strong> – LabsHH-3-2Copyright <strong>iWorx</strong> Systems Inc.Note: Only for evaluation by prospective customers.
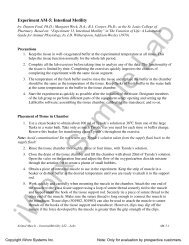
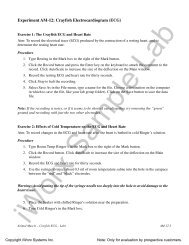
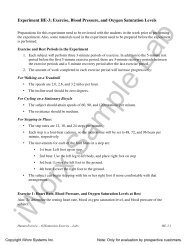
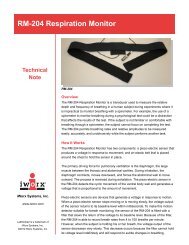
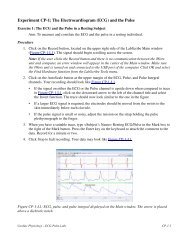
Figure <strong>HC</strong>-3-L2: The LabScribe toolbar.5. Once the cursors are placed in the correct positions for determining the time intervals on eachECG/<strong>Pulse</strong> cycle, the values of the time intervals can be recorded in the on-line notebook ofLabScribe by typing their names and values directly into the Journal.6. The functions in the channel pull-down menus of the Analysis window can also be used to enterthe names and values of the parameters from the recording to the Journal. To use thesefunctions:• Place the cursors at the locations used to measure the amplitudes and period of theECG/<strong>Pulse</strong> cycle.• Transfer the names of the mathematical functions used to determine the amplitudes andtime interval to the Journal using the Add Title to Journal function in the ECG Channelpull-down menu.• Transfer the values for the amplitudes and beat period to the Journal using the Add Ch.Data to Journal function in the ECG Channel pull-down menu.Figure <strong>HC</strong>-3-L3: An ECG and pulse wave recording shown in the Analysis window. The pulseplethysmograph was placed on the tip of the left middle finger. The time difference (T2-T1) between thepeaks of the R and pulse waves is 230 msec.<strong>iWorx</strong> Sample LabHuman Circulation – <strong>Pulse</strong> <strong>Wave</strong> <strong>Velocity</strong> – LabsHH-3-3Copyright <strong>iWorx</strong> Systems Inc.Note: Only for evaluation by prospective customers.
7. Measure the R-<strong>Pulse</strong> interval, which is the time interval between the peak of the R wave and thepeak of the pulse wave that follows the R wave. Use the mouse to click on and drag a cursor onthe peak of an R wave, and the other cursor to the peak of the pulse wave to its right (Figure<strong>HC</strong>-3-L3). The value for T2-T1 on any channel is the R-<strong>Pulse</strong> interval. Record this value in theJournal.8. Measure this interval for two additional ECG/<strong>Pulse</strong> cycles. Record these values in the Journal.9. Calculate the mean R-<strong>Pulse</strong> interval when the pulse transducer was over the brachial artery.Type the mean into the Journal.10. Go to the section of the recording made while the pulse transducer was on the distal segment ofthe middle finger of the left hand. Repeat Steps 2 through 9 for the data collected when thepulse transducer was on the subject’s middle finger.Calculation of <strong>Pulse</strong> <strong>Wave</strong> <strong>Velocity</strong>1. Subtract the mean R-<strong>Pulse</strong> wave interval found at the elbow from the mean R-<strong>Pulse</strong> waveinterval found at the elbow. This is the time it takes the pulse wave to move from the position ofpulse transducer at the elbow to the position of pulse transducer on the tip of the middle finger.Express this time in milliseconds.2. Divide the distance between the two positions of pulse transducer (as measured in millimetersin the Procedures section of this exercise) by the difference in the mean R-<strong>Pulse</strong> wave intervalsdetermined in Step 1. The quotient is the pulse wave velocity of the artery between the elbowand the tip of the middle finger. Express the velocity in meters/second.3. Record the subject’s resting pulse wave velocity in the Journal and Table <strong>HC</strong>-3-L1. Beforeputting the data for your subject on the table, list the names of all the subjects on the table inorder of ascending age (youngest to oldest).Exercise 2: <strong>Pulse</strong> <strong>Wave</strong> <strong>Velocity</strong> After Hand ExerciseAim: To determine pulse wave velocity in the artery to the hand after exercise.Procedure1. Attach the pulse plethysmograph to the same location on the subject’s left elbow used inExercise 1.2. The subject should grasp the FT-325 hand dynamometer in the palm of his or her left hand.Note: The hand dynamometer is not plugged into the IWX/214 recording unit; It is being used toprovide resistance against which the hand muscles can do work.3. Rhythmically squeeze the dynamometer bulb every two or three seconds for two minutes oruntil the muscles of the subject’s forearm start to fatigue. While the subject is exercising themuscles of the forearm, type Post-Exercise ECG/<strong>Pulse</strong> at Elbow in the Markbox to the right of the Mark button.<strong>iWorx</strong> Sample LabHuman Circulation – <strong>Pulse</strong> <strong>Wave</strong> <strong>Velocity</strong> – LabsHH-3-4Copyright <strong>iWorx</strong> Systems Inc.Note: Only for evaluation by prospective customers.
4. When the subject stops exercising, he or she should sit quietly. Click on the Record button andrecord the subject’s ECG and pulse wave. As soon as a clean set of ECG/<strong>Pulse</strong> cycles arerecorded, click Stop to halt the recording.5. Quickly move the pulse transducer from the elbow to the left middle finger tip as it was done inExercise 1. Type Post-Exercise ECG/<strong>Pulse</strong> at Finger in the Mark box.6. Click on the Record button and record the subject’s ECG and pulse wave. As soon as a clean setof ECG/<strong>Pulse</strong> cycles are recorded, click Stop to halt the recording.7. Select Save in the File menu.8. Measure the distance between the positions of the pulse plethysmograph on the left elbow andleft middle finger.Data Analysis and Calculation of <strong>Pulse</strong> <strong>Wave</strong> <strong>Velocity</strong>1. Use the same techniques used in Exercise 1 to determine the subject’s post-exercise pulse wavevelocity.2. Record the subject’s post-exercise pulse wave velocity in the Journal and Table <strong>HC</strong>-3-L1.Exercise 3: Resting and Post-Exercise <strong>Pulse</strong> <strong>Wave</strong> Velocities in Other SubjectsAim: To measure the pulse wave velocity in the artery from the elbow to the finger for differentsubjects.ProcedureRepeat Exercises 1 and 2 on other subjects of different age groups (11-19, 20-29, 30-39, and so on),gender, or physical fitness levels.Data Analysis and Calculation of <strong>Pulse</strong> <strong>Wave</strong> <strong>Velocity</strong>1. Use the same techniques used in Exercises 1 and 2 to determine the resting and post-exercisepulse wave velocities from other subjects.2. Enter the data from the other subjects into the data table.3. On a piece of graph paper or in a graphing program, plot the mean resting PWV of each agegroup as a function of the age group. Include the standard error for the mean of each age groupQuestions1. Does the PWV of the subject’s brachial artery increase or decrease with exercise?2. Does vasodilation cause the PWV in an artery to increase or decrease? Conversely, doesvasoconstriction cause the PWV of an artery to increase or decrease?<strong>iWorx</strong> Sample Lab3. Does the mean resting PWV differ between genders?Human Circulation – <strong>Pulse</strong> <strong>Wave</strong> <strong>Velocity</strong> – LabsHH-3-5Copyright <strong>iWorx</strong> Systems Inc.Note: Only for evaluation by prospective customers.
4. Does the mean resting PWV depend on the level of fitness of the subjects?5. Does the mean resting PWV increase or decrease with age?6. Which age group has the smallest standard error of the means? Which age group has the largeststandard error of the means?7. How can large standard errors for each mean be avoided?Optional ExerciseWhile measuring the effects of temperature on the peripheral pulse volume in the TheElectrocardiogram and Peripheral Circulation experiment in this manual, use the techniques employedin this experiment to measure the PWV of arteries in arms exposed to cold and hot temperatures.Table <strong>HC</strong>-3-L1: <strong>Pulse</strong> <strong>Wave</strong> <strong>Velocity</strong>, Gender, and Fitness Data from Different Subjects.Subject Age Resting PWVPostExPWV<strong>iWorx</strong> Sample LabHuman Circulation – <strong>Pulse</strong> <strong>Wave</strong> <strong>Velocity</strong> – LabsGenderFitnessLevelHH-3-6Copyright <strong>iWorx</strong> Systems Inc.Note: Only for evaluation by prospective customers.