Structural MRI-findings in Mild Cognitive Impairment and ...
Structural MRI-findings in Mild Cognitive Impairment and ...
Structural MRI-findings in Mild Cognitive Impairment and ...

Create successful ePaper yourself
Turn your PDF publications into a flip-book with our unique Google optimized e-Paper software.
PSYCHOGERIATRIA POLSKA 2005;2(1),1-10artykuł redakcyjny editorial article<strong>Structural</strong> <strong>MRI</strong>-<strong>f<strong>in</strong>d<strong>in</strong>gs</strong> <strong>in</strong> <strong>Mild</strong> <strong>Cognitive</strong><strong>Impairment</strong> <strong>and</strong> Alzheimer’s DiseaseStrukturalne zmiany w <strong>MRI</strong> u chorychz Zespołem Lekkich Zaburzeń Poznawczychoraz z chorobą AlzheimeraPhilipp A. Thomann 1 , Johannes Pantel 2 , Torsten Wüstenberg 3 ,Frederik L. Giesel 4 , Ulrich Seidl 1 , Peter Schönknecht 1Marco Essig 4 , Johannes Schröder 11)Section of Geriatric Psychiatry, University of Heidelberg, Germany2)Department of Psychiatry, J.W. Goethe University, Frankfurt/Ma<strong>in</strong>, Germany3)Department of Medical Psychology, Georg-August University Goett<strong>in</strong>gen, Germany4)German Cancer Research Center, Heidelberg, GermanyKey words: mild cognitive impairment, Alzheimer’s disease, <strong>MRI</strong>, structural changes, ROI-measurement,voxel-based morphomSłowa kluczowe: zespół lekkich zaburzeń poznawczych, choroba Alzheimera <strong>MRI</strong>, zmiany strukturalne,obszar za<strong>in</strong>teresowania, morfometria bazująca na metodzie wokseliSummaryObjective. This study <strong>in</strong>vestigates morphological bra<strong>in</strong> changes <strong>in</strong> subjects with mild cognitive impairment(MCI) <strong>and</strong> Alzheimer’s disease (AD).Methods. 21 subjects with MCI, 21 healthy controls <strong>and</strong> 10 patients with AD were exam<strong>in</strong>ed withmagnetic resonance imag<strong>in</strong>g (<strong>MRI</strong>). For the analysis of the <strong>MRI</strong> data two different methods – regionof <strong>in</strong>terest (ROI) – guieded manual trac<strong>in</strong>g of predef<strong>in</strong>ed neuroanatomical substructures as well asrater-<strong>in</strong>dependent voxel-based morphometry (VBM) – were applied.Results. Manual trac<strong>in</strong>g demonstrated a significantly reduced volume of the right parahippocampalgyrus <strong>in</strong> MCI subjects compared with controls. VBM did not reveal any significant structural differencesbetween those two groups. In AD, both methods revealed significant atrophy of medial temporal lobesubstructures (hippocampus, parahippocampal gyrus), the temporal lobe <strong>in</strong> general <strong>and</strong> parts of thefrontal lobe.Conclusion. <strong>Structural</strong> bra<strong>in</strong> alterations are already verifiable <strong>in</strong> the assumed precl<strong>in</strong>ical stage ofAD. In the detection of these discrete atrophic changes ROI-based measurement seems to be moresensitive than VBM.Adres do korespondencji:PGP 28Prof. Dr. med. Johannes SchröderSection of Geriatric Psychiatry University of HeidelbergVoßstr. 4, 69115 Heidelberg, GermanyPhone: +49-6221-56-5468, Fax: +49-6221-56-5327e-mail: johannes_schroeder@med.uni-heidelberg.deCopyright ©2005 Fundacja Ochrony Zdrowia Psychicznego
2Johannes Schröder et al.: <strong>Structural</strong> <strong>MRI</strong> – fibd<strong>in</strong>gs <strong>in</strong> MCI <strong>and</strong> ADIntroductionAlzheimer’s disease (AD), the most frequent dementia beyond the age of 65 years, affects an em<strong>in</strong>ent<strong>and</strong> <strong>in</strong>creas<strong>in</strong>g part of the population. With the availability of modern drug treatment, e.g. chol<strong>in</strong>esterase--<strong>in</strong>hibitors, <strong>and</strong> promis<strong>in</strong>g therapeutic options <strong>in</strong> future (e.g. anti-amyloid strategies), the developmentof sensitive <strong>and</strong> specific markers of early AD ga<strong>in</strong>s <strong>in</strong> importance. In a cl<strong>in</strong>ical rout<strong>in</strong>e sett<strong>in</strong>g, structuralneuroimag<strong>in</strong>g is ma<strong>in</strong>ly used for exclud<strong>in</strong>g other pathologies that may cause dementia such as normotensivehydrocephalus, tumor, vascular lesions or <strong>in</strong>fectious diseases [1, 2]. Besides its contribution<strong>in</strong> dist<strong>in</strong>guish<strong>in</strong>g AD from other causes of dementia, structural neuroimag<strong>in</strong>g - particularly magneticresonance imag<strong>in</strong>g (<strong>MRI</strong>) - may be of important value <strong>in</strong> identify<strong>in</strong>g, among <strong>in</strong>dividuals compla<strong>in</strong><strong>in</strong>g orpresent<strong>in</strong>g slight cognitive deficits, those who will progress to manifest AD.It is generally accepted that most of the subjects who develop AD pass through a stage with m<strong>in</strong>orcognitive deficits which exceed those of the normal physiological ag<strong>in</strong>g processes, but are not severeenough to allow a cl<strong>in</strong>ical diagnosis of dementia. This transitional phase between health <strong>and</strong> theonset of AD is commonly referred as mild cognitive impairment (MCI). Previous longitud<strong>in</strong>al studiesdemonstrated that MCI subjects have an <strong>in</strong>creased risk to develop the complete cl<strong>in</strong>ical picture of ADat observed follow-up [3-5].Neuropathological research has shown that bra<strong>in</strong> degeneration occurs very early <strong>in</strong> the course of thedisease, even before the onset of cl<strong>in</strong>ical symptoms, <strong>and</strong> predom<strong>in</strong>antly affects certa<strong>in</strong> areas, particularlythe substructures of the medial temporal lobe [6-9]. <strong>MRI</strong> enables the visualization of theseearly bra<strong>in</strong> changes <strong>in</strong> vivo. Thus, several neuroimag<strong>in</strong>g studies reported significant atrophy of thehippocampus [10-13], the parahippocampal gyrus [14] <strong>and</strong> the entorh<strong>in</strong>al cortex [12, 13, 15-18] <strong>in</strong>subjects with MCI. In the mentioned studies image analysis was performed us<strong>in</strong>g the region of <strong>in</strong>terest(ROI) approach which is based upon the a priori def<strong>in</strong>ition of specific bra<strong>in</strong> regions by neuroanatomicallyskilled raters. ROI analysis constitutes, up to now, the gold st<strong>and</strong>ard <strong>in</strong> bra<strong>in</strong> atrophy measurements,but there are some major disadvantages such as observer/operator dependency, expenditure of time<strong>and</strong> bias <strong>in</strong> bra<strong>in</strong> structure <strong>and</strong> anatomical region boundary selection [19]. So far, the variability ofthese measurements has limited direct comparison of the results of different research groups. In orderto overcome these limitations observer <strong>in</strong>dependent computer based tools have been developedthat allow automated detection of volume or shape changes throughout the whole bra<strong>in</strong>. Statisticalparametric mapp<strong>in</strong>g (SPM) software [20] permits the comparison of gray matter density on a voxel byvoxel basis <strong>in</strong> a group of patients with the correspond<strong>in</strong>g variables <strong>in</strong> a group of controls. The resultof such a voxel-based morphometry (VBM) is a three dimensional map display<strong>in</strong>g significant regionaldifferences <strong>in</strong> gray matter density, serv<strong>in</strong>g as an <strong>in</strong>direct marker for gray matter atrophy.Recent VBM studies <strong>in</strong> AD support the <strong>f<strong>in</strong>d<strong>in</strong>gs</strong> of the ROI <strong>in</strong>vestigations cited above <strong>in</strong> that they revealeda significant decrease of gray matter density <strong>in</strong> the medial temporal lobe [21-24]. Additionally,the c<strong>in</strong>gulate gyrus <strong>and</strong> the temporoparietal association cortex have been reported to underly atrophicprocesses [21, 23, 24]. VBM <strong>f<strong>in</strong>d<strong>in</strong>gs</strong> <strong>in</strong> MCI are <strong>in</strong>consistent, <strong>in</strong> so far different studies describe differentregions to be predom<strong>in</strong>antly affected [25-27].As po<strong>in</strong>ted out above, manual segmentation represents an established method <strong>in</strong> the detection ofatrophic processes, while VBM is a promis<strong>in</strong>g but still experimental tool. Comparison of the two differenttechniques is expedient <strong>and</strong> has still not been performed for MCI <strong>and</strong> AD. In the present studywe therefore <strong>in</strong>vestigated <strong>MRI</strong> scans of subjects with MCI, patients with early AD <strong>and</strong> healthy controlsus<strong>in</strong>g both manual trac<strong>in</strong>g <strong>and</strong> VBM.MethodsSubject selectionSubjects with MCI <strong>and</strong> cognitively <strong>in</strong>tact control subjects were recruited among the Heidelberg subsampleof the <strong>in</strong>terdiscipl<strong>in</strong>ary longitud<strong>in</strong>al study on adult development (ILSE) which is conducted <strong>in</strong> Heidelberg<strong>and</strong> Leipzig (Germany). Subjects were selected from the community resident register which is a compulsoryregister of all residents <strong>in</strong> Germany. All subjects were screened for health by history, physical
3Johannes Schröder et al.: <strong>Structural</strong> <strong>MRI</strong> – fibd<strong>in</strong>gs <strong>in</strong> MCI <strong>and</strong> ADexam<strong>in</strong>ation, electrocardiogramm, <strong>and</strong> laboratory test<strong>in</strong>g. <strong>Cognitive</strong> performance was assessed us<strong>in</strong>g apreviously described extensive neuropsychological test battery [27, 28]. The Heidelberg subsample ofILSE consisted of 252 <strong>in</strong>dividuals (birth cohort: 1930-32). Among these <strong>in</strong>dividuals, subjects with MCIwere identified accord<strong>in</strong>g to the follow<strong>in</strong>g criteria of ag<strong>in</strong>g-associated cognitive decl<strong>in</strong>e (AACD) [29]:1. Performance of at least 1 st<strong>and</strong>ard deviation below the age-adjusted norm on a st<strong>and</strong>ardizedtest of cognition, <strong>in</strong>volv<strong>in</strong>g at least one of the follow<strong>in</strong>g doma<strong>in</strong>s: learn<strong>in</strong>g <strong>and</strong> memory,language, attention <strong>and</strong> cognitive speed, visuoconstructional abilities.2. Exclusion of any medical, neurological or psychiatric disorder that could produce cognitivedeterioration as determ<strong>in</strong>ed by history <strong>and</strong>/or cl<strong>in</strong>ical exam<strong>in</strong>ation.3. Normal activities of daily liv<strong>in</strong>g4. Exclusion of dementiaA detailed description of the ILSE study protocol as well as of the applied neuropsychological test batteryhas been published previously [27, 28].In order to take account of the temporal stability of the neuropsychological <strong>f<strong>in</strong>d<strong>in</strong>gs</strong>, all subjects fulfill<strong>in</strong>gthe above-mentioned AACD criteria at basel<strong>in</strong>e (n=47) as well as a correspond<strong>in</strong>g number of cognitivelyunimpaired control subjects (matched for age, gender <strong>and</strong> educational level) were re<strong>in</strong>vestigated 30to 50 month after the first visit <strong>and</strong> asked for their <strong>in</strong>formed consent to perform an <strong>MRI</strong> <strong>in</strong>vestigation.Thus, 71 subjects of the orig<strong>in</strong>al ILSE-sample could be re<strong>in</strong>vestigated cl<strong>in</strong>ically, neuropsychologically,<strong>and</strong> by <strong>MRI</strong> at follow-up. Cases with significant <strong>in</strong>dications of cerebrovascular disease revealed by <strong>MRI</strong>,emergence of a neurological/medical condition sufficient to cause cognitive decl<strong>in</strong>e, or <strong>in</strong>complete/<strong>in</strong>appropriate<strong>MRI</strong>-data sets (e.g. withdrawal due to claustrophobia, motion artifacts) were excluded fromfurther analysis. Of the rema<strong>in</strong><strong>in</strong>g 42 subjects, those who scored below 1 st<strong>and</strong>ard deviation <strong>in</strong> at leastone cognitive doma<strong>in</strong> at both visits <strong>and</strong>/or demonstrated a significant deterioration of test performancedur<strong>in</strong>g follow-up (without however fulfill<strong>in</strong>g criteria for dementia yet) were <strong>in</strong>cluded <strong>in</strong> the AACD/MCIgroup (n=21). Subjects who did not fulfill these requirements were assigned to the cognitively <strong>in</strong>tactcontrol group (n=21).As an additional reference group 10 AD-patients were drawn from a sample of patients consecutivelyadmitted <strong>and</strong> <strong>in</strong>vestigated at the Section of Geriatric Psychiatry (University of Heidelberg). These patientswere diagnosed as suffer<strong>in</strong>g from AD accord<strong>in</strong>g to the NINCDS-ADRDA criteria [30] <strong>and</strong> werematched to the two other groups by age <strong>and</strong> gender. In order to compare the degree of cognitiveimpairment between the three study groups the global deterioration scale (GDS) [31] was performedon each subject.The study was approved by the ethics committee of the Medical Faculty <strong>in</strong> Heidelberg. Written <strong>in</strong>formedconsent was obta<strong>in</strong>ed from all participat<strong>in</strong>g subjects after the procedures of the study had been fullyexpla<strong>in</strong>ed.<strong>MRI</strong> data acquisitionThe <strong>MRI</strong>-data were obta<strong>in</strong>ed at the German Cancer Research Center with a 1.5-T Magnetom SymphonyMR scanner (Siemens Medical Solutions, Erlangen, Germany). To exclude secondary causes of dementia<strong>and</strong> ischemic changes a 2D T2-weighted Fast-Sp<strong>in</strong> Echo (TR = 4500 ms, TE = 90 ms) sequence wasperformed <strong>in</strong> axial orientation. For volumetric analysis a T1-weighted 3D magnetization prepared rapidgradient echo sequence (MP-RAGE) was performed with the follow<strong>in</strong>g parameters: 126 coronar slices,image matrix = 256 x 256, voxel size = 0.98mm x 0.98mm x 1.8 mm, TR=10 msec, TE=4 msec.ROI-measurementsVolumetric measurements <strong>in</strong>cluded the total <strong>in</strong>tracranial volume (TIV), the whole bra<strong>in</strong> volume (WBV),the CSF volume, as well as volumes of the frontal <strong>and</strong> temporal lobes, the hippocampal formation,<strong>and</strong> the parahippocampal gyrus bilaterally. TIV, WBV, CSF-volume <strong>and</strong> frontal volumes were assessedsemi-automatically us<strong>in</strong>g the software NMRW<strong>in</strong> as has been described previously [32-34].
4Johannes Schröder et al.: <strong>Structural</strong> <strong>MRI</strong> – fibd<strong>in</strong>gs <strong>in</strong> MCI <strong>and</strong> ADThe volumes of the temporal lobes were manually traced bilaterally on 45-50 consecutive coronalT1-weighted sections. A detailed description of the st<strong>and</strong>ardized measurement protocol <strong>and</strong> trac<strong>in</strong>gguidel<strong>in</strong>es has been published previously [32,35]Volumes of the hippocampal formation <strong>and</strong> the parahippocampal gyrus were manually traced bilaterallyfor each subject on 30-35 consecutive T1-weighted sections. The term hippocampal formationrefers to a constellation of anatomically dist<strong>in</strong>ct structures, <strong>in</strong>clud<strong>in</strong>g the subiculum, Ammon’s horn(hippocampus proper), <strong>and</strong> the dentate gyrus. Because these structures were nearly <strong>in</strong>dist<strong>in</strong>guishableviusally on the MR images, they were sampled as a whole complex. Hippocampal measures were <strong>in</strong>itiated3 slices rostrally to the po<strong>in</strong>t of fusion of the pedunculi cerebri <strong>and</strong> the pons. Caudally, outl<strong>in</strong><strong>in</strong>gof the hippocampal formation was term<strong>in</strong>ated at the level where the fornix <strong>and</strong> the hippocampus fuse.Thus, small proportions of the anterior (head) <strong>and</strong> posterior (tail) parts of the hippocampal formationwere not sampled. Us<strong>in</strong>g the above described rostral <strong>and</strong> caudal boundaries however, facilitated ast<strong>and</strong>ardised sampl<strong>in</strong>g of the hippocampal formation on those slices, bear<strong>in</strong>g the hippocampus clearlydemarcated from adjacent bra<strong>in</strong> structures. This avoided ambiguities with respect to the separationof the structure from the amygdala (head) <strong>and</strong> the pulv<strong>in</strong>ar thalami (tail) <strong>and</strong> improved the reliabilityof the measurement.Volume measures of the parahippocampal gyrus were sampled on the same slices as the hippocampalmeasures. Thus, <strong>in</strong> analogy to the hippocampal measurement, small samples of its most rostral part(where it is fused with the uncus) <strong>and</strong> its most caudal part (where the transition to the l<strong>in</strong>gual gyrustakes place) were not considered. Outl<strong>in</strong><strong>in</strong>g of the parahippocampal gyrus started laterally <strong>in</strong> the depthof the collateral sulcus. The parahippocampal gyrus was followed along its <strong>in</strong>ferior <strong>and</strong> medial boarder(where it is clearly demarcated from the adjacent CSF of the ambient or peri-mesencephalic cistern)up to the uncal sulcus. From there the <strong>in</strong>ferior boarder of the subiculum (which itself is <strong>in</strong>cluded <strong>in</strong>the hippocampal measures) served as the superior demarcation l<strong>in</strong>e until the most medial part of thetemporal stem was reached. F<strong>in</strong>ally, a straight l<strong>in</strong>e was drawn to the start<strong>in</strong>g po<strong>in</strong>t <strong>in</strong> the collateralsulcus separat<strong>in</strong>g the parahippocampal gyrus from the adjacent temporal lobe.Intrarater reliability for the total <strong>in</strong>tracranial <strong>and</strong> whole bra<strong>in</strong> volume determ<strong>in</strong>ation was significant,accord<strong>in</strong>g to the <strong>in</strong>tercorrelation coefficient (rtt = 0.98; p < 0.0005). In order to demonstrate the reproducibilityof the manual trac<strong>in</strong>g method, all measurement were performed twice by the same raterbl<strong>in</strong>ded for group membership. This yielded <strong>in</strong>tercorrelation coefficients of rtt = 0.98 (frontal lobes), <strong>and</strong>rtt = 0.99 (temporal lobes bilaterally), p < 0.0005. In addition, <strong>in</strong>terrater reliabilities for determ<strong>in</strong>ationof volumes for the medial temporal lobe regions of <strong>in</strong>terest were determ<strong>in</strong>ed <strong>in</strong> a subset of 16 r<strong>and</strong>omlyselected subjects, consider<strong>in</strong>g one set of traces as the “gold st<strong>and</strong>ard”. The traces that were consideredto be the “gold st<strong>and</strong>ard” were generated by one of the authors with a solid experience <strong>and</strong> expertise<strong>in</strong> medial temporal lobe measurements (J.P.). This approach yielded <strong>in</strong>tercorrelation coefficients of rtt= 0.98 (right hippocampus), rtt = 0.97 (left hippocampus <strong>and</strong> right parahippocampal gyrus), <strong>and</strong> rtt= 0.96 (left parahippocampal gyrus), respectively (p
5Johannes Schröder et al.: <strong>Structural</strong> <strong>MRI</strong> – fibd<strong>in</strong>gs <strong>in</strong> MCI <strong>and</strong> AD-template provided by the Montreal Neurological Institute) <strong>and</strong> smoothed us<strong>in</strong>g a 10mm full-width athalf-maximum Gaussian kernel. Two sample t-tests were calculated for each group comparison. Onlyresults surviv<strong>in</strong>g a threshold of p < 0.05 (corrected for multiple comparisons) <strong>and</strong> a cluster size equalor greater than 1000 voxel will be reported.ResultsResults of manual trac<strong>in</strong>gA comparison of the cl<strong>in</strong>ical characteristic <strong>and</strong> volumetric measures of the three <strong>in</strong>vestigated groupsis displayed <strong>in</strong> table 1. Accord<strong>in</strong>g to the statistical analysis there were no significant differences withrespect to age, gender distribution, <strong>and</strong> level of school education. In addition, the TIV did not differsignificantly between the groups (F = 0.49; df = 2,49 ; p = 0.67). Comparison of the rema<strong>in</strong><strong>in</strong>g volumetricparameters was based on the corrected values. Subjects with AACD/MCI showed a significantlylower volume of the right parahippocampal gyrus (-12%; F = 18.02; df = 2,49; p < 0.0005) whencompared to the cognitively <strong>in</strong>tact control group. On the left side, mean prahippocampal gyrus of theAACD/MCI group was 7% smaller when compared to controls, although this difference did not reachstatistical significance. By contrast, AD-patients showed a significant bilateral volume reduction of theparahippocampal gyrus (right: F = 18.02; df = 2,49; p < 0.0001; left: F = 14.4; df = 2,49; p < 0.0001)when compared to both the AACD group (right: -18%; left: -22.8%) <strong>and</strong> the cognitively <strong>in</strong>tact controlgroup (right: -28%; left: -29.6%).The WBV, the CSF volumes as well as the frontal, temporal, <strong>and</strong> hippocampal volumes of the AACD/MCI subjects were not significantly different when compared to the cognitively <strong>in</strong>tact subjects. Incontrast, the AD patients were characterized by significantly smaller frontal as well as hippocampal<strong>and</strong> temporal lobe volumes bilaterally <strong>in</strong> comparison to both the AACD <strong>and</strong> control group (frontal: F= 4.1; df = 2,49; p < 0.05; temporal right: F = 8.6; df = 2,49; p
6Johannes Schröder et al.: <strong>Structural</strong> <strong>MRI</strong> – fibd<strong>in</strong>gs <strong>in</strong> MCI <strong>and</strong> ADTable 1. Cl<strong>in</strong>ical characteristic <strong>and</strong> (corrected) volumetric variables <strong>in</strong> mild cognitive impairment/AACD, Alzheimer’sdisease, <strong>and</strong> cognitively <strong>in</strong>tact control subjects. Results of an analysis of variance (Duncan’s test on the 5% level)Tab. 1. Zestawienie cech kl<strong>in</strong>icznych i wartości zmiennych objętościowych u osób z zespołem lekkich zaburzeńpoznawczych (MCI) i chorobą Alzheimera (AD) oraz w grupie kontrolnej bez zaburzeń poznawczych. Wyniki analizywariancji (test Duncana na poziomie 5%)1controls2MCI3ADFDuncan’sTest (5%)N 21 21 10Age(years)66.19 (±0.75) 66.57 (±0.60) 66.00 (±7.66) 0.87 n.sig.Sex(m/f)10/11 11/10 6 / 4 n.sig. 1Education(years)10.1 (+1.7) 9.5 (+1) 10.0 (+1.5) 0.9 n.sig.GDS 1,29 (±0.46) 1,71 (±0.46) 3.90 (±0.88) 95.9 1< 2 < 3MMSE n.d. n.d. 19.2 (±3.85) n.d. n.d.TIV (cm 3 ) 1268 (±144) 1230.9 (+110) 1260 (±170) 0.41 n.sigWB 0.7 (+0.04) 0.69 (+0.025) 0.67 (±0.040) 2.8 1 > 3CSF 0.3 (+0.04) 0.31 (+0.025) 0.33 (±0.040) 2.1 n.sig.Frontal lobes 0.065 (+0.0097) 0.066 (+0.0095) 0.056 (+0.0072) 4.2 1, 2 > 3Temporallobe Right0.038 (+0.004) 0.037 (+0.0029) 0.032 (+0.0044) 8,6 1, 2 > 3Temporallobe Left0.036 (+0.0033) 0.035 (+0.0047) 0.030 (+0.0021) 8,5 1, 2 > 3Hippocampusright0.0024 (+0.00039) 0.0023 (+0.00048) 0.0016 (±0.00033) 13.5 1, 2 > 3Hippocampusleft0.0023 (+0.00029) 0.0024 (+0.00043) 0.0014 (±0.00025) 28.4 1, 2 > 3PHG right 0.0025 (+0.0003) 0.0022 (+0.0003) 0.0019 (±0.00033) 18.0 1 > 2 > 3PHG left 0.0027 (+0.00044) 0.0025 (+0.00041) 0.0018 (±0.00033) 14.4 1, 2 > 3AACD: ag<strong>in</strong>g-associated cognitive decl<strong>in</strong>e; AD: Alzheimer’s disease; GDS: Global Deterioration Scale; MMSE: M<strong>in</strong>iMental State Exam<strong>in</strong>ation; TIV: total <strong>in</strong>tracranial volume; WB: whole bra<strong>in</strong>; CSF: cerebrosp<strong>in</strong>al fluid; PHG: parahippocampalgyrus; n.d.: not done; n.sig.: not significant; 1 χ-test
7Johannes Schröder et al.: <strong>Structural</strong> <strong>MRI</strong> – fibd<strong>in</strong>gs <strong>in</strong> MCI <strong>and</strong> ADTable 2. Anatomical structures with significant loss of gray matter density <strong>in</strong> AD-patients compared to healthy controlsubjects ( height threshold p < 0.05 (corr.), extent threshold k = 1000 mm 3 = 1000 voxels).Tab. 2. Wykaz struktur anatomicznych, w których stwierdzono znacznie zmniejszoną gęstość istoty szarej u chorychz AD w porównaniu do grupy kontrolnej osób zdrowych (próg wysokości p < 0.05 (skoryg.), próg zasięgu k = 1000Anatomical structureHem.Cluster[mm 3 ]TMNI-coord<strong>in</strong>atesx,y,z [mm]1 C<strong>in</strong>gulate gyrus (anterior part) L/R 14629 7.37 -1 37 33Medial frontal gyrus (anterior part) 4.98 -2 53 172 Superor temporal sulcus R 9241 7.19 52 -34 2Superior temporal gyrus 5.74 64 -40 93 Inferior frontal sulcus L 3644 6.70 -46 15 35Superior temporal gyrus 4.11 -53 17 8Inferior frontal gyrus (triangular part) 3.88 -53 13 194 Hippocampus L 4946 6.06 -31 -19 -13Amygdala 5.20 -26 0 -205 Hippocampus R 2724 5.72 29 -10 -146 Middle frontal gyrus R 2997 5.37 46 16 42Inferior frontal gyrus (triangular part) 4.11 56 14 287 Ventral striatum / Caudate nucleus L / R 3226 5.06 -3 7 78 C<strong>in</strong>gulate sulcus / Precuneus L / R 1086 4.91 4 -49 389 Middle temporal gyrus L 4508 4.59 -59 -10 -11Superior temporal gyrus 4.12 -65 -32 1010 Inferior frontal gyrus R 7218 4.44 48 21 311 Postcentral gyrus (<strong>in</strong>ferior part) 4.37 45 -10 1612 Occipito-parietal sulcus L 9205 4.38 -44 -56 13Inferior parietal lobule 4.36 -61 -35 2913 Inferior frontal gyrus L 1651 4.14 -39 19 -614 Postcentral gyrus R 1145 4.09 64 -20 32Inferior parietal lobule 3.60 62 -28 33Thalamus L 2948 3.70 -10 -22 1115 Precentral gyrus R 2301 3.59 48 -10 4516 Inferior parietal lobule R 1398 3.51 52 -53 4817 Intraparietal sulcus 3.22 36 -50 51
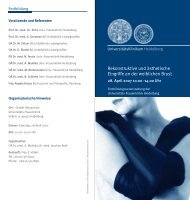
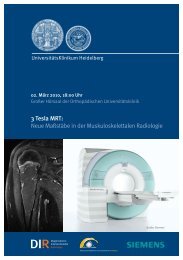
8Johannes Schröder et al.: <strong>Structural</strong> <strong>MRI</strong> – fibd<strong>in</strong>gs <strong>in</strong> MCI <strong>and</strong> ADFig. 1. Bra<strong>in</strong> regions show<strong>in</strong>g significant loss of gray matter density <strong>in</strong> AD patients compared to healthy controlssuperimposed onto a T1-weighted st<strong>and</strong>ard anatomic template (height threshold p < 0.05 (corr.), extent threshold k= 1000 mm 3 = 1000 voxels). Reader’s right is subjects’ right. Labels correspond to number<strong>in</strong>g <strong>in</strong> table 2. The dashedl<strong>in</strong>es <strong>in</strong>dicate the cut direction for the coronar slice <strong>in</strong> the lower row. The arrows between the coronar <strong>and</strong> the leftsagittal slice po<strong>in</strong>t to the left hippocampal regionRyc. 1. Obszary mózgu, w których stwierdzono znacznie zmniejszoną gęstość u chorych z AD w porównaniu do grupykontrolnej osób zdrowych. Obraz nadkładany na st<strong>and</strong>ardowym szablonie anatomicznym w widoku T1-zależnym.(próg wysokości p < 0.05 (skoryg.), próg zasięgu k = 1000 mm 3 = 1000 wokselów. Prawa strona obrazu odpowiadaprawej stronie osoby badanej. Etykiety nałożono zgodnie z ponumerowaniem w Tabeli 2. Przerwane l<strong>in</strong>ie wyznaczająkierunek przekroju dla projekcji koronowej w dolnym rzędzie. Strzałki pomiędzy przekrojami koronalnymi a lewymisagitalnymi wskazują na okolicę lewego hipokampaIn AD, VBM analysis revealed the substructures of the medial temporal lobe as well as the anteriorc<strong>in</strong>gulate gyrus <strong>and</strong> temporoparietal neocortical areas to undergo atrophic changes. These <strong>f<strong>in</strong>d<strong>in</strong>gs</strong> aregenerally <strong>in</strong> l<strong>in</strong>e with our results from the manual trac<strong>in</strong>g approach. Moreover, they strongly supportthe results of several other research groups us<strong>in</strong>g either ROI-based approaches or VBM [21-24, 36].In contrast to manual trac<strong>in</strong>g, VBM was not able to detect structural changes <strong>in</strong> MCI subjects comparedto healthy controls. This observation is contradictory to some recently published VBM studiesthat reported measurable loss of gray matter density <strong>in</strong> MCI <strong>in</strong> certa<strong>in</strong> bra<strong>in</strong> regions [25, 26]. Thisdivergent result may be related to aspects of sample selection: Most importantly, our sample consistedof r<strong>and</strong>omly selected subjects drawn from a population based sample, whereas the above mentionedstudies analyzed <strong>MRI</strong>-scans of on dem<strong>and</strong> patients which might have been already <strong>in</strong> a more advancedstage of their disorder.Nonetheless, our <strong>f<strong>in</strong>d<strong>in</strong>gs</strong> lead to the hypothesis that manual trac<strong>in</strong>g is more sensitive to discretestructural changes, as this technique could, <strong>in</strong> contrast to VBM, successfully differentiate subjects withMCI from healthy controls. The sensitivity of the VBM algorithm might be dim<strong>in</strong>ished by normalizationerrors, segmentation <strong>in</strong>accuracy <strong>and</strong> smooth<strong>in</strong>g effects. To address these potential methodologicallimitations, further studies – compar<strong>in</strong>g the different techniques – are needed. Furthermore, we wouldlike to underl<strong>in</strong>e that VBM relies on the application of a t-test as the fundamental statistical tool whichmakes it unsuitable for the comparison of s<strong>in</strong>gle subjects with a normative template. Accord<strong>in</strong>gly, this
9Johannes Schröder et al.: <strong>Structural</strong> <strong>MRI</strong> – fibd<strong>in</strong>gs <strong>in</strong> MCI <strong>and</strong> ADapproach solely allows group comparisons. In contrast, ROI-based measures can be used to estimateatrophy <strong>in</strong> <strong>in</strong>dividual cases which makes it more suitable for diagnostic purposes (e.g. with<strong>in</strong> a memorycl<strong>in</strong>ic sett<strong>in</strong>g). Despite these restrictions, VBM is a time time-efficient, almost fully automatic <strong>and</strong> thereforeobserver <strong>in</strong>dependent method which was useful <strong>in</strong> reveal<strong>in</strong>g morphological differences betweenpatients with mild to moderate AD <strong>and</strong> healthy controls.References[1] Scheltens P. Early diagnosis of dementia: neuroimag<strong>in</strong>g. J Neurol; 1999, 246:16-20.[2] Frisoni GB. <strong>Structural</strong> imag<strong>in</strong>g <strong>in</strong> the cl<strong>in</strong>ical diagnosis of Alzheimer’s disease: problems <strong>and</strong> tools.J Neurol Neurosurg Psychiatry, 2001, 70:711-8.[3] Jack CR, Jr., Petersen RC, Xu YC, O’Brien PC, Smith GE, Ivnik RJ, Boeve BF, War<strong>in</strong>g SC,Tangalos EG, Kokmen E. Prediction of AD with <strong>MRI</strong>-based hippocampal volume <strong>in</strong> mild cognitiveimpairment. Neurology; 1999, 52:1397-403.[4] Petersen RC, Smith GE, War<strong>in</strong>g SC, Ivnik RJ, Tangalos EG, Kokmen E. <strong>Mild</strong> cognitive impairment:cl<strong>in</strong>ical characterization <strong>and</strong> outcome. Arch Neurol, 1999, 56:303-8.[5] Ritchie K, Artero S, Touchon J. Classification criteria for mild cognitive impairment: a population--based validation study. Neurology , 2001, 56:37-42.[6] Braak H, Braak E. Neuropathological stage<strong>in</strong>g of Alzheimer-related changes. Acta Neuropathol(Berl); 1991, 82:239-59.[7] Mizutani T, Kasahara M. Hippocampal atrophy secondary to entorh<strong>in</strong>al cortical degeneration <strong>in</strong>Alzheimer-type dementia. Neurosci Lett; 1997, 222:119-22.[8] Delacourte A, David JP, Sergeant N, Buee L, Wattez A, Vermersch P, Ghozali F, Fallet-BiancoC, Pasquier F, Lebert F, Petit H, Di Menza C. The biochemical pathway of neurofibrillarydegeneration <strong>in</strong> ag<strong>in</strong>g <strong>and</strong> Alzheimer’s disease. Neurology, 1999, 52:1158-65.[9] Van Hoesen GW, August<strong>in</strong>ack JC, Dierk<strong>in</strong>g J, Redman SJ, Thangavel R. The parahippocampalgyrus <strong>in</strong> Alzheimer’s disease. Cl<strong>in</strong>ical <strong>and</strong> precl<strong>in</strong>ical neuroanatomical correlates. Ann N Y AcadSci 911:254-74.[10] Bott<strong>in</strong>o CM, Castro CC, Gomes RL, Buchpiguel CA, Marchetti RL, Neto MR. Volumetric <strong>MRI</strong>measurements can differentiate Alzheimer’s disease, mild cognitive impairment, <strong>and</strong> normal ag<strong>in</strong>g.Int Psychogeriatr; 2002, 14:59-72.[11] Hippocampal formation glucose metabolism <strong>and</strong> volume losses <strong>in</strong> MCI <strong>and</strong> AD. Neurobiol Ag<strong>in</strong>g,2001, 22:529-39.[12] Dickerson BC, Goncharova I, Sullivan MP, Forchetti C, Wilson RS, Bennett DA, BeckettLA, deToledo-Morrell L. <strong>MRI</strong>-derived entorh<strong>in</strong>al <strong>and</strong> hippocampal atrophy <strong>in</strong> <strong>in</strong>cipient <strong>and</strong> verymild Alzheimer’s disease. Neurobiol Ag<strong>in</strong>g; 2001, 22:747-54.[13] Du AT, Schuff N, Amend D, Laakso MP, Hsu YY, Jagust WJ, Yaffe K, Kramer JH, Reed B,Norman D, Chui HC, We<strong>in</strong>er MW. Magnetic resonance imag<strong>in</strong>g of the entorh<strong>in</strong>al cortex <strong>and</strong>hippocampus <strong>in</strong> mild cognitive impairment <strong>and</strong> Alzheimer’s disease. J Neurol Neurosurg Psychiatry;2001, 71:441-7.[14] Pantel J, Kratz B, Essig M, Schröder J. Parahippocampal volume deficits <strong>in</strong> subjects with ag<strong>in</strong>g--associated cognitive decl<strong>in</strong>e. Am J Psychiatry; 2003, 160:379-82.[15] De Toledo-Morrell L, Goncharova I, Dickerson B, Wilson RS, Bennett DA. From healthyag<strong>in</strong>g to early Alzheimer’s disease: <strong>in</strong> vivo detection of entorh<strong>in</strong>al cortex atrophy. Ann N Y AcadSci; 2000, 911:240-53.[16] Juottonen K, Laakso MP, Insausti R, Lehtovirta M, Pitkanen A, Partanen K, So<strong>in</strong><strong>in</strong>en H. Volumesof the entorh<strong>in</strong>al <strong>and</strong> perirh<strong>in</strong>al cortices <strong>in</strong> Alzheimer’s disease. Neurobiol Ag<strong>in</strong>g; 1998, 19:15-22.[17] Killiany RJ, Hyman BT, Gomez-Isla T, Moss MB, Kik<strong>in</strong>is R, Jolesz F, Tanzi R, Jones K,Albert MS. <strong>MRI</strong> measures of entorh<strong>in</strong>al cortex vs hippocampus <strong>in</strong> precl<strong>in</strong>ical AD. Neurology;2002, 58:1188-96.[18] Xu Y, Jack CR, Jr., O’Brien PC, Kokmen E, Smith GE, Ivnik RJ, Boeve BF, Tangalos RG,Petersen RC. Usefulness of <strong>MRI</strong> measures of entorh<strong>in</strong>al cortex versus hippocampus <strong>in</strong> AD. Neurology;2000, 54:1760-7.[19] Pruessner JC, Li LM, Serles W, Pruessner M, Coll<strong>in</strong>s DL, Kabani N, Lupien S, Evans AC.Volumetry of hippocampus <strong>and</strong> amygdala with high-resolution <strong>MRI</strong> <strong>and</strong> three-dimensional analysissoftware: m<strong>in</strong>imiz<strong>in</strong>g the discrepancies between laboratories. Cereb Cortex; 2000, 10:433-42.
10Johannes Schröder et al.: <strong>Structural</strong> <strong>MRI</strong> – fibd<strong>in</strong>gs <strong>in</strong> MCI <strong>and</strong> AD[20] Frackowiak RSJ, Friston KJ, Frith CD, Dolan R, Maziotta JC. Human bra<strong>in</strong> function. AcademicPress; 1997.[21] Baron JC, Chetelat G, Desgranges B, Perchey G, L<strong>and</strong>eau B, de la Sayette V, Eustache F.In vivo mapp<strong>in</strong>g of gray matter loss with voxel-based morphometry <strong>in</strong> mild Alzheimer’s disease.Neuroimage; 2001, 14:298-309.[22] Busatto GF, Garrido GE, Almeida OP, Castro CC, Camargo CH, Cid CG, Buchpiguel CA,Furuie S, Bott<strong>in</strong>o CM. A voxel-based morphometry study of temporal lobe gray matter reductions<strong>in</strong> Alzheimer’s disease. Neurobiol Ag<strong>in</strong>g; 2003, 24:221-31.[23] Frisoni GB, Testa C, Zorzan A, Sabattoli F, Beltramello A, So<strong>in</strong><strong>in</strong>en H, Laakso MP. Detectionof gray matter loss <strong>in</strong> mild Alzheimer’s disease with voxel based morphometry. J Neurol NeurosurgPsychiatry; 2002, 73:657-64.[24] Karas GB, Burton EJ, Rombouts SA, van Schijndel RA, O’Brien JT, Scheltens P, McKeithIG, Williams D, Ballard C, Barkhof F. A comprehensive study of gray matter loss <strong>in</strong> patientswith Alzheimer’s disease us<strong>in</strong>g optimized voxel-based morphometry. Neuroimage; 2003, 18:895--907.[25] Chetelat G, Desgranges B, De La Sayette V, Viader F, Eustache F, Baron JC. Mapp<strong>in</strong>g graymatter loss with voxel-based morphometry <strong>in</strong> mild cognitive impairment. Neuroreport; 2002,13:1939-43.[26] Karas GB, Scheltens P, Rombouts SA, Visser PJ, van Schijndel RA, Fox NC, Barkhof F.Global <strong>and</strong> local gray matter loss <strong>in</strong> mild cognitive impairment <strong>and</strong> Alzheimer’s disease. Neuroimage;2004, 23:708-16.[27] Mart<strong>in</strong> P, Mart<strong>in</strong> M. Design und Methodik der Interdiszipl<strong>in</strong>ären Längsschnittstudie des Erwachsenenalters,<strong>in</strong>: Aspekte der Entwicklung im mittleren und höheren Lebensalter. Ergebnisse derInterdiszipl<strong>in</strong>ären Längsschnittstudie des Erwachsenenalters (ILSE). Edited by Mart<strong>in</strong> P, Ettrich KU,Lehr U, Roether D, Mart<strong>in</strong> M, Fischer-Cyrulies A. Darmstadt, Ste<strong>in</strong>kopff:17-27, 2000.[28] Schönknecht P., Pantel J., Kruse A., Schröder J. Prevalence <strong>and</strong> natural course of ag<strong>in</strong>g-associatedcognitive decl<strong>in</strong>e <strong>in</strong> a population based sample of “young-old” subjects. Am J. Psychiatry:(<strong>in</strong> press).[29] Ag<strong>in</strong>g-associated cognitive decl<strong>in</strong>e. Work<strong>in</strong>g Party of the International Psychogeriatric Association<strong>in</strong> collaboration with the World Health Organization. Int Psychogeriatr, 1994, 6:63-8.[30] McKhann G, Drachman D, Folste<strong>in</strong> M, Katzman R, Price D, Stadlan EM. Cl<strong>in</strong>ical diagnosis ofAlzheimer’s disease: report of the NINCDS-ADRDA Work Group under the auspices of Departmentof Health <strong>and</strong> Human Services Task Force on Alzheimer’s Disease. Neurology, 1984, 34:939-44.[31] Reisberg B, Ferris SH, de Leon MJ, Crook T. The Global Deterioration Scale for assessment ofprimary degenerative dementia. Am J Psychiatry, 1982, 139:1136-9.[32] Pantel J, Schröder J, Schad LR, Friedl<strong>in</strong>ger M, Knopp MV, Schmitt R, Geissler M, Bluml S,Essig M, Sauer H. Quantitative magnetic resonance imag<strong>in</strong>g <strong>and</strong> neuropsychological functions<strong>in</strong> dementia of the Alzheimer type. Psychol Med, 1997, 27:221-9.[33] Friedl<strong>in</strong>ger M, Schad LR, Bluml S, Tritsch B, Lorenz WJ. Rapid automatic bra<strong>in</strong> volumetryon the basis of multispectral 3D MR imag<strong>in</strong>g data on personal computers. Comput Med Imag<strong>in</strong>gGraph, 1995, 19:185-205.[34] Friedl<strong>in</strong>ger M, Schröder J, Schad LR. Ultra-fast automated bra<strong>in</strong> volumetry based on bispectralMR imag<strong>in</strong>g data. Comput Med Imag<strong>in</strong>g Graph, 1999, 23:331-7.[35] Pantel J, Schröder J, Essig M, Jauss M, Schneider G, Eysenbach K, von Kummer R,Baudendistel K, Schad LR, Knopp MV. In vivo quantification of bra<strong>in</strong> volumes <strong>in</strong> subcorticalvascular dementia <strong>and</strong> Alzheimer’s disease. An <strong>MRI</strong>-based study. Dement Geriatr Cogn Disord,1998, 9:309-16.[36] Pantel J, Schönknecht P, Essig M, Schröder J. Distribution of cerebral atrophy assessed bymagnetic resonance imag<strong>in</strong>g reflects patterns of neuropsychological deficits <strong>in</strong> Alzheimer’s dementia.Neurosci Lett, 2004, 361:17-20.Otrzymano / Received 14.03.2005Zrecenzowano/ Reviewed 28.03.2005Zatwierdzono do druku / Accepted 30.03.2005