Lab #6: Cellular Respiration
Lab #6: Cellular Respiration
Lab #6: Cellular Respiration

You also want an ePaper? Increase the reach of your titles
YUMPU automatically turns print PDFs into web optimized ePapers that Google loves.
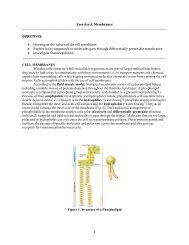
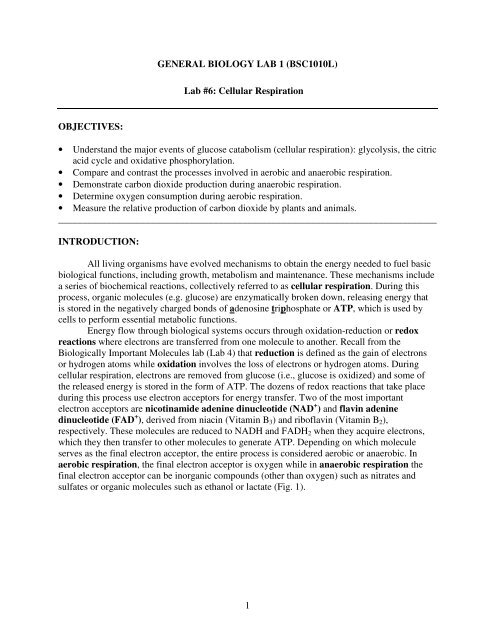
Figure 1. Comparison of redox reactions in aerobic and anaerobic respiration<strong>Cellular</strong> respiration (Fig. 2) can be divided into four stages:(1) Glycolysis(2) Pyruvate oxidation(3) Kreb’s cycle(4) Electron Transport Chain and ChemiosmosisFigure 2. An Overview of Aerobic <strong>Respiration</strong>2
fermentation occurs in organisms such as yeast (Fig. 4a) which have been utilized industrially forfood and alcoholic beverage production. Lactic acid fermentation, on the other hand, occurs inanimal cells. For example, when oxygen is not readily available to muscle tissue, the musclecells use lactic acid fermentation to produce ATP (Fig. 4b). Build up of lactic acid is the primarycause of muscle fatigue, often experienced during strenuous exercise. Overall, the anaerobicprocess yields a net of 2ATP, an 18-fold decrease in ATP production (per glucose molecule)compared to aerobic respiration.a) b)Figure 4. Anaerobic respiration: a) alcohol fermentation and b) lactic acid fermentationFigure 5 summarizes the basic differences between the products of aerobic and anaerobiccellular respiration. While all three types of cellular respiration (aerobic respiration, alcohol andlactic acid fermentation) produce carbon dioxide (CO 2 ), water (H 2 O), energy (ATP) and heat,they do so at different efficiencies. Both types of anaerobic fermentation produce a net total of 2ATP since they only undergo glycolysis. In contrast, during aerobic respiration, up to 38 ATPmolecules are produced through the continuous redox reactions of glycolysis, pyruvateoxidation, Krebs cycle, and ETC stages of glucose metabolism. Thus, aerobic respiration, whencompared to anaerobic respiration, is a much more efficient process for ATP production.Aerobic respiration:C 6 H 12 O 6 + 6O 26CO 2 + 6H 2 O +ATP +HeatAnaerobic fermentation (plants and some microbes):C 6 H 12 O 6(Glucose)2C 2 H 5 OH + 2CO 2 +ATP + Heat(Ethanol)Anaerobic fermentation (animals and some microbes):C 6 H 12 O 62CH 3 CHOHCOOH +ATP + Heat(Lactic Acid)Figure 5. Equations for different forms of cellular respiration4
Monitoring/ measuring fermentation (will be performed on days 7 and 14):Each group will need to measure the following variables in Tables 1 and 2:• Table 1o Presence/absence of bubbles producedo Presence/absence of sediment (deposit formed at the bottom of the flask)o Circumference of the balloon for your group’s flask using the same stringfrom day 0. Make sure to record the circumference for day 7 and day 14 bymarking each day’s point on the string with a Sharpie marker or colored tape.Table 1:Day 0 Day 7 Day 14DissolvedMass ofsucrose(g)0presenceofsediment/bubblesCO 2 levels =Ballooncircumferencepresenceofsediment/bubblesCO 2 levels =Ballooncircumferencepresenceofsediment/bubblesCO 2 levels =Ballooncircumference37.556.2575112.5150• Table 2o Taste the wine on days 0 and 14. On a scale of 0-5, with 5 being very sweetand 0, not sweet at all; compare the sweetness of the solutions.Table 2:Taste Observation (0-5)Dissolved Mass of Sucrose (g) Day 0 Day 14037.556.2575112.51507
Questions:1. Was there a noticeable increase in the number of bubbles and/or presence of sedimentfor all treatments over time?2. What happened to the balloon circumference of each flask as the fermentation processprogressed?3. How does balloon circumference relate to the amount of carbon dioxide producedduring fermentation?4. Using the graph paper provided, plot the change in CO 2 over time for each treatment.5. What happens to CO 2 levels with increasing sugar concentration? Is this patternobserved for all sucrose treatments?6. Based on your results, can you explain which ingredients are essential forfermentation to occur and why?8
7. Overall, what can you conclude about your hypotheses? Explain.______________________________________________________________________________TASK 2 - Demonstration of Aerobic <strong>Respiration</strong>: Consumption of O 2In this task you will examine aerobic respiration by measuring the amount of oxygen consumedby germinating and dormant (heat-killed) peas. In addition, you will assess the effect oftemperature on the rate of aerobic respiration by performing the experiment at two differenttemperatures.Develop a Hypothesis:Given your knowledge of aerobic respiration, what can you predict about respiration rates ingerminating vs. dormant peas? Write your hypotheses (H o and H a ) below.State your hypotheses (H o and H a ) regarding the effects of temperature on respiratory rate ingerminating vs. dormant peas below.Procedure:1. Your TA will assign half of the class to perform the experiment in freezing conditionsand the other half at room temperature. Depending on your assignment, your groupwill need to either setup an ice water bath or a room temperature water bath. Oncethis has been done, record the temperature of your group’s water bath in the spaceprovided below.Water Bath Temp: _____°C9
3. Place all three tubes in the water bath (See Fig 7). The tubes should be submerged inwater/ice at least ¾ of the way up to the stopper. Allow the tubes to equilibrate at thistemperature for 10 min.Figure 7. Water bath setup showing respirometers (view from the top)4. Add 1 drop of colored dye into the tip of each of the three pipettes making sure thatyou don’t lift the tubes out of the water bath.5. Allow the tubes to equilibrate for 5 min and then record the temperature of the waterbath as well as the initial location of the dye in the corresponding table below.6. Record the water bath temperature as well as dye location for each tube every 10 min(Total time = 30 min). Make sure to also record the results obtained by a neighboringgroup for a different temperature treatment.Table 3: Ice water bath ResultsTime(min)0102030Temp of waterbath ( o C)Tube 1 pipettereading (mL)Tube 2 pipettereading (mL)Tube 3 pipettereading (mL)11
5. Explain how this experiment demonstrated oxygen consumption as a part of cellularrespiration.6. Overall, what can you conclude about your hypotheses? Explain.______________________________________________________________________________TASK 3 - Demonstration of Aerobic <strong>Respiration</strong>: Production of CO 2When eukaryotic organisms respire they release CO 2 which can combine with H 2 0 to formcarbonic acid (H 2 CO 3 ). In general, acidic solutions such as H 2 CO 3 (pH less than 7) have a largerconcentration of H + ions while basic ones (pH greater than 7) contain more OH - ions (Fig. 3). Anindicator, such as phenolphthalein i can be used to detect changes in pH resulting from CO 2production during cellular respiration. In an acidic solution, phenolphthalein is clear, but in basicsolutions it turns pink. During this task you will examine aerobic respiration by measuring thevolume of NaOH required to neutralize the acid produced by actively respiring animal (snails)and plant (Elodea) cells.13
Figure 3. pH ScaleQuestions:a. What major energy producing process is characteristic of plant cells but not animal cells?b. What gas is consumed in this process?14
Develop a Hypothesis:Considering the set-up for this procedure (Table 5), state what you expect to occur whencomparing respiratory rates in animals vs. plants. Write your hypotheses (H o and H a ) in the spaceprovided below.Procedure:1. Place 75mL pond water into each of 4 labeled beakers (see Table 5).2. Obtain the organisms listed in Table 3.3. Determine the volume of each by water displacement (refer to <strong>Lab</strong> 1 for instructions)using a 100mL graduated cylinder.4. Add each organism to the corresponding beaker and then cover each with parafilm. Forthe Elodea in the dark setup, place the covered beaker underneath a coffee can.5. Allow the organisms to respire for 15 min and then return them to their original culturebowls.6. Add 4 drops of phenolphthalein to each beaker. The contents should remain clear becausethe solutions are acidic7. Add NaOH drop by drop to the contents of the control beaker to determine the number ofdrops it takes to turn the solution pink (20 drops = 1mL). After each drop thoroughly mixthe contents of the beaker.8. Record your results in Table 3.9. Repeat steps 6 and 7 for each of the remaining beakers.Table 5:BeakerSnails –TA setupElodeaTotal Volumeof Organisms(mL)Milliliters (mL)of NaOH toreach endpointRelative <strong>Respiration</strong>Rate of Organisms(mL NaOH)<strong>Respiration</strong> rateper milliliter (mL)of organismElodea(dark)Control15
10. To calculate the relative respiration rate of each organism, subtracting mL NaOH addedto the control beaker from the milliliters added to each beaker. Record your results inTable 5.11. To determine the respiration rate per milliliter of organism, divide the relative respirationrate by the volume of each organism. Record your results in Table 5.Questions:1. What was the purpose of including the 4 th setup (control)?2. What was the purpose of including the two different plant/light setups?3. Using the data collected from this experiment, what can you conclude about respiratoryrates in animals vs. plants?4. Do you think the rates of respiration might differ for other plant or animal species?Explain.16
5. What possible sources of error are associated with using pond water for this procedure?6. Based on your results, what can you conclude about your hypotheses? Explain.______________________________________________________________________________LOOK AHEAD:• Before coming to lab next week, make sure to read the Cell Cycle, Mitosis and MeiosisTask sheet as well as Exercises 14 & 15 in your lab manual.______________________________________________________________________________17