Full Text - Turkish Journal of Fisheries and Aquatic Sciences
Full Text - Turkish Journal of Fisheries and Aquatic Sciences
Full Text - Turkish Journal of Fisheries and Aquatic Sciences

You also want an ePaper? Increase the reach of your titles
YUMPU automatically turns print PDFs into web optimized ePapers that Google loves.
<strong>Turkish</strong> <strong>Journal</strong> <strong>of</strong> <strong>Fisheries</strong> <strong>and</strong> <strong>Aquatic</strong> <strong>Sciences</strong> 12: 391-396 (2012)www.trjfas.orgISSN 1303-2712DOI: 10.4194/1303-2712-v12_2_27Had Been Observing the Acidification <strong>of</strong> the Black Sea Upper Layer in XXCentury?A. Polonsky 1, *1 Marine Hydrophysical Institute, Kapitanskaya St. Sevastopol, 99011, The Crimea, Ukraine.* Corresponding Author: Tel.: +380.692 933085 ; Fax: +380.692 545241;E-mail: apolonsky5@mail.ruReceived 15 March 2012Accepted 17 June 2012AbstractThe article’s goal is to assess the rate <strong>of</strong> acidification <strong>of</strong> the Black sea upper layer in XX century using historical datasince 1924. It is shown that statistically significant century-scale acidification cannot be extracted, while decadal-scalereduction <strong>of</strong> pH has been really observing in 1960’s <strong>and</strong> between 1980 <strong>and</strong> 2000 in spite <strong>of</strong> high noise level <strong>and</strong> intenseinterannual pH variability. The rate <strong>of</strong> acidification for these periods reached 0.4 (0.2) pH units per decade at the surface (10m depth). Such high level <strong>of</strong> acidification <strong>of</strong> the Black sea upper layer is mostly due not to the rise <strong>of</strong> carbon dioxideconcentration in the atmosphere, but to natural quasi-periodical decadal-scale intensification <strong>of</strong> upward motions in thesubsurface layer <strong>of</strong> the Black sea transporting the water with low-pH to the surface. Rough assessment <strong>of</strong> recent century-scalerate <strong>of</strong> acidification <strong>of</strong> the surface Black sea layer shows that its likely magnitude lies in the range -0.1 to -0.5 pH units per100 years.Keywords: pH variability, quasi-periodical decadal-scale intensification <strong>of</strong> vertical motion in the Black sea, space-timeinhomogeneity <strong>of</strong> pH observations.IntroductionOne <strong>of</strong> the principal properties <strong>of</strong> the surfaceocean/sea layer changing as a result <strong>of</strong> increasedconcentration <strong>of</strong> carbon dioxide in the troposphere isрН. In fact, its magnitude characterizes the acidity <strong>of</strong>sea waters. Increasing <strong>of</strong> acidity leads to pHdecreasing. Ocean/sea acidification should beobserved as a result <strong>of</strong> uptake <strong>of</strong> part <strong>of</strong> emittedcarbon dioxide from the troposphere. Publishedresults show that around 30% <strong>of</strong> totalanthropogenically emitted СО 2 is sinking into theoceans <strong>and</strong> this leads to рН decreasing in the surfacewaters <strong>of</strong> the World Ocean (IPCC4 Assessment,2007; Fierer et al., 2006). Ocean acidification inrecent climatic epoch <strong>and</strong> expected pH decreasing inXXI century reach approximately -0.3 <strong>and</strong> -0.4 pHunits per century, respectively. This is potentiallydangerous for the marine biota (Caldeira <strong>and</strong> Wickett,2003; Kerr, 2010). Acidification <strong>of</strong> different timescales can be also a result <strong>of</strong> sea water pollution. Thiskind <strong>of</strong> acidification primarily manifests itself in theupper sea layer <strong>of</strong> coastal regions.At the same time there are regional naturalinterannual to millennium-scale fluctuations <strong>of</strong> pHwhich have not any relations with anthropogenic© Published by Central <strong>Fisheries</strong> Research Institute (CFRI) Trabzon, Turkeyin cooperation with Japan International Cooperation Agency (JICA), Japanactivity. For instance, El Niño events can causedramatic changes <strong>of</strong> pH in the tropical regions(Normile, 2010). Other natural physical processes(such as intensified upwelling) can be also one <strong>of</strong> thereasons <strong>of</strong> pH reduction in the upper marine layer<strong>and</strong>, hence, lead to its acidification (IPCC Workshop,2011). At the geological scales (T~ 10 3 to 10 4 years<strong>and</strong> more) quite fast (in comparison with the recentvariations) changes <strong>of</strong> troposphere carbon dioxideconcentration <strong>and</strong> associated pH decreasing in theupper layer <strong>of</strong> World Ocean occurred e.g., about 40million years ago. In that time, the concentration <strong>of</strong>СО 2 in the low troposphere was at least half an orderas larger as the recent concentration, temperature <strong>of</strong>the World Ocean was higher by about 5°С <strong>and</strong> рНwas anomalously low. Enhanced volcanic activity inthe Himalaya region was likely cause <strong>of</strong> additionalemission <strong>of</strong> СО 2 <strong>and</strong> associated ocean acidification(Pearson, 2010). That is why the most recentdefinition accepted by IPCC WGII (IPCC Workshop,2011) separates the ocean acidification <strong>and</strong>anthropogenic ocean acidification.So, to specify the relative significance <strong>of</strong>anthropogenic <strong>and</strong> natural processes in marineacidification at the different time scales <strong>and</strong> fordifferent regions is important task. Study <strong>of</strong> such kind
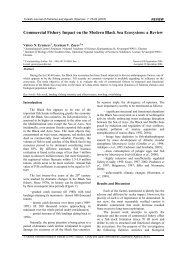
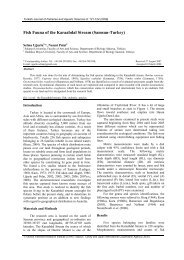
392 A. Polonsky / Turk. J. Fish. Aquat. Sci. 12: 391-396 (2012)for the Black sea has been recently begun by author(IPCC Workshop, 2011; Polonsky, 2012) Presentarticle is continuing the analysis <strong>of</strong> recentacidification <strong>of</strong> the Black sea upper layer.Data <strong>and</strong> MethodologyIn the present study, the most comprehensiveregional historical pH data from oceanographicdatabase <strong>of</strong> Marine Hydrophysical Institute (Eremeev,2004) for 1924-2000’s have been used. Totally 44 635samples <strong>of</strong> sea water at the st<strong>and</strong>ard levels from thesurface to 2000 m are available for specified period.Space distribution <strong>of</strong> pH measurements is done at theinsertion to Figure 1. In spite <strong>of</strong> numerousobservations their quantity <strong>and</strong> quality are not enoughfor reliable assessment <strong>of</strong> century-scale trend. Themost reliable data are available for the last decades <strong>of</strong>XX century (Polonsky, 2012; see also below).To reduce the noise level which is due tor<strong>and</strong>om errors, poor sampling for resolution <strong>of</strong>relatively high-frequency (small/meso-scale) <strong>and</strong>seasonal fluctuations, the data have been at firstaveraged over entire basin for each year <strong>and</strong> st<strong>and</strong>ardlevel. As a result, the mean pH pr<strong>of</strong>ile in the Blacksea has been obtained. Then, the time pH series forupper levels (surface <strong>and</strong> 10 m) have been analyzed toextract the interannual to century-scale variability.Vertical velocity in the upper layer wasestimated using Ekman theory <strong>and</strong> wind fields fromtwo (NCEP <strong>and</strong> ERA) re-analyses outputs [furtherdetails, see in (Polonsky <strong>and</strong> Shokurova, 2009)]. Thequantitative impact <strong>of</strong> upward motion <strong>of</strong> subsurfacelow-pH water on the variability <strong>of</strong> pH in the upperlayer is assessed by multiplication <strong>of</strong> vertical velocity<strong>and</strong> vertical pH gradient.Results <strong>and</strong> DiscussionGeneral Features <strong>of</strong> pH DistributionThe average vertical pH pr<strong>of</strong>ile shows that pH issharply decreasing between surface <strong>and</strong> core <strong>of</strong> coldintermediate layer. Reduction <strong>of</strong> pH within watercolumn is approximately 0.55 pH units there (frommore than 8.4 to approximately 7.9 pH units) (Figure1). This is rather well-know peculiarity <strong>of</strong> vertical pHdistribution in the Black sea (Simonov <strong>and</strong> Al’tman,1991; Oguz, 2008). Such vertical structure leads topH permanent decreasing in the subsurface layer <strong>of</strong>central part <strong>of</strong> Western <strong>and</strong> Eastern cyclonic gyreswhere the upward motion occurs (Krivosheya et al.,2000; Kostianoy <strong>and</strong> Kosarev, 2007). This reductionis about 0.5 pH units at the 100 m depth inН (m)04008001200160020007.6 7.8 8 8.2 8.4 8.6 рН unitsFigure 1. Mean pr<strong>of</strong>ile <strong>of</strong> Black sea рН averaged at the st<strong>and</strong>ard levels using all data from 1924 to 2000. Insertion shows spacedistribution <strong>of</strong> pH observations for entire period (1924-2000’s).Insertion to Figure 1
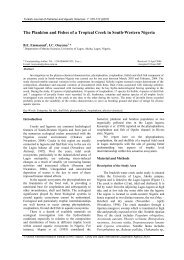
A. Polonsky / Turk. J. Fish. Aquat. Sci. 12: 391-396 (2012) 393comparison with the coastal periphery <strong>of</strong> Rim current(Polonsky, 2012).At the surface, the gyre-related pH patterncannot be extracted over the noise level (Figure 2).However, the average pH within the upper mixedlayer is decreasing when subsurface upward velocityis increasing. For instance, difference <strong>of</strong> pH (averagedover entire basin) between seasonal extremes <strong>of</strong>climatic Black sea circulation is about 0.15 pH units(Polonsky, 2012).There are also some peculiarities <strong>of</strong> space pHdistribution at the surface in the vicinity <strong>of</strong> rivers’inflow, especially when the seasonal rivers’ dischargeis at a maximum (see, February-March pHdistribution in the N-W part <strong>of</strong> the basin at Figure 2a).These peculiarities create the space pHinhomogeneities with typical magnitude reaching 0.5pH units. As a result <strong>of</strong> that <strong>and</strong> space-time datacoverage inhomogeneity, the noise level in lowfrequencyvariability <strong>of</strong> the pH time series annuallyaveraged over entire basin remains quite high evenwhen small/meso-scale noise is effectively filtered. Itis clear from Figure 3. However, a few importantresults concerning the low-frequency temporal pHvariability can be established at the significant level.They will be done <strong>and</strong> discuss below.Interannual to Decadal-Scale Variability <strong>of</strong> pH<strong>and</strong> Causes <strong>of</strong> Decadal pH ChangesIn spite <strong>of</strong> high noise level discussed above,Figure 3 clear demonstrates three followingremarkable points:1. pH in the upper layer <strong>of</strong> the Black sea wasdecreasing in 1960’s <strong>and</strong> between mid <strong>of</strong> 1980 <strong>and</strong>2000, while between early 1970 <strong>and</strong> mid <strong>of</strong> 1980’s itwas in general high. As a result, significant parabolicpH trend occurred in 1970 – 2000’s;2. acidification <strong>of</strong> the surface waters in late1980 to 2000 has been delayed in comparison with theacidification <strong>of</strong> subsurface waters by a few years;3. decadal-scale pH decreasing at the surfaceduring last 10-15 years <strong>of</strong> XX century exceeded thesimilar pH decreasing at 10 m. In fact, it reachedabout 0.4 pH units per decade at the surface, while at10m depth it was about 0.2 pH units per decade.The above first <strong>and</strong> second facts are consistentwith the explanation <strong>of</strong> pH decadal variability whichhas been done early in the author’s paper (Polonsky,2012). The suggestion was that such variability ismostly induced by the changes <strong>of</strong> Ekman pumpingintensity. In fact, the magnitude <strong>of</strong> quasi-periodicaldecadal changes <strong>of</strong> vertical velocity due to thevariations <strong>of</strong> wind field circl (or rot z τ, where τ iswind stress) <strong>of</strong> about 2 m per year is completelyenough to explain the entire decadal-scale variations<strong>of</strong> pH at the 10 m depth. In fact, multiplying the basicvertical gradient <strong>of</strong> pH within the upper layer (whichis about -0.01 pH units per meter, see Figure 1) byvertical velocity equaled to 2 m per year, one canreceive the observed rate <strong>of</strong> acidification at 10 mdepth (about 0.2 pH units per decade).464442464428 30 32 34 36 38 40ab8.98.88.78.68.58.48.38.28.187.97.87.77.67.57.44230 32 34 36 38 40 bFigure 2. Space distribution <strong>of</strong> pH at the Black sea surface for February-March (FM) (a) <strong>and</strong> August-September (AS) (b).Contour interval is 0.1 pH units. pH mean=8.36 <strong>and</strong> 8.40 pH units for FM <strong>and</strong> AS, respectively.
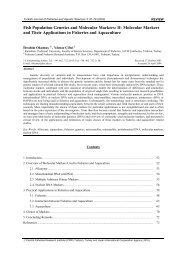
394 A. Polonsky / Turk. J. Fish. Aquat. Sci. 12: 391-396 (2012)pH9.28.8a8.487.61920 1940 1960 1980 2000 Years8.88.6b8.48.287.81920 1940 1960 1980 2000Figure 3. Interannual variability <strong>of</strong> mean annual рН averaged over the entire basin at the surface (а) <strong>and</strong> 10 m (b). Thick redlines specify the decadal-scale rate <strong>of</strong> acidification for the end <strong>of</strong> XX century, while thick black lines represents the(statistically insignificant) century-scale pH decreasingYearsFigure 4 confirms that associated (with the windfield variations) decadal-scale intensification <strong>of</strong>vertical velocity really occurred in 1960’s <strong>and</strong>between mid <strong>of</strong> 1980’s <strong>and</strong> mid <strong>of</strong> 1990’s. Magnitude<strong>of</strong> assessed decadal variations <strong>of</strong> averaged (over entirebasin) Ekman pumping using data from Figure 4 is afew times as smaller as 2 m per year. However, thisassessment underestimates the actual magnitude <strong>of</strong>vertical motions <strong>and</strong> their changes because <strong>of</strong> coarsespecial resolution <strong>of</strong> the wind fields (~100 to 200 km)which were used for drawing <strong>of</strong> Figure 4. Theutilization <strong>of</strong> higher-resolved wind field leads to moreaccurate assessment <strong>and</strong> necessary magnitude <strong>of</strong> theEkman pumping (Polonsky <strong>and</strong> Garmashov, 2010).The upward spread <strong>of</strong> analyzed signal(following from observed delay between surface <strong>and</strong>subsurface layers) confirms the reality <strong>of</strong> discussedmechanism. In fact, if the decadal-scale change <strong>of</strong>Ekman pumping intensity is about 2 m per year theassociated delay between pH signal at the surface <strong>and</strong>10 m depth is around 5 years. This is consistent withthe time series at Figures 3a <strong>and</strong> 3b.Possibility that discussed decadal-scalevariability <strong>of</strong> surface pH is entirely artificial <strong>and</strong> it isdue to space-time observational inhomogeneity isnegligible. In fact, if one compares Figures 2 <strong>and</strong> 5, itis clear that decadal-scale variations <strong>of</strong> averaged overentire basin pH at the surface exceeding 0.2 pH unitscannot be explained by such inhomogeneity taken intoaccount quite large number <strong>of</strong> independentobservations in different subregions <strong>of</strong> the Black sea.Certainly, the time differences which do not exceed0.1 - 0.2 pH units within decade can be due to spacetimedata inhomogeneity. For instance, Figures 5c <strong>and</strong>5d clear demonstrate that for the first part <strong>of</strong> 1990’sthe casts have been mostly carried out in the N-Wpart <strong>of</strong> the Black sea, while for the second part <strong>of</strong> thisdecade the observations have been mostlyconcentrated in the vicinity <strong>of</strong> the Crimea. Taken intoconsideration the space peculiarities <strong>of</strong> pHdistribution (see discussion above <strong>and</strong> Figure 2), onecan conclude that pH decreasing at the surface during1990’s <strong>of</strong> ~0.1-0.2 pH units (but not more!) can beexplained just by space-time data inhomogeneity. So,this can be concluded that analyzed decadal-scale pHvariations in the upper layer <strong>of</strong> the Black sea aremostly induced by changes <strong>of</strong> the Ekman pumping.Note that discussed variability <strong>of</strong> Ekman pumpingintensity is due to regional consequences <strong>of</strong> decadalscaleprocesses in the coupled ocean-atmospheresystem (Ozsoy <strong>and</strong> Mikaelyan, 1997; Polonsky <strong>and</strong>Garmashov, 2010).Assessment <strong>of</strong> Century-Scale Marine AcidificationFurther discussion concerns the assessment <strong>of</strong>possible recent rate <strong>of</strong> century-scale acidification <strong>of</strong>the upper layer in the Black sea. In contrast todecadal-scale pH reduction discussed above (which ismostly due to physical process), the century-scaleacidification is mostly due to long-term uptake <strong>of</strong>human-emitted additional carbon dioxide from the
ot z 10 -7 N/m 3A. Polonsky / Turk. J. Fish. Aquat. Sci. 12: 391-396 (2012) 3950.80.60.40.20-0.21950 1960 1970 1980 1990 2000 2010Figure 4. Time series <strong>of</strong> averaged over entire basin Ekman vertical velocity calculated using wind data <strong>of</strong> NCEP <strong>and</strong> ERAre-analyses (solid <strong>and</strong> dashed thin curves, respectively). Thick curves represent smoothed (by low-passed 11 yrs filter) timeseries. Positive values are due to upward motion.4644424028 30 32 34 36 38 40 42464442apH sttions 1924-1929pH stations 1963-19684028 30 32 34 36 38 40 42b46a46c44444240pH sttions 1924-192928 30 32 34 36 38 40 424240pH stations 1990-199428 30 32 34 36 38 40 4246b46d4444424046troposphere.Can we judge the rate <strong>of</strong> century-scaleacidification <strong>of</strong> the surface marine layer in the Blacksea from existed data? As a result <strong>of</strong> lack <strong>of</strong> data insome periods <strong>of</strong> XX century <strong>and</strong> high noise level, thecentury-scale linear pH trend is not significant eitherat the surface or 10 m depth (Figure 3). However, therough assessment <strong>of</strong> the century-scale pH trend in theupper layer can be done using followingconsiderations. First <strong>of</strong> all, the linear pH trend at thesurface is negative (about -0.1 pH units per 75 yearsor -0.13 pH units per 100 years, see Figure 3,a)although it is not significant. Then, the third pointmentioned above in the previous paragraph permits togive the upper assessment <strong>of</strong> recent rate <strong>of</strong> long-termacidification <strong>of</strong> the surface marine layer in the Blacksea using more reliable data <strong>of</strong> two final decades <strong>of</strong>XX century. In fact, the positive difference <strong>of</strong> rates <strong>of</strong>44424046444240pH stations 1963-196828 30 32 34 36 38 40 42pH stations 1990-199428 30 32 34 36 38 40 42pH stations 1995-200028 30 32 34 36 38 40 42cd4240pH stations 1995-200028 30 32 34 36 38 40 42Figure 5. Space distribution <strong>of</strong> pH observations for different periods: 1924-1929 (a), 1963-1968 (b) 1990-1994 (c) <strong>and</strong> 1995-2000 (d)acidification at the surface <strong>and</strong> 10 m depth betweenmid <strong>of</strong> 1980’s <strong>and</strong> 2000 can be (at least partly)attributed to the result <strong>of</strong> human carbon dioxideemission. Of course, there is the other reason <strong>of</strong> suchdifference. This is fast decreasing <strong>of</strong> number <strong>of</strong>observations with the depth resulting in morenumerous surface observations (in comparison withthe observations at the 10 m depth) in the shallowcoastal region <strong>of</strong> the N-W part <strong>of</strong> the Black sea in theearly 1990’s. This leads to enhanced artificial pHtrend at the surface (in comparison with 10 m depth)which can reach 0.1 to 0.2 pH units per decade for1990’s (see above discussion). The absence <strong>of</strong> visibledifferences between pH drop at the surface <strong>and</strong> 10 mdepth in 1960’s (cf., Figures 3a <strong>and</strong> 3b) also confirmsthat because in 1960’ the casts have not beenconcentrated in the N-W part <strong>of</strong> the Black sea (see,Figure 5b).