INFRASTRUCTURAL DEVELOPMENT IN INDIA: PRE AND POST ...
INFRASTRUCTURAL DEVELOPMENT IN INDIA: PRE AND POST ...
INFRASTRUCTURAL DEVELOPMENT IN INDIA: PRE AND POST ...

You also want an ePaper? Increase the reach of your titles
YUMPU automatically turns print PDFs into web optimized ePapers that Google loves.
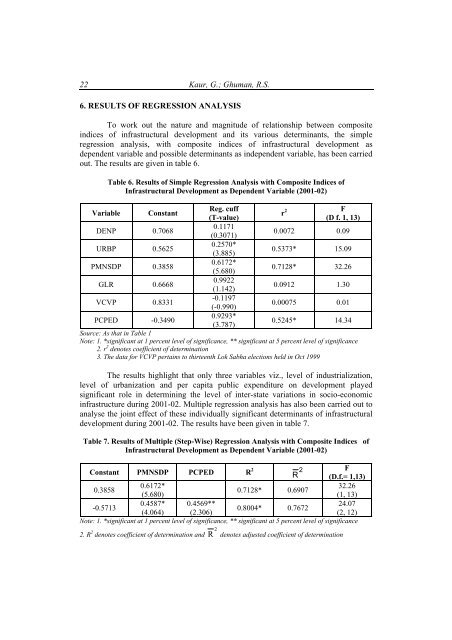
22 Kaur, G.; Ghuman, R.S.6. RESULTS OF REGRESSION ANALYSISTo work out the nature and magnitude of relationship between compositeindices of infrastructural development and its various determinants, the simpleregression analysis, with composite indices of infrastructural development asdependent variable and possible determinants as independent variable, has been carriedout. The results are given in table 6.Table 6. Results of Simple Regression Analysis with Composite Indices ofInfrastructural Development as Dependent Variable (2001-02)Variable ConstantReg. cuffr 2 F( T-value)(D f. 1, 13)DENP 0.70680.1171(0.3071)0.0072 0.09URBP 0.56250.2570*(3.885)0.5373* 15.09PMNSDP 0.38580.6172*(5.680)0.7128* 32.26GLR 0.66680.9922(1.142)0.0912 1.30VCVP 0.8331-0.1197(-0.990)0.00075 0.01PCPED -0.34900.9293*(3.787)0.5245* 14.34Source: As that in Table 1Note: 1. *significant at 1 percent level of significance, ** significant at 5 percent level of significance2. rdenotes coefficient of determination3. The data for VCVP pertains to thirteenth Lok Sabha elections held in Oct 1999The results highlight that only three variables viz., level of industrialization,level of urbanization and per capita public expenditure on development playedsignificant role in determining the level of inter-state variations in socio-economicinfrastructure during 2001-02. Multiple regression analysis has also been carried out toanalyse the joint effect of these individually significant determinants of infrastructuraldevelopment during 2001-02. The results have been given in table 7.Table 7. Res ults of Multiple (Step-Wise) Regression Analysis with Composite Indices ofInfrastructural Development as Dependent Variable (2001-02)Constant PMNSDP PCPED R 22FR (D.f.= 1,13)0.6172*32.260.3858 0.7128* 0.6907(5.680)(1, 13)0.4587*-0.57130.4569** 0.8004* 0.767224.07(4.064) (2.306)(2, 12)Note: 1. *significant at 1 percent level of significance, ** significant at 5 percent level of significance2. R 2 2denotes coefficient of determination and R denotes adjusted coefficient of determination